|
The American stock market has been experiencing several years of great performance. But as the old Blood Sweat and Tears song reminds us,
What goes up must come down
Spinnin' wheel got to go 'round
Talkin' 'bout your troubles it's a cryin' sin
Ride a painted pony let the spinnin' wheel spin
We imagine the inevitable market downturn and the many forms it could take. How steep? How long? How many false bottoms? How will it affect your
retirement income? How resilient is your investment portfolio?
Examples to Consider
Picture this scenario. (In this example, the portfolio value mimics the stock market's ups and downs.) So, you launch your retirement and decide you'll
take 5% annually from your $500,000 portfolio. This first year that withdrawal amounts to $25,000.
The second year your portfolio grows 10% to $522,500 and your 5% withdrawal is now
$26,125.
Now, what if in the third year the portfolio drops 20% to roughly $496,375? Withdraw the same 5% that year and you get only
$19,855, which is a 24% decrease in your income from the prior year.
Let's say the fourth year the market is flat. Your 5% withdrawal is now
$18,862.
And look at the changes to your portfolio value in this example. After only four years it has diminished to
three-quarters of its original value.
Here's an illustration of this scenario:
|
Year
What if the market ...
|
Beginning Portfolio
|
Withdrawal, Level %
|
Ending Portfolio
|
| Year 1 |
500,000
|
5% or 25,000
|
475,000
|
Year 2 ... increases by 10%:
|
522,500
|
5% or 26,125
|
496,375
|
| Year 3 ... drops 20%: |
397,100
|
5% or 19,855
|
377,245
|
| Year 4 ... stays level: |
377,245
|
5% or 18,862
|
358,383
|
Let's try that again, this time withdrawing a
steady dollar amount each year, rather than a percentage. And we'll adjust 2.5% annually for inflation. As the
illustration below shows, your withdrawal amounts are constant, which is useful, but the portfolio value decreases by more than
30% in four short years.
|
Year
What if the market ...
|
Beginning Portfolio |
Withdraw + Inflation |
Ending Portfolio |
|
Year 1
|
500,000 |
25,000 |
475,000 |
|
Year 2
... increases by 10%:
|
522,500 |
25,625 |
496,875 |
|
Year 3
... drops 20%:
|
397,500 |
26,265 |
371,235 |
|
Year 4
... stays level:
|
371,235 |
26,921 |
344,314 |
The Bucket Approach
Is there a way to avoid these dramatic changes? Yes! One solution is to use the
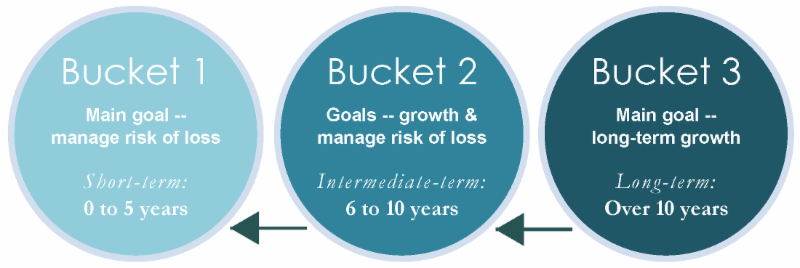
Bucket Approach. Here you have three buckets:
One bucket is for
immediate needs and is invested in liquid funds, like cash.
The second bucket is for
intermediate-term
needs and is invested in instruments with a 6 to 10 year time horizon.
The third is for
long-term
needs and is invested with the expectation that the funds will not be needed for at least 10 years.
Below is a bird's eye view of the three investment-type buckets.
[These illustrations are hypothetical and are not indicative of any specific investment. Your results will vary.]
We at DeVol Financial are very fond of this strategy. The ongoing administration tasks can get involved, and we're happy to report that we have a found a
company to handle the complexity. Take a look at this
brochure from SEI
, especially
pages 2 and 3
.
Keep this in Mind
A potential downside to this Bucket strategy relates to the performance of the overall portfolio. Take the same $500,000 portfolio from which you are withdrawing
$25,000/year. Your short-term bucket, designed to accommodate withdrawals, would need to be $25,000 times 5, or $125,000. $125,000 of a $500,000
portfolio is 25%. Holding 25% cash in the portfolio, at a time of very low interest rates, may be a significant drag on performance.
Of course, if you had
$1,000,000 from which you are withdrawing $25,000/year, the required $125,000 constitutes only 12.5% of the portfolio -- a much better situation.
|
Total Portfolio
|
Distribution
|
# Years |
Cash Bucket
|
% of Portfolio
|
|
500,000
|
25,000 |
5 |
125,000
|
25.0 |
1,000,000
|
25,000 |
5 |
125,000 |
12.5 |
Selected Retirement Planning Articles
|