April 30, 2026 | BWE Arizona | Putting clients first. Trusted to be part of their future. | | | Agency | Life Company | | 5.20%
0.80% + 10yr UST
Low leverage multifamily refinance | 5.60%
1.20% + 10yr UST
Low leverage multifamily refinance | | | |
Key takeaways
- Geopolitics driving macro tone: U.S.-Iran tensions remain unresolved, with stalled diplomacy keeping upward pressure on energy prices and acting as a key swing factor for rates.
- The Federal Open Market Committee (FOMC) left the federal funds rate unchanged at 3.50% to 3.75% today. The FOMC stated that available indicators suggest economic activity has been expanding at a solid pace while job gains have remained low. The Federal Reserve will continue purchases of shorter-term Treasury securities to build an ample supply of reserves.
- Rates are range-bound, awaiting catalyst: The 10-year Treasury remains in a tight band (4.24%-4.35%) ahead of major data and Fed guidance.
Macro and geopolitical backdrop
- U.S.-Iran negotiations stalled with Iran proposing a conditional reopening of the Strait of Hormuz.
- Conflict now in week 9 with no clear resolution path.
- Oil prices rising again (Brent is elevated), reinforcing inflation sensitivity in rate markets.
- Market takeaway: Geopolitics is not escalating, but not resolving either → supports a “contained risk premium” environment.
Federal Reserve and policy outlook
- Key development
- DOJ dropped investigation into Jerome Powell
- Senator Thom Tillis now supports moving forward with Kevin Warsh nomination
- Critical uncertainty: Whether Powell remains on the Board through 2028 or steps down fully.
- Market pricing
- ~40% probability of rate cuts by year-end
- Strategic implication: The market is transitioning from rate path focus to leadership regime focus, which could influence medium-term policy tone.
Rates and economic data watch
- 10-year Treasury: Stable in tight range (4.24%-4.35%)
- Volatility: Declining, nearing pre-conflict levels
- Forecasts
- Bloomberg consensus: Approx. 4.18% by Q4 2026 (slightly higher vs prior month)
Strategic market read (what matters for you)
- Rates
- Range-bound near term
- Direction dependent on Fed tone + inflation prints
- Execution window
- Strong for Agency product due to
- Lower supply
- Relative value vs other credit
- Risk factors to watch
- Oil spike → inflation re-acceleration
- Fed transition messaging → policy uncertainty
- Treasury auctions → demand test
| | |
Firm demand, low Agency CMBS supply: New issue Fannie Mae DUS/MBS rate lock volumes have slowed to a tepid pace, with rate lock volume last week less than half of the prior week.
Year to date, new issuance of Fannie Mae DUS/MBS is tracking at approx. $13.6 billion, slowing behind last year’s $15.5 billion pace through the same period. Agency CMBS markets have seen continued interest from investors during the Iranian conflict, and new issue supply is being absorbed well. Despite some negative macroeconomic sentiment, Agency CMBS is receiving a degree of “safe haven” sentiment compared to other credit markets.
While market participants have struggled to define a firm commitment on interest rates, the lighter supply volumes have served to support spreads across generic Agency CMBS products. For instance, spreads in generic standard-structured Fannie Mae DUS/MBS were one to two bps tighter from the previous week, and Freddie Mac saw tighter-than-expected execution on their $844 million 5-year K-560 transaction when it priced last week.
End investor interest continues to fixate on block-sized, standard structured Fannie Mae DUS/MBS with full-term interest-only payments and interest rate buydowns. Broadly speaking, Agency CMBS spreads have firmed as the Iranian conflict has extended, reflecting an investor base that has grown accustomed to the ceasefire’s status quo, even if held indefinitely. Said differently, fears of an escalation in the conflict have been reduced from the onset of the month. Corporate credit spreads in the CDX Investment-Grade 5-year Index and Bloomberg Single-A Industrials 10-year Index were 1-2 bps wider last week and remain in context of their one-year averages.
Quick hits
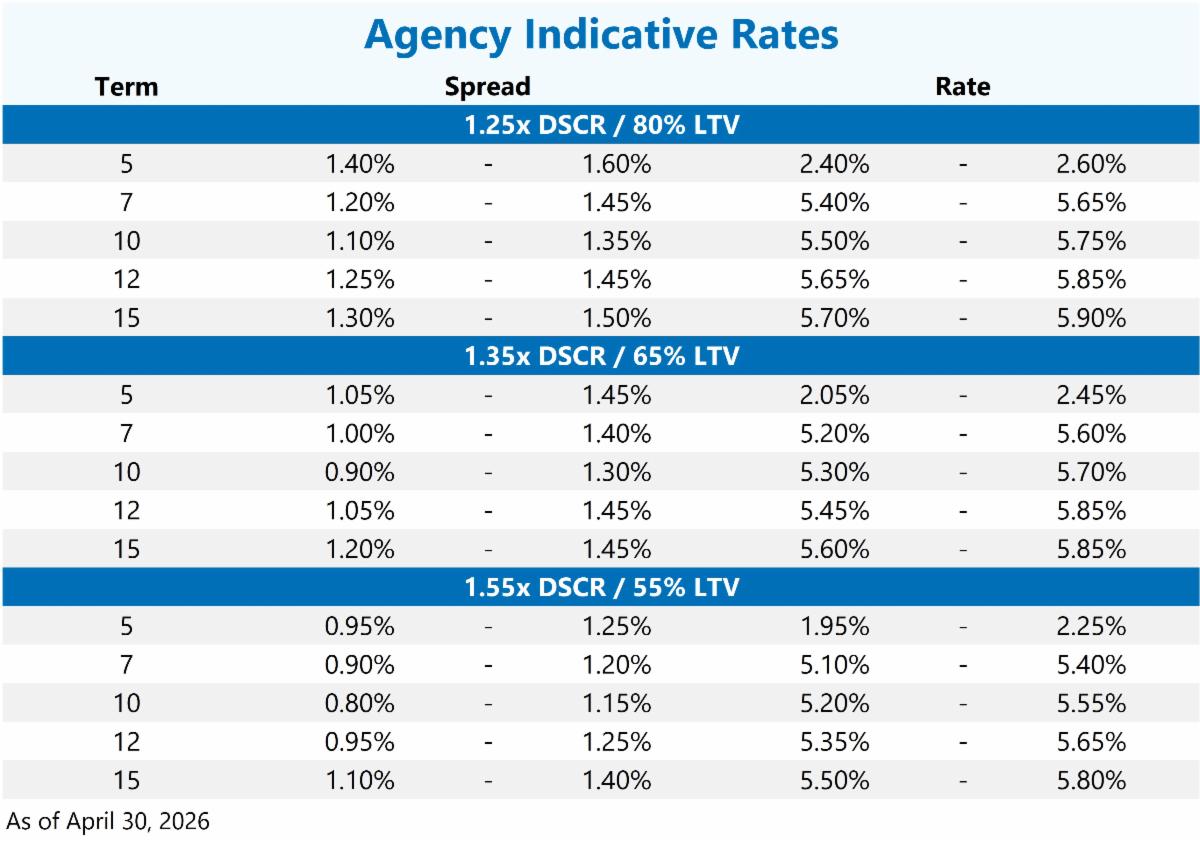
- Pricing: Lower leveraged loans are getting into low 100s or even sub 100 bps over the index.
- Agency volumes through March
- Fannie Mae: After posting $10.4 billion for January, Fannie reported $3B for February, and $3.7 billion for March bringing them to $17.1 billion YTD. This is 44% higher than 2025 (skewed by Jan).
- Freddie Mac: After posting $3.2 for January and $3.3 billion for February, Freddie posted $6.3 billion for March bringing them to $12.8 billion YTD. This is 25% higher than 2025 YoY.
Fannie Mae
- Recent success on 5-year product: Fannie continues to focus more on these scenarios.
- Rolling out a fifth credit region in Midwest
- Affordability is no longer the sole driver behind spread reductions
- Like Freddie, they really want to know where they have to be to win the business.
- At Tier 2, loans with lower LTVs (65% or 70% vs 75%) or higher DCSR (1.30x instead of 1.25x) receive better pricing.
- At Tier 3 and Tier 4, reductions to the bottom of the published grids require more understanding of the competition.
Freddie Mac
- The combination of 35-year amortization on a 5-year loan tends to be problematic with Freddie’s refinance test in most instances, but they are more competitive on 7- and 10-year structures with respect to proceeds.
Loan highlights
Freddie Mac Refinance Cash Out - West Coast
- $18.5 million
- 70% LTV / 1.30x DSCR
- 119 bps spread over 10-yr no buydown (94 bps w/ buydown)
- 10-year fixed / 10 yrs IO
Fannie Mae Refinance - California
- 20 million
- 55% LTV / 1.55x DSCR
- 112 bps spread over 10-yr no buydown
- 10-yr fixed / 10 yrs IO
| | |
After a sluggish couple of months, Life Company origination activity seems to have rebounded with several lenders indicating a strong inflow of loan requests in April. With the Federal Reserve electing to hold interest rates and UST spreads jumping 8-10 bps, this could impact the recent momentum with Life Company lenders.
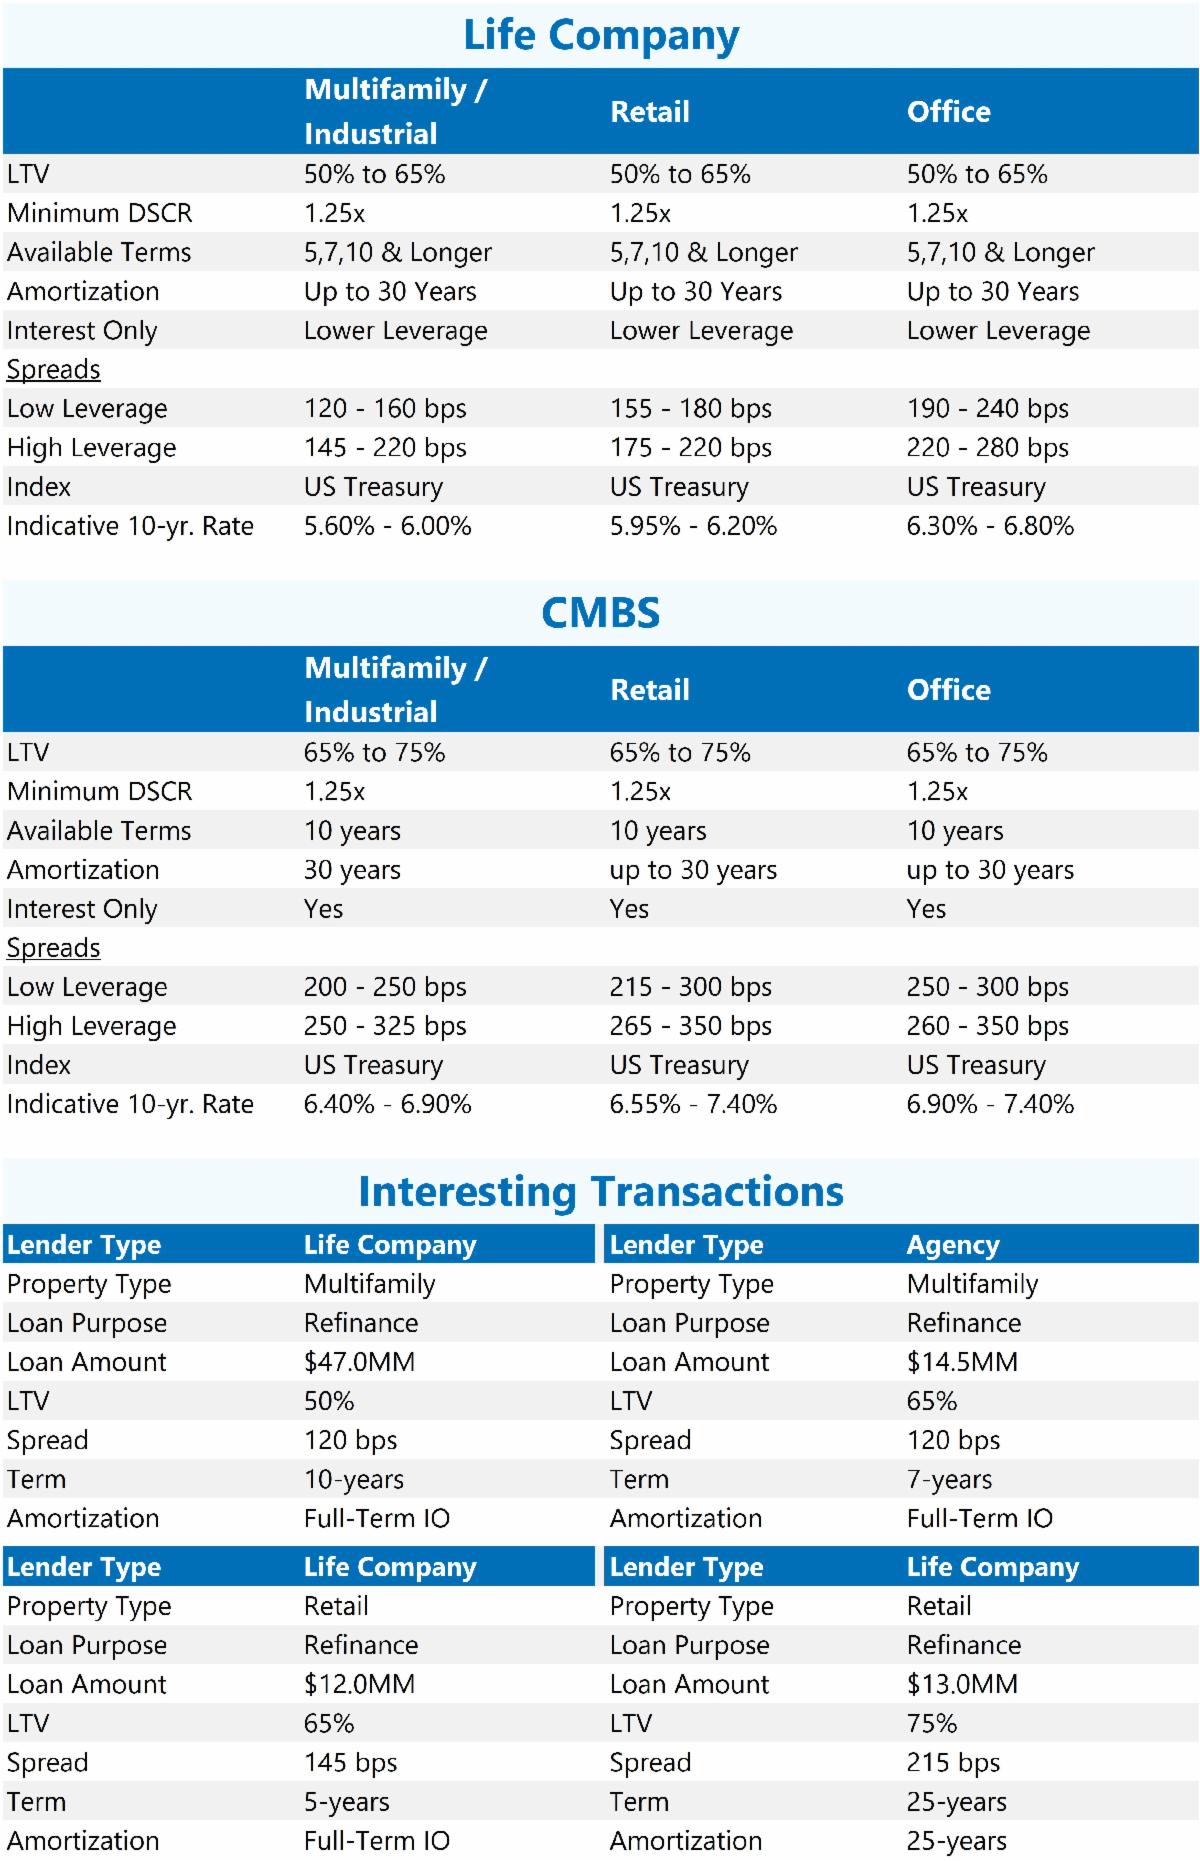
Lenders have been highly active by quoting competitive spreads to win business with strong borrowers, generally ranging between 130-180 bps for quality properties in good locations. Some recent examples include a grocery-anchored property at 55% LTV being quoted at a spread of 170 bps and an industrial building on a 15/15 structure at 60% LTV quoted at 180 bps.
With substantial capital allocations to place, competition for large and highly sought-after loan opportunities can be fierce. Lenders are improving loan metrics and tightening spreads to win business. Outlier pricing for desirable properties in primary markets with strong sponsors are shown to be 20-30 bps lower.
As an example, a multifamily loan at 50% LTV was quoted with a spread of 120 bps. Lenders noted a preference for 10-year and longer loan terms, however, there is abundant capital for shorter-term fixed and floating rate requests.
| | |
U.S. CMBS issuance has accelerated in recent weeks and now the total is approx. $38.2 billion YTD, broadly in line with issuance levels YoY. After experiencing some recent widening, conduit spreads have stabilized, with 10‑year AAA spreads currently around 80 bps over Treasuries – consistent with the trailing 12‑month average of approx. 78 bps.
Borrower spreads remained range‑bound over the past several months. Ten‑year CMBS loans are generally pricing at 200-225 bps over Treasuries, while five‑year CMBS loans are pricing in the low‑to‑mid 200 basis point range. For high‑quality, low‑leverage transactions, pricing can be as low as 140 bps over Treasuries.
Multifamily assets continue to attract strong lender demand with CMBS lenders maintaining a willingness to offer full‑term, interest‑only structures. These loans allow borrowers to maximize proceeds, with underwriting typically supporting a 1.25x DSCR on an interest‑only basis. In addition, several CMBS lenders have secured dedicated B‑buyers for multifamily‑only securitizations, enabling the introduction of “stretch senior” executions. These loans are generally priced at 180-225 bps over Treasuries and can be sized down to a 1.20x DSCR on an interest‑only basis.
Other property types including office have also benefited from the availability of full‑term, interest‑only financing. However, these transactions are subject to more conservative leverage constraints, higher debt yield requirements, and tighter overall underwriting standards compared to multifamily loans.
| | |
About BWE
Bellwether Enterprise (BWE) is one of the nation's largest privately-owned real estate financing companies. Its trusted advisors combine innovation, extensive experience and strong lender relationships to optimize a loan's capital stack for commercial and multifamily investors, developers and property owners. For more information, visit BWE.com.
| | |
Opinions, estimates, forecasts and all other information contained in this document are those of Bellwether Enterprise Real Estate Capital, LLC (“Bellwether”) and should not be construed as indicating Bellwether’s business prospects or expected results. Although Bellwether attempts to provide reliable, useful information, it does not guarantee that the information or other content in this document is accurate, current, or suitable for any particular purpose. All content is provided on an “as is” basis, with no warranties of any kind whatsoever and is subject to change at any time without notice. Information in this document may not be used without permission from Bellwether. This document is not intended to be an offer to buy or sell or a solicitation of an offer to buy or sell securities, if any, referred to herein.
Bellwether Enterprise Real Estate Capital, LLC (BWE) conducts business through Bellwether Enterprise Mortgage Investments, LLC – Mortgage Banker license #BK-1007784 – the Department of Financial Institutions State of AZ (Fannie Mae transactions), as well as Bellwether Enterprise Real Estate Capital, LLC – Mortgage Banker License #BK-1007825 – the Department of Financial Institutions State of AZ (all other transactions).
| | | | |