October 15, 2026 | BWE Arizona | Putting clients first. Trusted to be part of their future. | | | Agency
5.90%
0.80% + 10yr UST
Low leverage multifamily refinance | Life Company
6.30%
1.20% + 10yr UST
Low leverage multifamily refinance | | | |
Key takeaways
- September inflation data released this week was significantly hotter than expected across both CPI and PPI reports, with broad-based core price pressures and a substantial energy-driven surge reshaping monetary policy expectations.
- Treasury yields have experienced extreme volatility, with the 10-year benchmark rising to near 5.32% after CPI before reversing sharply lower amidst an equity-driven selloff, currently trading near 5.04% intraday.
- These developments reinforce the "inflation first" narrative and complicate the Fed's near-term flexibility heading into the October 27-28 FOMC Meeting.
September CPI report
The report delivered a substantial upside surprise with inflation accelerating across both headline and core measures.
- Headline CPI rose 0.6% MoM (0.6% expected; 0.4% prior), lifting the annual rate to 3.7% (3.6% expected; 3.4% prior).
- More than half of the monthly increase came from gasoline, which jumped 9.1%, reflecting the energy-driven component of inflation.
- Core CPI (ex-food and energy) rose 0.3% MoM (0.2% expected; 0.3% prior) and 2.6% YoY (2.5% expected; 2.4% prior)—the fastest annual rate since June.
- Core gains were broad-based including recreation, used vehicles, education, airfares, and hospital services.
- Core CPI has risen 0.3% in back-to-back months, putting the three-month annualized pace at approximately 3.4%.
Real wage erosion
Real wage pressures continue to mount amid accelerating inflation.
- Real average hourly earnings fell 0.7% YoY (-0.3% prior), marking a significant deterioration in real compensation.
- Real average weekly earnings fell 0.1% YoY.
- Real average hourly earnings have now contracted for six straight months—the longest stretch since the 2021-23 cost-of-living surge.
September PPI report
The September PPI release delivered a major upside surprise with producer-side inflation accelerating sharply.
- Headline final demand PPI rose 1.3% MoM (0.6% expected; 0.5% prior, revised higher)—the fastest monthly increase since March 2022.
- The annual headline rate reached 6.3% (5.4% expected; 5.6% prior, revised higher)—the highest annual rate since December 2022.
- Core PPI (ex-food and energy) rose 0.7% MoM (0.3% expected) and 5.0% YoY (4.4% expected).
- Energy prices jumped 10.8%, with gasoline alone up 20.3%, leading to the largest monthly advance in Final Demand Goods since data was first calculated in December 2009.
- Final Demand Services prices rose 0.8%.
- Revisions across both headline and core PPI releases raised previously reported figures from the prior month.
Fed monetary policy expectations
The inflation surprises have reshaped near-term rate hike expectations.
- The Fed delivered a unanimous 25 bps hike in September, and September FOMC minutes showed most policymakers favor another hike by year-end.
- Futures markets now price a near-certain likelihood of at least one more Fed Funds rate hike this year.
- For the October decision, futures markets currently indicate approximately a 30% chance of a quarter-point rate hike later this month—marginally down from the previous day.
- Tonight, Fed Chair Kevin Warsh will speak at a fireside chat with IMF Managing Director Kristalina Georgieva in Bangkok—the last Fed speaker ahead of the external communications blackout period beginning this weekend.
September retail sales
Headline retail sales were strong, but underlying weakness suggests price-driven gains rather than volume strength.
- Headline Retail Sales rose 0.8% MoM (0.3% expected; 1.3% prior, revised higher).
- Retail Sales ex-autos rose 0.9% (0.5% expected).
- Excluding autos and gas, Retail Sales rose only 0.2% (1.2% prior).
- The Retail Sales Control Group (which feeds directly into GDP calculations) rose just 0.1% (0.3% expected; 1.4% prior).
- The headline strength appears largely price-driven, particularly after accounting for this week's inflation reports, and the sharp control-group slowdown suggests underlying volumes are cooling.
Labor market conditions
Weekly jobless claims data showed little change from the previous week.
- Initial Jobless Claims were 199k (200k expected).
- Continuing Claims were 1.710m (1.709m expected).
- Four-week averages on both datasets are little changed and well within the series' normal range of volatility.
- Reports demonstrate that labor markets continue to show little layoff pressures, though hiring remains softer and slower than recent historical context.
Treasury yield dynamics
Treasury markets experienced aggressive volatility following the inflation data releases.
- After CPI, the 10-year Treasury yield rose as high as ~5.32% before reversing sharply.
- The 10-year closed yesterday near 5.19% and continued its slide today to just below 5.04% at its lowest point intraday.
- A tech-led equity selloff overnight continued to drive capital market inflows towards Treasuries as a "safe-haven" trade.
- This volatility is substantial given that 10-year and 30-year yields recently hit 24-year highs of approximately 5.36% and 5.73% last week.
- Ahead of this morning's data, the 10-year Treasury yield was near 5.08% while the 2-year neared 4.73%, implying a 2s10s spread of approximately 35 basis points that has roughly held through mid-morning.
Yield movements
Market observers have noted that the catalyst for recent yield declines is not entirely clear.
- Simon White, Macro Strategist at Bloomberg, observed: "Markets are often counter-intuitive. Treasuries duly sold off in the wake of yesterday's higher-than-expected CPI data, but yields did not even breach their recent highs before they abruptly turned around. At some point, the fundamentals matter, and given the rise in nominal yields in recent months has primarily been a growth story, any decline should have some tangible basis that growth is set to imminently weaken, not simply as stocks are lower."
- The current intraday yield decline appears more driven by tactical equity-related flows than by fundamental changes in monetary policy expectations.
Energy as the swing factor
Energy prices remain the critical variable driving inflation and monetary policy expectations.
- Brent trades near $105/barrel with limited progress on Strait of Hormuz normalization.
- Tentative de-escalation signals have at times offered glimmers of hope, though little has cemented to provide a clear path to lower energy prices in the near-term.
- From the Fed's perspective, a sustained decline in oil would remove a key source of inflation pressure, keeping the Iran/Middle East situation as a critical variable in shaping monetary policy expectations.
| | |
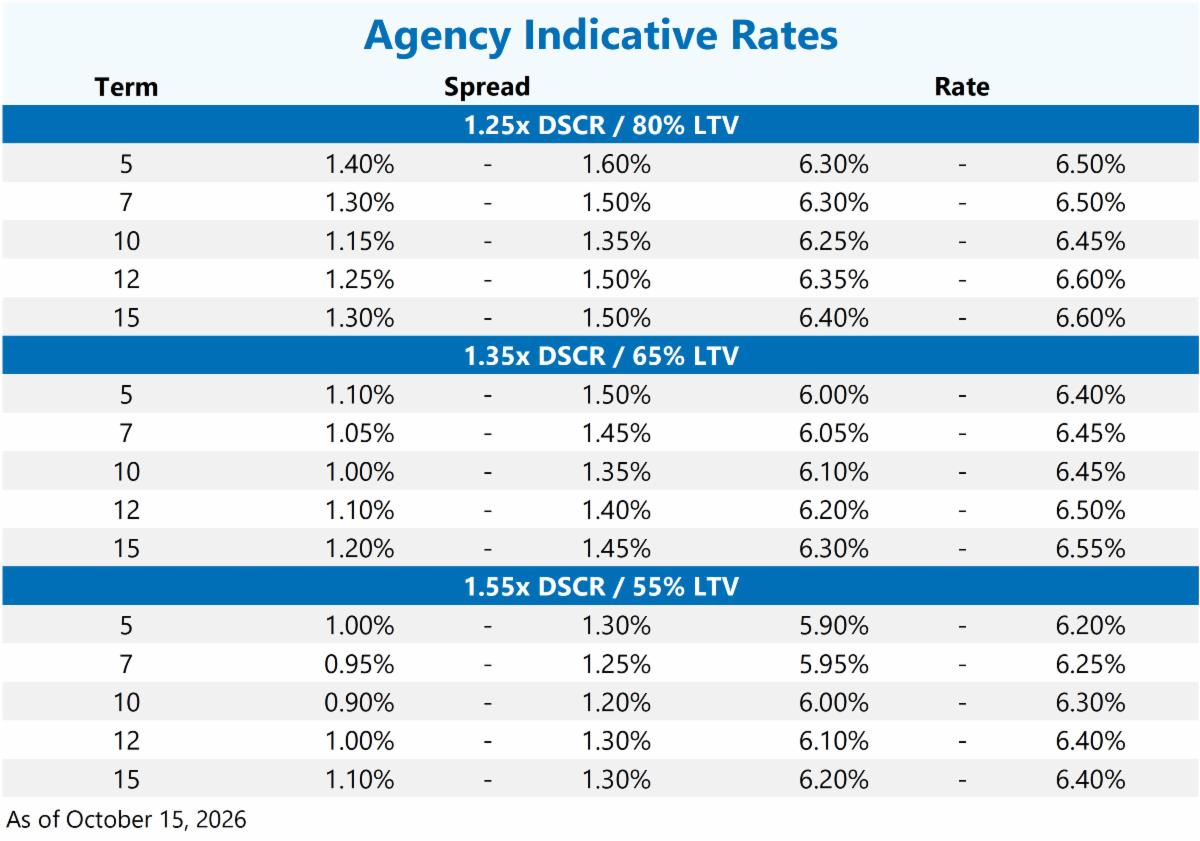
Agency CMBS credit spreads continued to tighten last week with Fannie Mae DUS/MBS spreads improving by 1-3 bps despite broader credit market widening. New issuance activity slowed, however, as higher Treasury yields weighed on borrower demand with Fannie Mae rate lock volume totaling $683 million. Freddie Mac’s PC pipeline remains active with approximately $615 million expected to price this week with an additional $1.47 billion scheduled for the balance of the month, largely consisting of 10-year fixed-rate transactions.
On the lending front, Freddie Mac remains focused on supporting high-quality transactions and is increasingly willing to provide flexibility to help loans reach the finish line. While 3% buydowns on fixed-rate loans remain an exception, they are becoming more common when necessary to preserve loan execution.
For floating-rate opportunities, Freddie has shown openness to 2% buydowns for select sponsors and continues to explore ways to increase full-term, interest-only proceeds higher within the capital stack. In addition, if a fixed-rate loan under application transitions to floating-rate during the spread-hold period, Freddie will reference the Treasury rate at the time of application when evaluating the fixed-rate equivalent. For lease-up transactions, Freddie is considering waiving the interest-only debt coverage ratio test on 10-year terms and has implemented an improved refinance test that is allowing more transactions to qualify.
Overall, market sentiment remains cautiously optimistic. While upcoming loan maturities continue to present challenges in the current rate environment, Agency lenders are demonstrating increased flexibility and creativity to keep loans moving. The consensus view is that the recovery may take time, but market fundamentals are expected to gradually improve as pricing and capital markets adjust to the higher-rate landscape.
Loan highlights
Fannie Mae near stabilization
- $63 million
- 65% LTV / 1.25x DSCR
- 133 bps spread
- 10-yr term / FTIO
Freddie Mac refinance
- $15.5 million
- 50% LTV / 1.75x DSCR
- 87 bps spread
- 10-yr term / 3 yrs IO
| | |
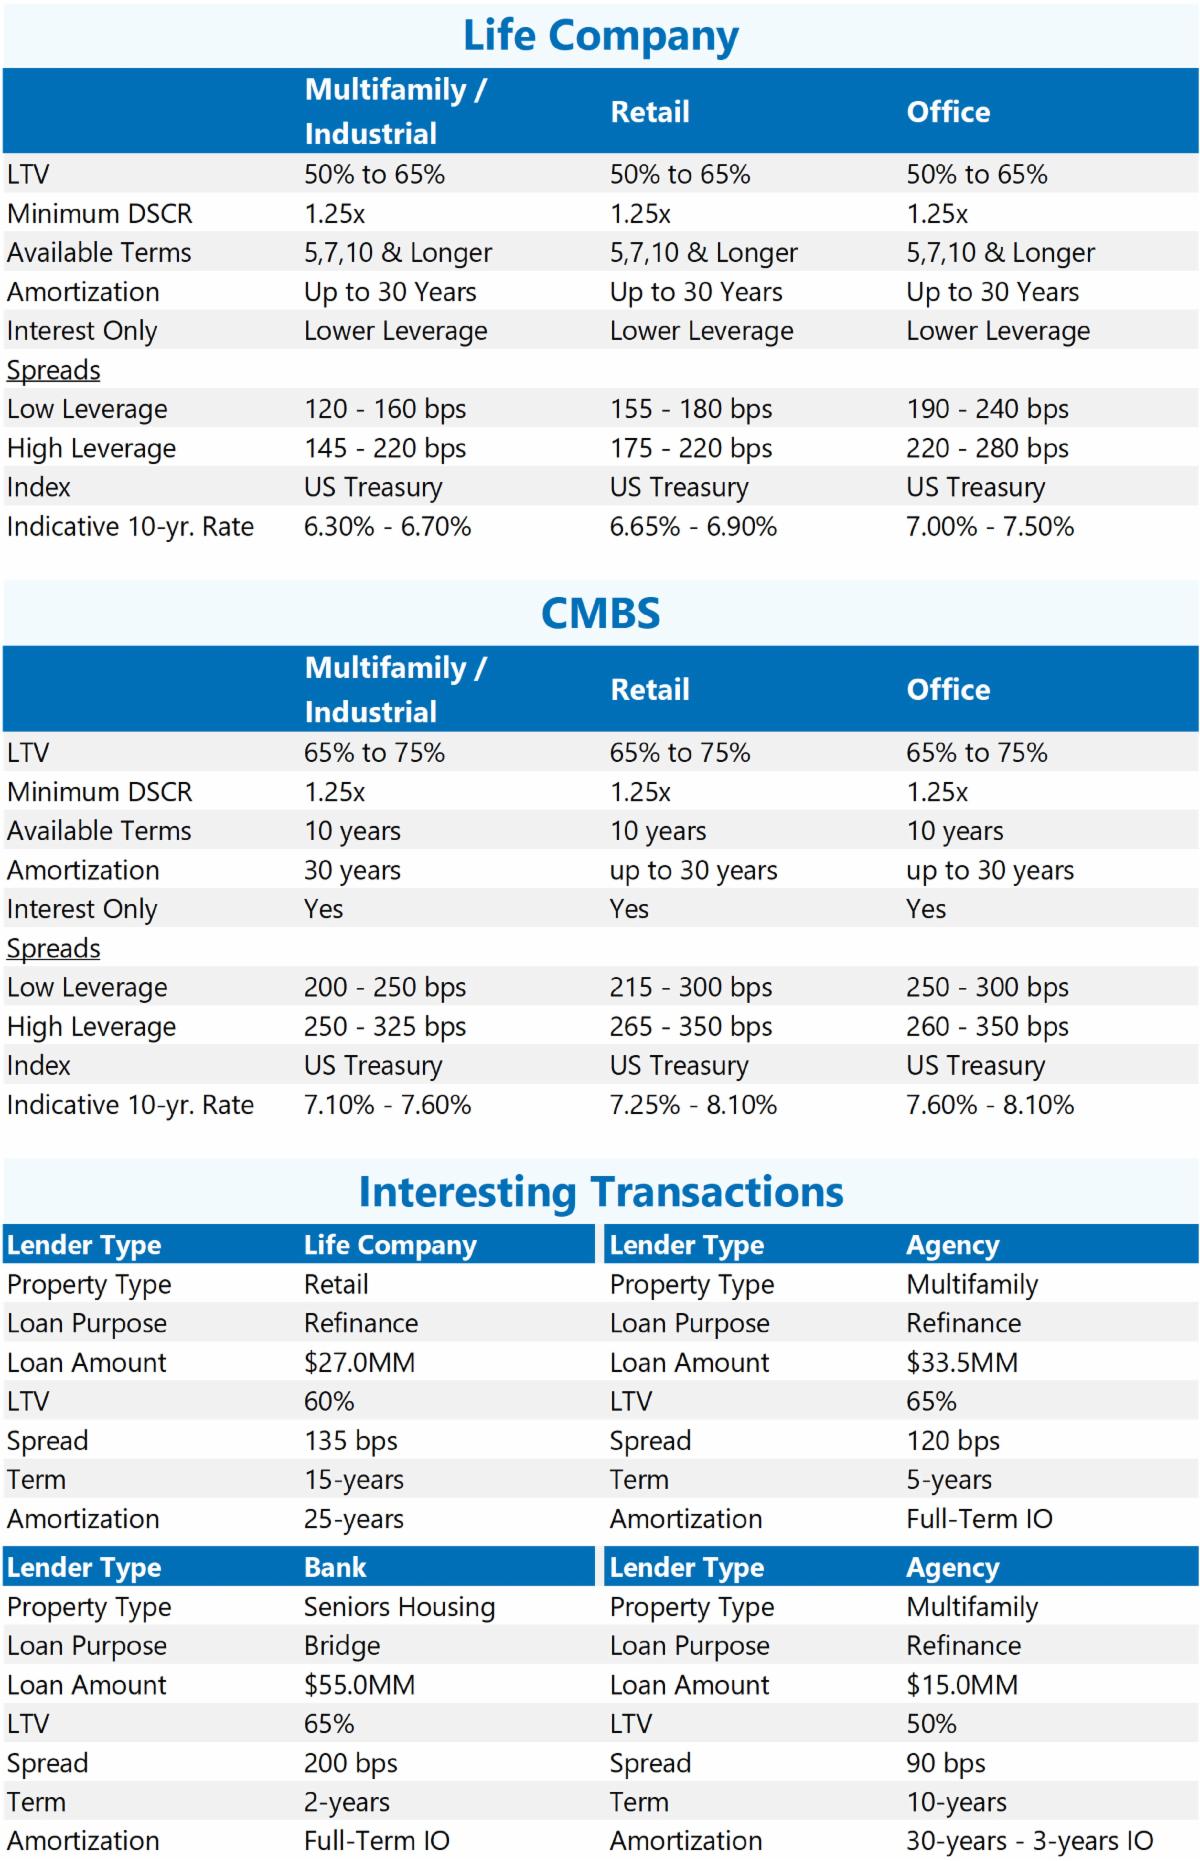
Over the past two weeks, BWE has been in contact with a broad range of Life Company lenders to get a clearer view of the short-term and flexible-prepayment programs now on offer. Borrowers remain reluctant to lock in long-term fixed rate debt at current index levels, with most inquiries, particularly for upcoming maturities, for two- to five-year terms. Most Life Company lenders can meet this demand in one of two ways: a core floating rate loan, or a fixed-rate structure with flexible prepayment.
Core floating rate programs are priced over SOFR, with spread indications generally between 160-225 bps. These loans usually carry a minimum interest period but can be repaid at par for the rest of the term, which makes them a natural fit for borrowers who want to refinance into long-term fixed rate debt once rates settle. Leverage and asset quality standards are largely the same as the lenders’ fixed rate programs, so these are core loans on stabilized, good-quality assets rather than bridge financing.
Fixed rate loans with flexible prepayment are priced over the matching UST index. Lenders replace traditional yield maintenance with step-down prepayment schedules or open periods, and price that flexibility as an adder over standard fixed rate spreads. The more flexibility the borrower wants, the larger the adder. Generally, fixed rate spreads range between 130-180 bps for well-located, good-quality assets before prepayment adders. Lenders have quoted spreads as low as 110 bps to win high-quality, low-leveraged properties.
With the fourth quarter underway, most lenders still have short- and long-term allocations to place and are adjusting their programs to match borrower demand for shorter, more flexible capital.
| | |
U.S. CMBS issuance has remained steady in recent weeks and now totals approximately $107.1 billion year‑to‑date, ahead of the $98.1 billion level at this point last year. Conduit spreads have widened modestly in recent weeks with 10‑year AAA spreads currently at 76 bps over Treasuries—in line with the trailing 12‑month average of approximately 75 bps. Borrower spreads have remained range‑bound over the past several months. Ten‑year CMBS loans are generally pricing at 200-225 bps over Treasuries, while five‑year CMBS loans are pricing in the low‑to‑mid 200 bps range. For high‑quality, low‑leverage transactions, pricing can be as low as 150 bps over Treasuries.
Multifamily assets continue to attract strong lender demand with CMBS lenders maintaining a willingness to offer full‑term, interest‑only structures. These loans allow borrowers to maximize proceeds with underwriting typically supporting a 1.25x DSCR on an interest‑only basis. In addition, several CMBS lenders have secured dedicated B‑buyers for multifamily‑only securitizations, enabling the introduction of “stretch senior” executions. These loans are generally priced at 180-225 basis points over Treasuries and can be sized down to a 1.20x DSCR on an interest‑only basis.
Other property types including office have also benefited from the availability of full‑term, interest‑only financing. However, these transactions are subject to more conservative leverage constraints, higher debt yield requirements, and tighter overall underwriting standards compared to multifamily loans.
| | |
About BWE
Bellwether Enterprise (BWE) is one of the nation's largest privately-owned real estate financing companies. Its trusted advisors combine innovation, extensive experience and strong lender relationships to optimize a loan's capital stack for commercial and multifamily investors, developers and property owners. For more information, visit BWE.com.
| | |
Opinions, estimates, forecasts and all other information contained in this document are those of BWE and should not be construed as indicating BWE’s business prospects or expected results. Although BWE attempts to provide reliable, useful information, it does not guarantee that the information or other content in this document is accurate, current, or suitable for any particular purpose. All content is provided on an “as is” basis, with no warranties of any kind whatsoever and is subject to change at any time without notice. Information in this document may not be used without permission from BWE. This document is not intended to be an offer to buy or sell or a solicitation of an offer to buy or sell securities, if any, referred to herein.
Bellwether Enterprise Real Estate Capital, LLC (BWE) conducts business through Bellwether Enterprise Mortgage Investments, LLC – Mortgage Banker license #BK-1007784 – the Department of Financial Institutions State of AZ (Fannie Mae transactions), as well as Bellwether Enterprise Real Estate Capital, LLC – Mortgage Banker License #BK-1007825 – the Department of Financial Institutions State of AZ (all other transactions).
| | | | |