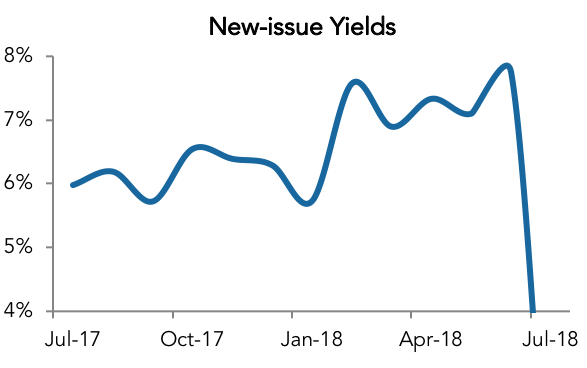
“Rising global real interest rates are the No. 1 predictor of financial problems in vulnerable economies.”
– Kenneth Rogoff, professor, Harvard University.
|
|
Half-Time Report (First of a Series)
|
|
“2018 will be a good year for loans.”
Back in January, that was the way we characterized what to expect in leveraged loan land for the year ahead. At the half-way mark, our forecast seems to be holding true.
According to Thomson Reuters LPC, volume for the entire loan syndication market in the US hit $1.5 trillion for the first six months of 2018. That was the best half-time showing since last year, when activity was $1.3 trillion. This number comprised both investment and non-investment grade lending.
On the leveraged loan front, this year so far has been almost as active as 2017. Volume of $737 billion was the second highest ever only to last year’s $770 billion. Second quarter’s story, unlike a year ago, was more M&A-related. The share of refinancings has slowed as interest rates have risen.
A frothy M&A market combined with strong economic growth are two dynamic programs running in the background of loan formation. Dealogic has global deal activity running at $2.35 trillion through June 30; almost 60% higher than the same period in 2017. At that rate, 2018 will break the all-time 2007 record of $4.3 trillion.
Economists estimate that 2Q GDP will measure 4-5% – far above the first quarter’s 2.0% metric. Corporate tax cuts and general business optimism seem counterweights to concerns about trade and tariffs. At least for now.
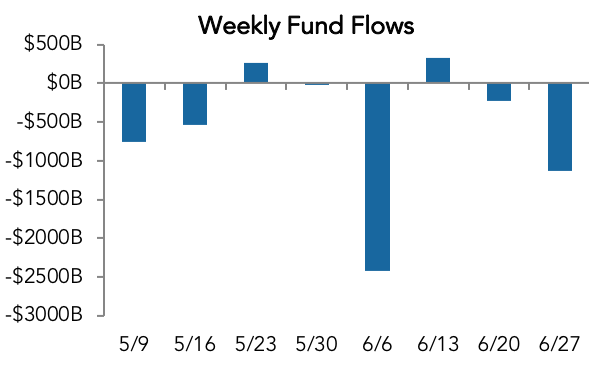
As always, supply/demand is worth noting. CLOs, ever the lion’s share of appetite for liquid loans, are being formed at a record post-crisis pace. S&P LCD reports almost $66 billion in new vehicles to date. Combine that with $8.4 billion of net cash in-flows to retail loan funds, and there’s plenty of institutional money at work.
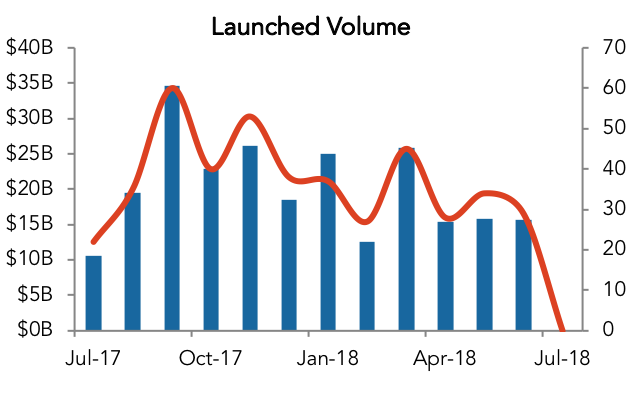
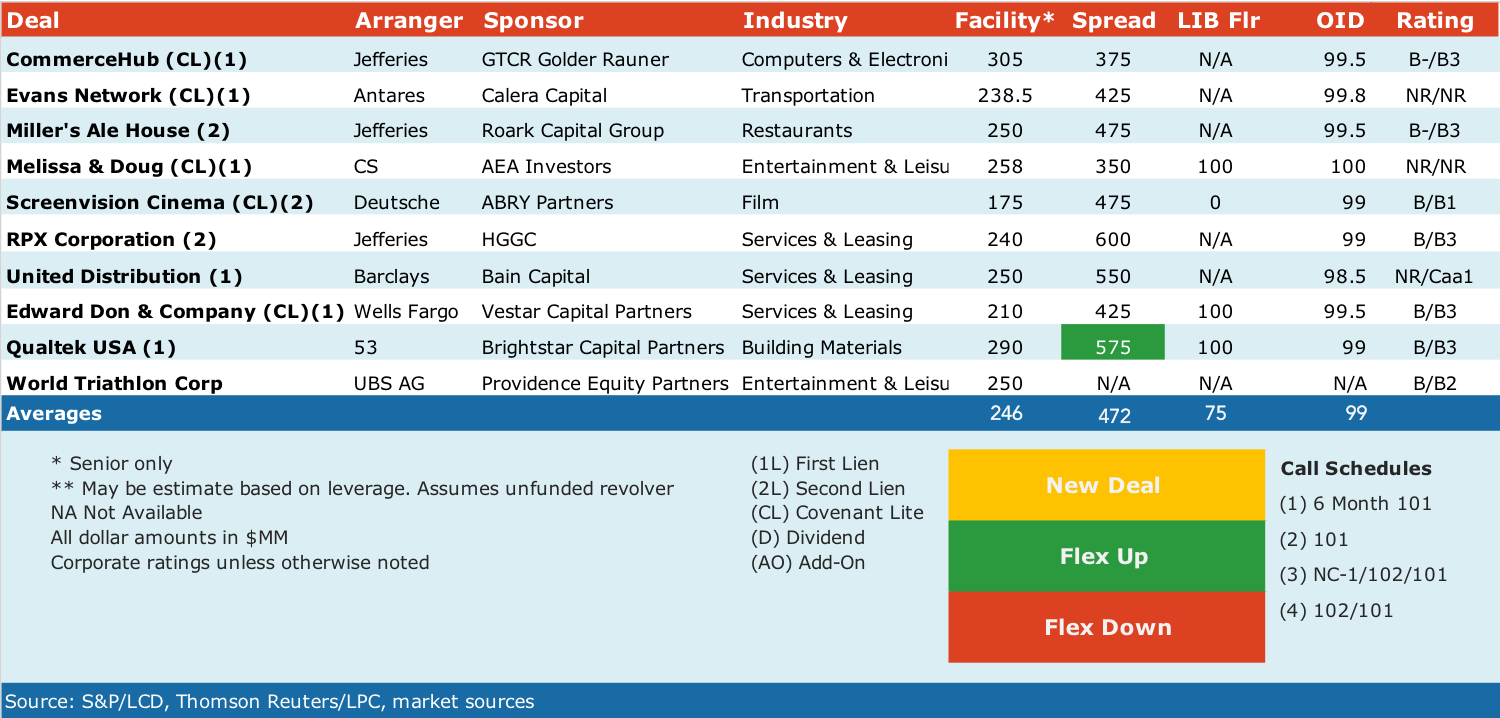
But the supply side is more than keeping up. The large cap pipeline swelled to $30 billion by June’s end. With that flood, as we highlighted last week, has come investor pushback. A raft of financings – QualTek, Yak Mat, Next Level Apparel, MeridianLink, Senneca, and DMT Solutions, to name a few – were forced to flex spreads wider to make it across the finish line.
Inevitably, loan prices in the secondary market traded down, as the buyside worked through supply in the primary calendar. Also inevitably, arrangers launching new deals scurried to find clearing yields. In some cases spreads have moved anywhere from 25 to 50 bps outside the wide end of “talk,” to 75 and 100 bps or more.
This is happening across a wide spectrum or credits; not just broadly syndicated, but larger midcap loans as well. And it’s not just pricing that’s flexed. Delayed draw term loans have been shrunk or dropped, covenants have been added, soft-calls extended, free-and-clear baskets reduced, and grower baskets eliminated.
Not since the China/commodities tantrum of August 2015 have we seen such buyer-friendly moves. Next week we’ll look at how the middle market is faring.
|
|
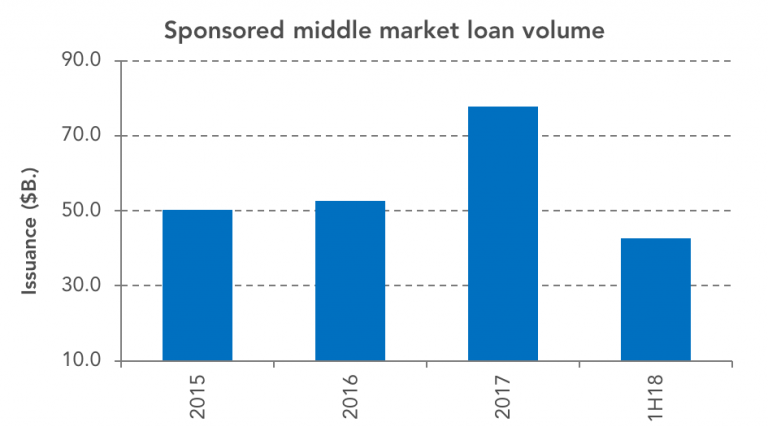
Sponsored loan activity in the middle market is running at a faster pace than last year; on track for best year since 2007.
Source: Thomson Reuters LPC
|
|
"The middle market occupies the sweet spot between resilience and runway."
|
|
This week we continue our conversation with Thomas A. Stewart, executive director for the National Center for the Middle Market. The Center is the leading source for knowledge, leadership and research on midsized companies, based at the Fisher College of Business at The Ohio State University. Mr. Stewart is an influential thought leader on global management issues and ideas: an internationally recognized editor and publisher, authority on intellectual capital and knowledge management, and a best-selling author. Second of two parts –
View part one
.
The Lead Left:
But as you say, little is known about these companies. What are some of the implications of that knowledge gap?
Thomas Stewart:
Think of that two-winged bird. First, there are lots of implications for public policy. How should city halls and business-development organizations best work on economic growth? It’s not about luring a new Honda plant; it should be about supporting the growth of the companies already in town. How do you think about what community colleges should be doing, to help theses fast-growing companies get the talent they need? How can we make sure that middle market voices are heard when tax and tariff policies are debated? Right now, small business is heard; big business is heard; mid-sized are at the table only rarely.
Second, think of research that helps executives do better. Most of what we know about management has been gleaned from research about big companies. You can’t just lop off two or three zeros for what applies to Proctor and Gamble and say it applies to the middle market. For example, take innovation. A lot of innovation best practices talk about creating a diversified portfolio of projects. But a typical middle market company has, on average, three innovation projects every year. For example, in supply chain management, there’s lots about managing large supply chains but—till we came along—there was nothing about how to be a perfect link.
TLL:
From the middle market data you’re seeing, where are we today in the business cycle?
TS:
The middle market, I like to say, occupies the sweet spot between resilience and runway. We are in the second longest expansion in history. So far, it’s been a blessedly placid environment. Interest rates are low, energy costs are low, labor costs are low, and raw material costs are low. In our quarterly Middle market Indicator, we’re seeing continued strong performance and record-high confidence.
But will this benign business climate continue? There’s concern about trade.
|
|
All the costs I mentioned are up. Management is becoming more aggressive about price hikes; they will raise prices. The biggest problem, given near-full employment, is talent. The middle market feels it the most because resumes pour into Google. They don’t pour into a small widgets business based in Cincinnati, Ohio. For now, things look great. But as Jack Welch once told me, “I know a train will come through this building. I just don’t know when and where it’s coming from.”
TLL:
What’s your sense regarding the impact on the middle market from new tariffs?
TS:
Middle market companies are indeed domestically focused, but the most successful and fastest growing middle market companies are those that engage with global markets. Canada and Mexico represent their two biggest trading partners. China comes third. Administration policies will affect them. This will certainly impact the price of auto parts, for example, as steel costs increase. Your readers should check out an interesting podcast we have on our website on the impact of tariffs on agriculture.
TLL:
What has been your biggest surprise so far?
TS:
How cool this is. Every day I encounter interesting new companies. For example, there’s the Mohawk Paper Co, based in upstate New York—they make the construction paper you played with as a kid.. Then there’s the Simmons Machine Tool Company that makes railroad wheel sets, helping to keep rails stay parallel. There’s Keg Works that makes “tools for drinking”. Things like kegs and taps and bar rails.
TLL:
Right up my line.
TS:
Just think about all the great beer companies out there! The ones worth drinking are all middle market companies. The ones that taste like water are all the big ones.
Across the river from my office is the second largest manufacturer of fire trucks. My inner six-year-old boy wants to tour that factory.
Do you like French fries? Grote Industries in Columbus, OH, started out as a pizza business. The owner wanted to find a better way to slice pepperoni rather than by hand. That led to a machine that slices French fries. So the next time you’re sitting in a bar, having a burger and fries, the fries were probably cut by a machine this company made you probably never knew existed. And if the beer’s any good, it, and the tap it came from, were made by a middle market company.
|
|
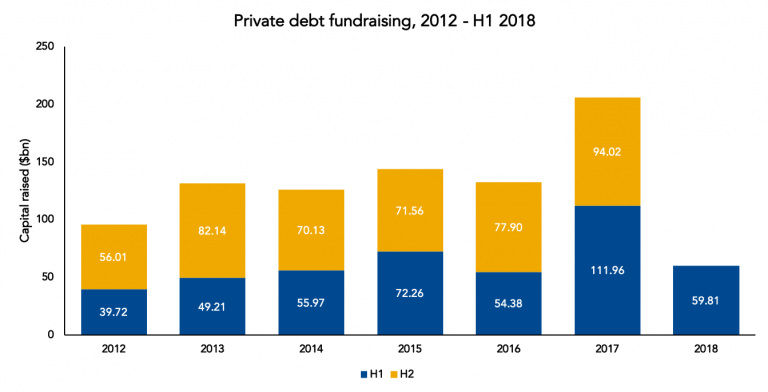
2017 was one heck of a fundraising year that saw stratospheric amounts of capital raised. 2018 will be a regular one.
PDI private credit fundraising numbers for the first six months of the year fell by nearly half compared to the same time last year, plummeting from $111.96 billion to $59.81 billion, a seemingly worrying sign.
Though the news won’t make credit managers and their fundraising staff beam with joy, this year’s figures are simply a snapback to a normal fundraising environment; what soars will eventually fall back to earth.
Even when leaving 2017 unaccounted for, the total for H1 2018 is still the second largest figure of the past eight years, behind H1 2015’s $72.26 billion.
What is particularly notable is that the largest funds closed in the first half of 2017 weren’t thrown off by one abnormally large vehicle. Four were north of $4 billion, which consisted of two direct lending funds, one mezzanine vehicle and a multi-strategy fund.
|
|
While the headline figure may be not as bad as it seems, there are some ominous signs for smaller credit managers if one digs deeper into the numbers. The two largest funds raised this year accounted for a much larger portion of the total than 2017’s figures, a potential indicator of a smaller number of managers raising even bigger funds.
In 2018, GSO Capital Solutions Fund III wrapped up with more than $7.1 billion in commitments and Broad Street Real Estate Credit Partners III raised $6.7 billion, making up more than one out of every five dollars raised.
Last year, the $4.88 billion Alcentra European Direct Lending Fund II and $4.6 billion Crescent Mezzanine Partners Fund VII were the two largest funds raised in H1 2017, which accounted for not even one out of every 10 dollars raised.
Market sources often tell PDI consolidation is occurring as the industry matures, something that was difficult to notice among last year’s fundraising numbers. Now, we just may be seeing it show up in our fundraising statistics.
|
|
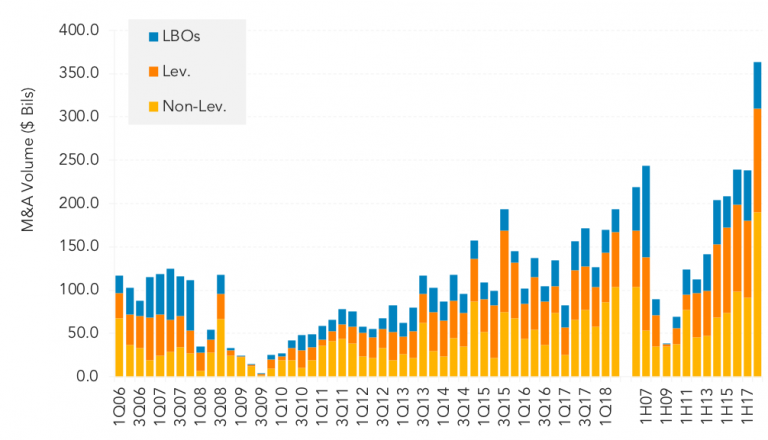
2Q18 US M&A loan volume sets quarterly record; 1H18 total also at historical high
|
|
The US market cleared almost US$194bn in acquisition loan financing in 2Q18 via a series of jumbo deals, to set a new quarterly record. In turn, 1H18 M&A volume at US$363.5bn marked a record high for any half year period. At over US$103bn, 2Q18 non-leveraged M&A deal flow topped previous quarterly totals to record a historic quarterly high and boosting 1H18 volumes to a record setting US$190bn or 52% of total M&A volume so far this year.
|
|
Leveraged corporates were also actively engaged in the M&A space, raising over US$120bn in 1H18, a high watermark for the first six months of any year. PE sponsors were well positioned to tap lenders amid a market perception of a softening regulatory stance on Leveraged Lending Guidance. In the process, they raised US$53.5bn in buyout financing in 1H18.
|
|
New tax law to impact PE data
|
|
Recent changes to the US corporate tax rate are a mixed bag for private equity. Reducing the top-line rate from 35% to 21% affects PE at both the fund and portfolio company levels, as both are structured as corporate entities in the first place. For portfolio companies in particular, that should lead to a climb in free cash flows in tandem with reduced tax payments. Higher cash flows will likely translate into higher enterprise values in the market, as well, as if the PE industry needed any help keeping valuations high. How big an impact this will have on aggregate valuation data is hard to say, but we may see an uptick or two in the coming quarters. On the other hand, PE investors will want to pay those valuations using less debt, since the new law also capped interest deductibility at 30% of EBITDA. Net tax payments will go up for portfolio companies shouldering more than 6-7x of debt obligations. As such, we could see more equity put to use in the coming years.
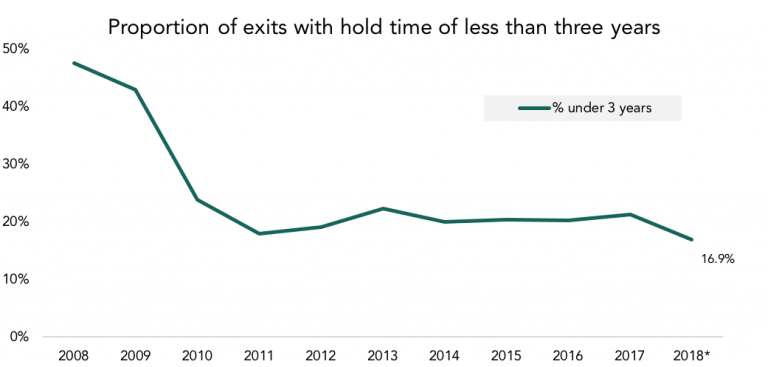
Carried interest legislation, which has been debated for years, changed relatively little. The long-term capital gains rate still applies, but the hold time required now stretches to three years minimum. A relatively small percentage of PE investments are held for less than that–fewer than
|
|
17% of exits would be affected so far this year, and the number of quick flips have gone down quite a bit over the years. That said, exit opportunities have been known to materialize faster than expected, especially from strategic buyers. GPs remain beholden to their fiduciary obligations to LPs, but we expect to see far fewer quick flips ahead as GPs look to protect their after-tax carry. Add-ons, however, could get a little more interesting. It isn’t uncommon to see add-ons made to a platform late in its holding period. GPs often used uncalled capital to finance those purchases, but under the auspices of the new tax law, financing add-ons through uncalled capital and exiting the platform within three years can create a split holding period for the whole investment. In other words, a single platform exit can generate both short-term and long-term carry depending on when all the pieces were put together—not an ideal situation. We think we’ll see PE investors start to directly finance those late add-ons to prevent any carry from being taxed at the short-term (ordinary income) rates. We may also see GPs become even more deliberate with add-ons earlier in the platform’s holding period. “Time is money” could be changed to “time is carry” in this case.
|
|
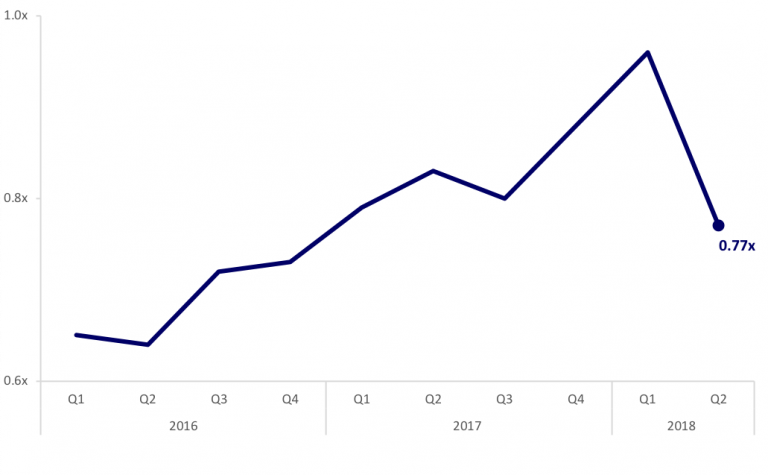
Average Free-and-Clear as a Multiple of Pro Forma Adjusted EBITDA
(M&A-Related)
|
|
|
|
30-DAY FREE MEMBERSHIP
Join the leading voice of the middle market. Try us free for 30 days.
|
|
|
Weekly fund flows source:
Lipper
|
|
Investors Flock to US Lower-Middle-Market Private Debt
|
|
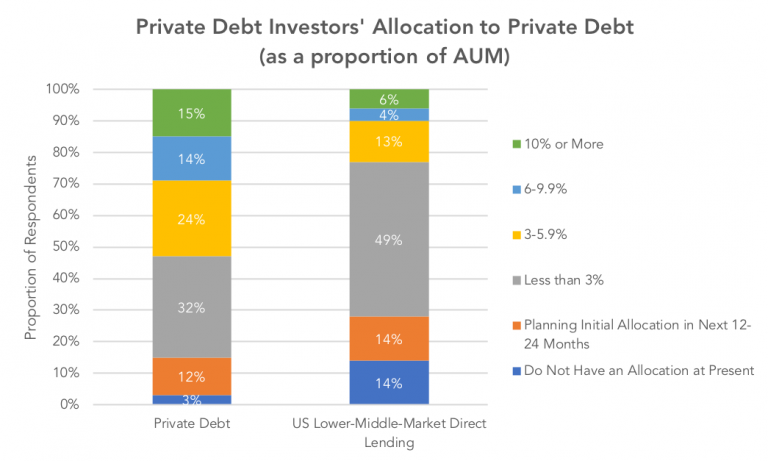
A Preqin/NXT Capital survey of 78 institutional investors investing in private debt found that 45% believe that the private debt market is at a peak and that assets are overvalued, leading investors to believe that the coming months will see a correction. In response, investors are looking increasingly to US-lower-middle-market direct lending and counter-cyclical strategies. The lower middle market is here defined as focusing on companies with less than $50mn in EBITDA, and making transactions with a typical size of $30-150mn.
The survey revealed that many investors believe that US lower-middle-market direct lending will be less affected by a cycle change and other macroeconomic trends than private debt as a whole. Beyond seeing US lower-middle-market direct lending as a potentially less volatile sector, the majority respondents cited relatively high returns (57%) and diversification (55%) as its key appeals. Return expectations for the sector are higher than for private debt as a whole: 59% expect
|
|
unlevered lower-middle-market direct lending funds in the US to return 8% or more, compared to 39% that expect the same for broader unlevered private debt funds.
As a result, appetite for lower-middle-market direct lending in the US has been growing, and a majority of investors plan to increase their allocations to the sector in 2018. In fact, 86% of investors have a dedicated allocation to US-lower-middle-market direct lending, and 56% are set to increase their exposure over the next 12 to 24 months. Fourteen percent of investors also are planning an initial allocation to US lower-middle-market direct lending in the next 12 to 24 months.
Counter-cyclical strategies are also sought-after. Forty-six percent of investors now view special situations funds as presenting the best opportunities in the next 12 to 24 months, and 37% of investors feel the same towards distressed debt funds. Thirty-four percent of respondents identified straight senior debt as presenting the best opportunities over the same timeframe.
|
|
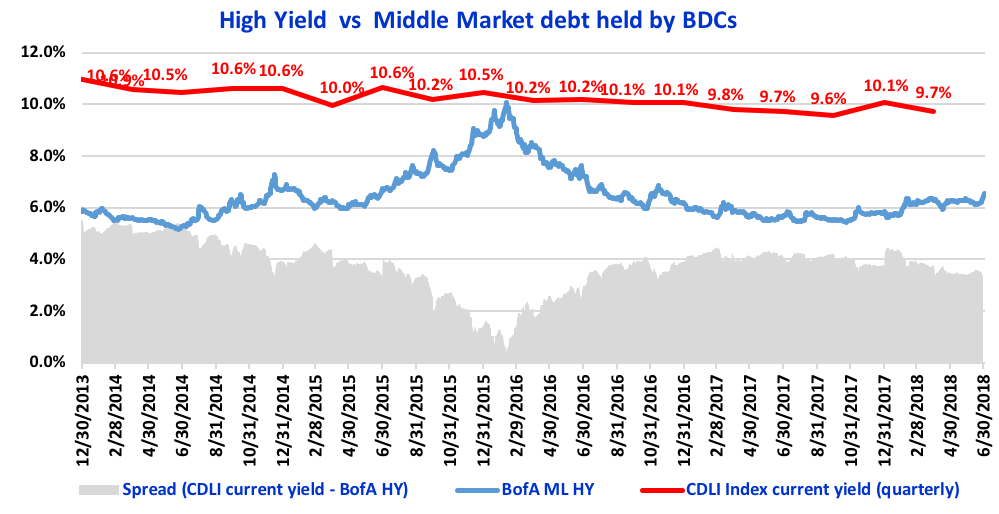
The red line in the chart is the *Cliffwater Direct Lending Index (CDLI) current yield, which is based on the investment income of the underlying assets held by public and private BDCs. BDCs invest in middle market companies, and the Index comprises of more than 6000 middle market loans – with 61% senior debt, 26% subordinate debt and 8% equity. The blue line displays the BofA Merrill Lynch US High Yield, which tracks the performance of USD denominated below investment grade corporate debt publically issued in the US. Increase in high yield depicts dislocations in market, pricing in higher risk. The spread of CDLI current yield minus BofA ML HY (shaded area in grey) shows the premium of middle-market loans over traditional High Yield, gauging attractiveness of the asset class. The higher premium for middle-market, to some extent, depicts the illiquidity for private loans and credit risk associated with smaller companies. Following a steady surge in the spread in 2016, which stabilized in 2017, but remains relatively attractive, with
a 354-basis points differential, as of 4 July 2018.
* As of 31 March 2018,
the CDLI index
includes USD 93bn in assets, with more than 6000 loans – approximately 61% senior debt, 26% subordinate debt, 8% equity and 5% other. BDC eligibility to be included in the Index is at least 75% of total assets represented by direct loans as of the Index valuation date. All the yields are unlevered.
CDLI
Index yield is total interest income of all BDCs covered, divided by their total assets, reported quarterly (9.72% as of 31 March 2018). CDLI data is quarterly while
BofA Merrill Lynch HY Effective Yield
is daily.
|
|
It’s not uncommon for a firm to have an association with an adjective. The description is often derogatory; for example, acquisitive companies are often said to be rapacious.
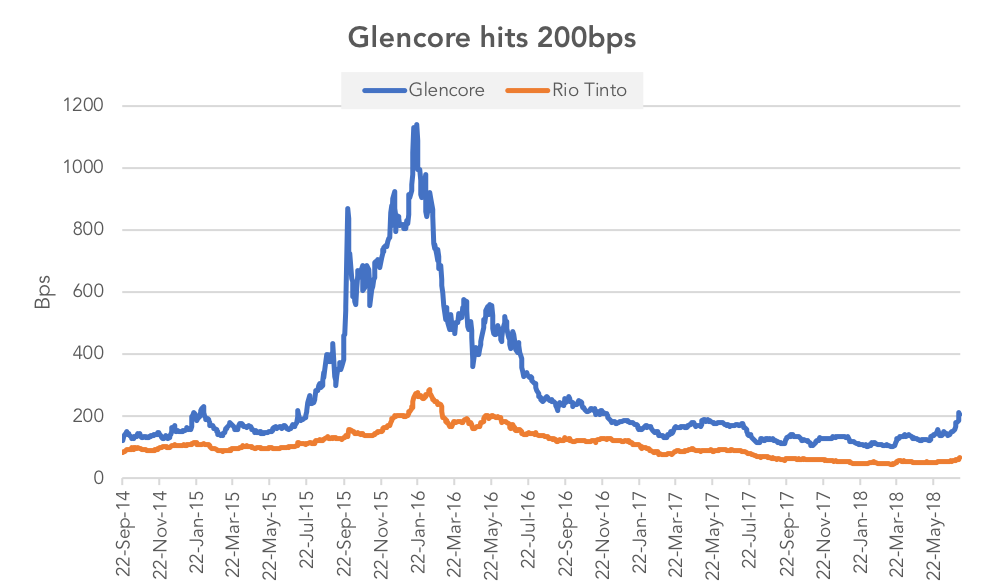
For Glencore, the commonly used adjective is “secretive”. This is no doubt due to the deliberately low profile of its CEO, Ivan Glasenberg, as well as its history as a private company. It was commonly referred to as “the biggest company you’ve never heard of”.
But there was a different perception in the CDS market. It was an established, highly liquid CDS name both prior to its IPO in 2011 and after. This underlines why a listing on a stock exchange, while important in raising the public profile of a company, is of secondary concern to fixed income investors – it’s all about the debt.
If one examines the credit history of Glencore, it appears to experience flare ups for relatively short periods before recovering and settling into its position as a high beta investment grade credit (it is consistently one of the widest names in the Markit iTraxx Europe).
In recent weeks the Swiss mining firm appears to have entered one of its phases of credit deterioration. Five-year CDS spreads widened from 135bps in mid-June to over 200bps on July 3, the first time it has breached this level since November 2016. IHS Markit liquidity shows the number of quotes rising and only a limited increase in the bid-ask spread,
|
|
suggesting liquidity remains robust. Cash spreads have also widened.
What has prompted this latest outbreak of risk aversion? Glencore’s business interests in the Democratic Republic of Congo have created plenty of negative publicity over the last few months, culminating in the US Department of Justice issuing a subpoena demanding Glencore had over records relating to its compliance with money laundering and corruption laws. The prospect of a long investigation and potentially punitive fines naturally weighed on the firm’s credit outlook.
But it didn’t take long for Glencore to respond, and it did so in the form of a $1bn share buyback. A shareholder friendly action such as this can be credit negative – bondholders prefer cash to be used to reduce debt. However, when a firm is under pressure and it acts decisively to support the stock price it can also be viewed as a vote on confidence from management. This appears to be the case in this instance, as Glencore’s spreads rallied 5bps to trade at 190bps.
This is still significantly wider than where it was trading a few weeks ago, reflecting the considerable uncertainty surrounding the investigation. Glencore’s management have proven in the past that they can combat credit deterioration and maintain the investment grade rating. It will have to do so again, which won’t be easy amid headline risk from negative press coverage.
|
|
This publication is a service to our clients and friends. It is designed only to give general information on the market developments actually covered. It is not intended to be a comprehensive summary of recent developments or to suggest parameters for any prospective financing opportunity.
|
|
|
|
|
|
|