|
“Nothing is cheap, everything is overvalued, and it’s very hard to find good opportunities.”
– Kathleen Gaffney, manager, Eaton Vance Multisector Income Fund
|
|
|
The Case for Covenants (Last of a Series)
|
|
|
“When things are good, people don’t pay attention to covenants, but when things go sour, covenants are their only line of protection.”
So said one head of credit research of a large asset manager in a recent Bloomberg article. He was referring to bond covenants, but the lesson applies equally to loans. And things have certainly been good. But how long will good last?
It’s clear some managers are betting conditions will be constructive for credit for a while. Cash continues to flow into the broadly syndicated market via retail funds and new CLO vehicles, as well as the middle market from managers’ fundraising. Interest rates remain low, default rates modest, and the economy steady, if uninspiring.
But as we outlined last week, loan structures are deteriorating in the face of keen competition among arrangers for deal mandates. Not just cov-lite creeping into the middle market, but loosening of terms across the board. “In that respect,” one loan manager told us, “things are worse than 2006. Credit agreements are one-sided.”
We’ve noted before in frothy times bankers behave as if anything worth doing is worth overdoing. Faced with losing an existing relationship to a more aggressive lender plus the relentless demand to put money to work, there’s no end to corners being cut.
This goes for underwriting standards beyond simple erosion of terms. One shop reportedly told a sponsor, “We don’t need separate due diligence. We’ll just piggy-back off yours.” Another handed out a list of transaction criteria like pricing and leverage, with a pre-commitment for any transactions meeting those characteristics.
It’s one thing for large cap firms to encourage such nonsense knowing market appetite will absorb anything right now. But why are some middle market lenders, armed with big hold levels, taking this stuff down for their own account?
What kind of havoc will cov-lite wreak on portfolios in a real downturn? S
ince 2013 the universe of institutional loans has been dominated by cov-lite issuers. When payment defaults happen among these vintages, they will happen with very little ability of the lenders to affect the outcome.
While defaults are still modest in number, the pattern is clear. S&P’s year-to-date default rate (by issuer count) for cov-lite loans is 0.78%. That compares to a cov-heavy rate of 0.34%. With only 290 cov-heavy credits tracked versus 640 cov-lite, that translates to five cov-lite issuers defaulting for every one cov-heavy issuer.
For experienced managers, this movie is familiar. No recession repeats exactly, but downturns affect large and small borrowers alike. The reason middle market lenders have been allergic to cov-lite for so long is they know underwriting midcaps is a high-touch proposition. With their hands firmly on the wheel going into a credit, the last thing they want, if problems arise, is to find themselves in a driverless car.
|
|
|
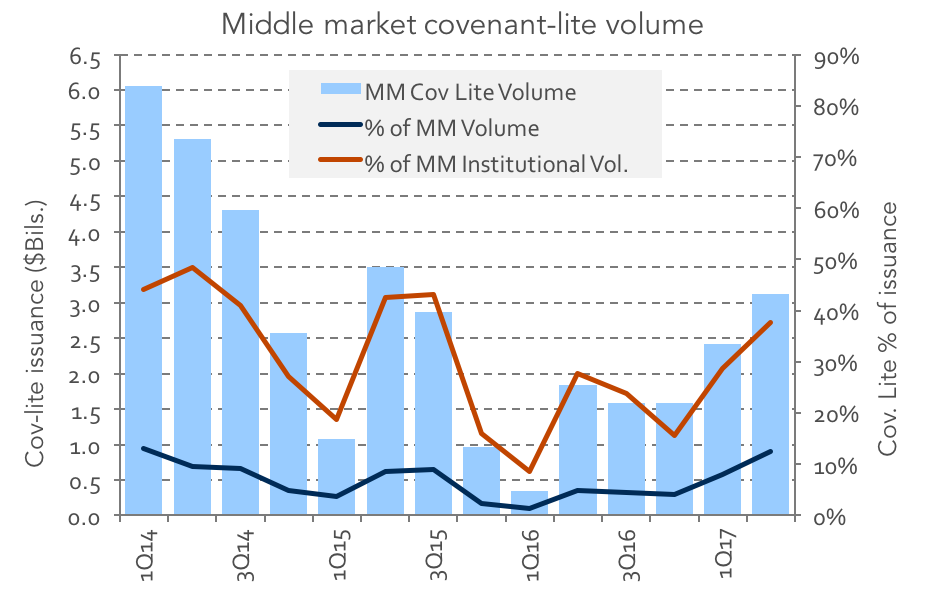
Despite growing cov-lite activity in the middle market, levels remain below those in early 2014
Source: Thomson Reuters LPC
|
|
|
This week we continue our conversation with Tess Virmani, SVP and Associate General Counsel of the Loan Syndications and Trading Association (LSTA). Tess works with the LSTA’s Primary Market Committee and Trade Practices and Forms Committee on legal projects. She also works on advocacy and regulatory matters.
The Lead Left: Does it help having one party control Congress?
TV:
It helps! But some people confuse a Republican majority as translating easily to a disapproval of the Guidance. That’s not necessarily the case.
TLL: But how much would change if LLG was approved as a rule?
TV:
Probably not much in that it is being applied quite strictly now. What if it was disapproved? SNC [Shared National Credit] reviews aren’t going away. It might be hard to prove they aren’t applying the principles underlying LLG anyway. A big source of relief if the rule is disapproved would be on the monitoring requirements side.
"The regulations don’t distinguish as clearly as they might between cash flow and ABL lending. "
TLL: So monitoring regulations would go away if LLG is disapproved.
TV:
One of the results of the Guidance has been that banks’ “leveraged loan” books now include portions of the investment grade portfolio, because those companies are greater than 4x levered on a total basis or 3x levered on a senior basis. If banks no longer had to carry out the monitoring requirements for those loans, that would be welcome.
TLL: What about asset-based lending? I’ve heard that sector has gotten wrapped up in the LLG?
TV:
The regulations don’t distinguish as clearly as they might between cash flow and ABL lending. There is language that standalone ABL facilities are excluded, but not if part of a larger debt structure. That would not longer be an issue if the Guidance was disapproved.
TLL: So Tess, tell us about your responsibilities at LSTA? We know your other colleagues very well.
TV:
The majority of my time is spent with Bridget Marsh [EVP & Deputy General Counsel] working with our two largest member committees, the Primary Market Committee and the Trade Practices and Forms Committee on issues like best practices, standard documentation, etc. I also work closely with Elliot Ganz [EVP & General Counsel] and Meredith Coffey [EVP of Research and Analysis] who head the LSTA’s advocacy efforts. I also spend time on the conference circuit. We are after all a trade association so education is one of our pillars of activity. Educating our members on current issues in the loan market and presenting outside our membership on the loan market itself are core responsibilities.
TLL: What’s the LSTA’s focus right now?
TV:
We are very excited about the second edition of
The LSTA’s Complete Credit Agreement Guide
which was published last year. Bridget and I worked closely with the authors, Michael Bellucci and Jerome McCluskey of Milbank, to produce this revised edition which covers all of the post-financial crisis credit agreement developments as well as LSTA guidance which has developed since the first edition was published in 2009. Of course we are always focused on our standard documentation.
|
|
|
Members who are active in the secondary market know our docs well and we have been building out our primary market offerings.
This year we are working on our first complete credit agreement form for investment grade revolving facilities. Our members seem happy to see that. Standardization really helps bring efficiency.
TLL: How about a leveraged template? That would be quite an exercise coming up with a standard!
TV:
It certainly will! We definitely hope to do more in that arena. Currently, we have our Model Credit Agreement Provisions which are LevFin focused and have been slowly expanding. It would be great to see those become a complete credit agreement. The European market does have those forms. But Europe as you know is a very different market. It’s much more bank dominated. And generally the market has a different attitude to the process.
TLL: We wrote not long ago about the issue of loan settlement. Are there other hot buttons with traders?
TV:
It comes and goes. When trading issues come up, they know who to involve at the LSTA. Since the financial crisis, our market advisory activity has increased. Market participants come to us more quickly now. We will consult with the various stakeholders, including debtor’s counsel if necessary, to develop an advisory which is then reviewed by our Trade Practices and Forms Committee and then published in final form a few days later. When defaults happen, we see more of these requests. Our advisories have covered many different issues, but often they center on how adequate protection payments should be handled or how payments should be distributed upon emergence. Also, restructuring support agreements often add a layer of complexity so we try to sort through any trading questions that arise.
TLL: I know that the LSTA has sued the SEC and Fed on behalf of the loan industry regarding risk retention for CLOs [link]. Any update?
TV:
We had a disappointing outcome in the DC District Court last year [granting summary judgment to the federal agencies]. We are appealing that decision to the Court of Appeals, though there’s likely not a ruling until next year. Oral arguments should be heard in the fall.
TLL: How would you summarize your case?
TV:
There are three planks to our argument, but probably the most relevant is that we are fighting for a correct definition of credit risk. The original rules on risk retention under Dodd-Frank required CLO managers to retain 5% of the entire vehicle. We have argued that as drafted the rules require far more than 5% of credit risk. Instead of 5% of the face amount of the CLO, the LSTA had proposed 5% of the equity (plus credit risk in the subordinated fees) if the CLO meets certain “Qualified CLO” criteria.
TLL: Did the DC court give any explanation for why your proposal didn’t address their concerns?
TV:
No, the DC court essentially gave deference to the agencies’ rulemaking. We continue to believe our argument is absolutely correct. But being right and being successful are two different things. We should find out if we are both early next year!
|
|
|
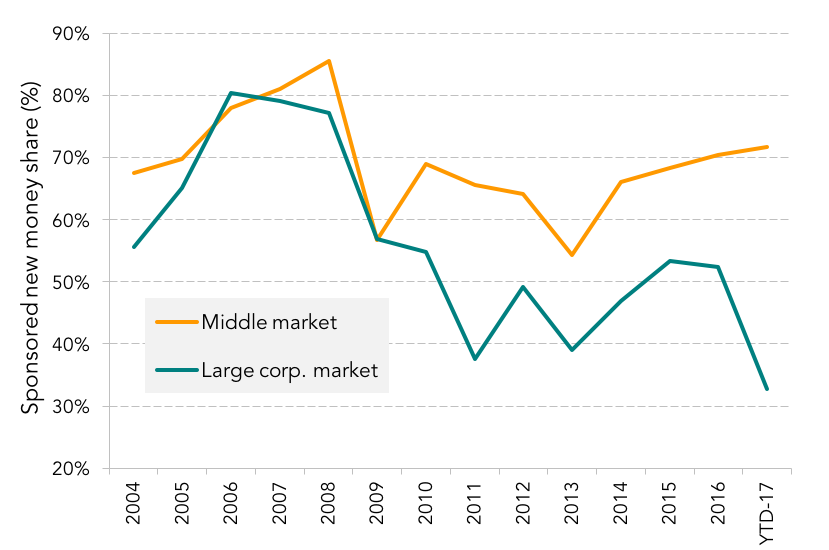
Middle market sponsor-backed issuers are seeing fewer repricings than large corp issuers
|
|
|
Private equity shops have taken advantage of strong liquidity in the loan market to refinance/reprice many of their portfolio companies into longer dated maturities, looser structures and cheaper pricing. However this repricing phenomenon has been more apprarent on large corporate portfolio companies rather than middle market issuers. The share of new money dealflow this year for sponsor-backed large corporate issuers has plummeted to an all time low of 33%. However, the middle market has held on strong with 72% of sponsored volume in 2017 coming from new money transactions which is the highest market share since 2008. Even so, middle market sponsored volume has not been that impressive and lenders continue to struggle with a supply demand imbalance.
|
|
|
Keeping up with runoff has been a huge challenge for these players as their higher priced assets are being redone in the institutional loan market at pricing that is unsustainable for their yield targets. Middle market lenders' outlook on new money dealflow in the second half has improved from the first half levels, however, lenders believe volume will only increase modestly. In the large corporate market, lenders are also hopeful that the repricing wave will slow down in the second half and new money M&A will make up a bigger share of the lending pie. However, strong demand from mutual fund inflows, CLO issuance and separately managed accounts will continue to keep the market extremely competitive.
|
|
|
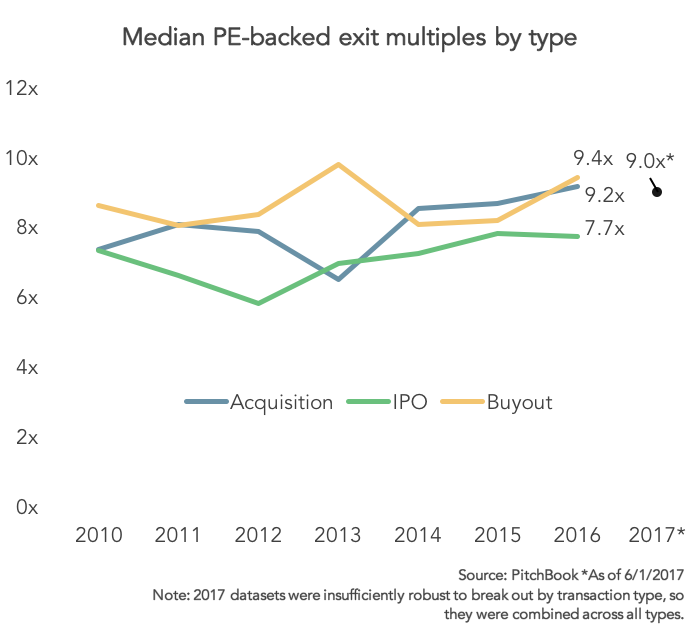
Exit multiples have stayed steady at an elevated level
|
|
|
Slowly but surely, exit multiples for secondary buyouts and corporate acquisitions have risen over the past two years, with figures for the former topping off at 9.4x last year. Thus far in 2017, the aggregate figure for all transaction types stands at 9.0x. These sustained metrics suggest a confluence of factors: considerable sums of dry powder; opportunistic selling on the part of PE portfolio managers; and current difficulties in proprietary deal flow origination. Sourcing fresh investments is difficult at any time – the maturation of the buyout industry has only rendered it doubly so, leading to a significant increase in sponsor-to-sponsor transactions. As different firms embrace varying segments of the operational value-enhancing chain key to the buyout investment strategy,
|
|
|
they can justify buying previously owned targets given their specialist focus or ampler resources. Hefty levels of dry powder to deploy in combination with still-amenable lending markets, enable more considerable equity contributions, should they be required, without overly levering underlying assets. Moreover, as PE firms still exit to strategic buyers at significant multiples despite overall slowing M&A activity, it’s clear they are still opportunistically selling off prime or best-placed assets. Testament to PE fund managers’ intense focus on portfolio optimization, this turnover speaks to the pressures PE investors have faced amid general perceptions of a slowing business cycle and artificially boosted asset valuations.
|
|
|
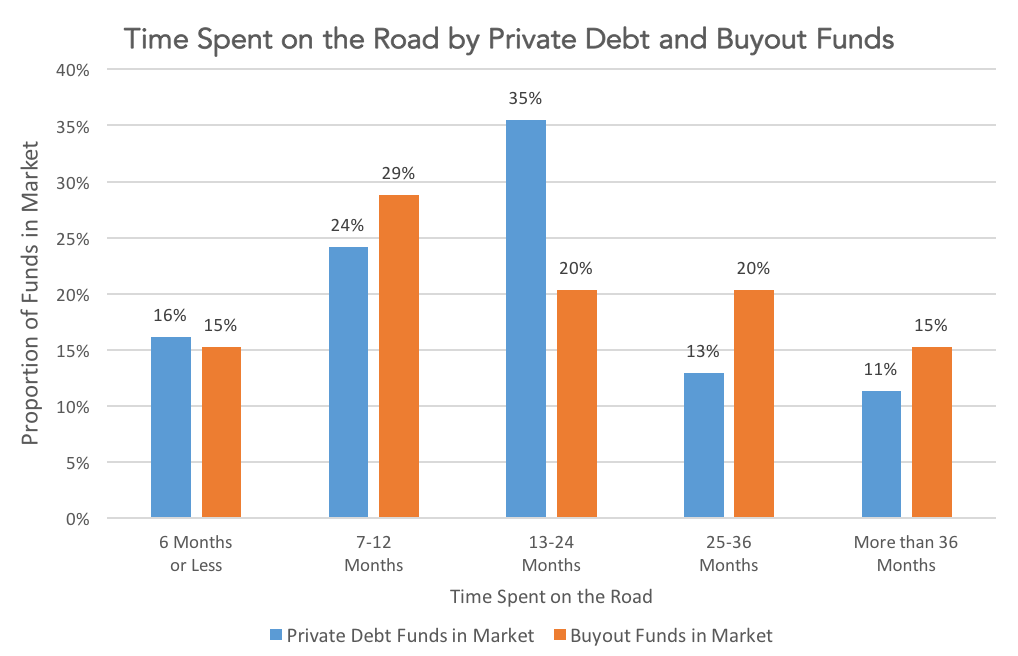
Private Debt Funds’ Time on the Road
|
|
|
Preqin here compares the time spent on the road by private debt and buyout funds currently in market. This demonstrates that although buyout funds are more likely to experience a quick fundraising process, they are also more likely to remain in market for several years.
Preqin currently tracks 312 private debt funds seeking commitments from investors, compared with 280 buyout funds. Similar proportions of both fund types, around 15%, have been in market for 6 months or less. This reflects the fact that in both asset classes, experienced fund managers with good track records are able to raise significant amounts of capital quickly and successfully.
Notably, a many more private debt funds have been in market for between one and two years. Over a third (35%) of private debt vehicles launched 13-24 months ago, compared to just a fifth of buyout funds.
|
|
|
Conversely, only 13% of private debt funds have been in market for 25-36 months, compared to 20% of buyout funds. This suggests that while a slightly greater proportion of buyout funds are able to close within a year of launching, a much higher proportion require several years to raise capital. Overall, 36% of buyout funds currently in market launched more than two years ago, while only a quarter (24%) of private debt funds have been on the road for that long.
This is indicative of the differing natures of the two fundraising markets. Although both private debt and private equity are seeing the emergence of a ‘two-tiered’ environment, in which successful managers can raise large funds very quickly, and emerging managers compete fiercely for investor capital, this trend is much more pronounced in the buyout asset class. Private debt fundraising may be competitive, but the largest proportion of private debt fund managers are able to close within two years of launching.
|
|
|
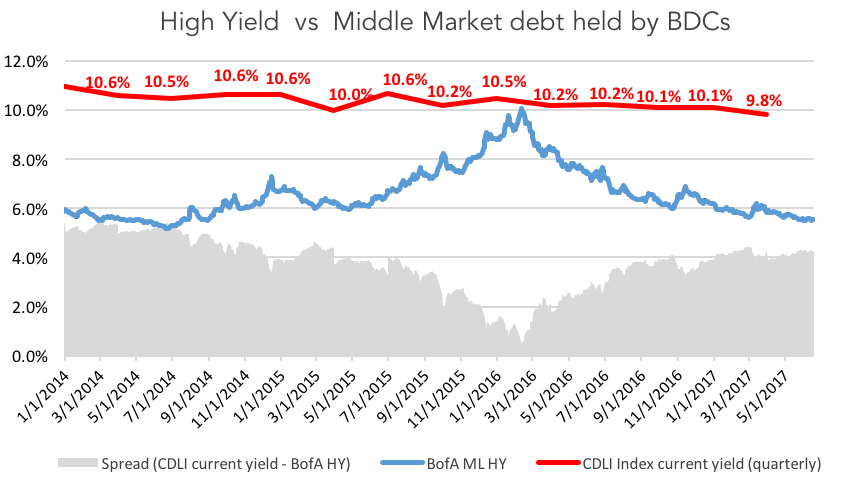
Source: Cliffwater Direct Lending Index and BofA Merrill Lynch US High Yield Effective Yield
The red line in the chart is the *Cliffwater Direct Lending Index (CDLI) current yield, which is based on the investment income of the underlying assets held by public and private BDCs. BDCs invest in middle market companies, and the Index comprises of more than 6000 middle market loans - with 57% senior debt, 30% subordinate debt and 9% equity. The blue line displays the BofA Merrill Lynch US High Yield, which tracks the performance of USD denominated below investment grade corporate debt publically issued in the US. Increase in high yield depicts dislocations in market, pricing in higher risk. The spread of CDLI current yield minus BofA ML HY (shaded area in grey) shows the premium of middle-market loans over traditional High Yield, gauging attractiveness of the asset class. The higher premium for middle-market, to some extent, depicts the illiquidity for private loans and credit risk associated with smaller companies. Since early 2016, we have seen a steady surge in the spread, increasing to 426 basis points as of 19 June 2017, making middle market relatively more attractive.
* As of 31 March 2017, the CDLI index includes USD 87bn in assets, with more than 6000 loans – approximately 56% senior debt, 31% subordinate debt, 9% equity and 4% other. BDC eligibility to be included in the Index is at least 75% of total assets represented by direct loans as of the Index valuation date. All the yields are unlevered. CDLI Index yield is total interest income of all BDCs covered, divided by their total assets, reported quarterly (9.8% as of 31 March 2017). CDLI data is quarterly while BofA Merrill Lynch HY Effective Yield is daily.
|
|
|
A year ago this week, the credit markets were digesting the shock of a ‘leave’ vote in the Brexit referendum. What followed was a period of extreme volatility and it seemed that 2017 was set for more of the same.
But many of us have been proved wrong. The Markit iTraxx Europe closed at 99bps on July 27 2016, two business days after the vote. A year later the index is trading at 55bps - its tightest level since April 2015 – and volatility has, with a few minor blips, stayed at very low levels.
So why didn’t the predicted rollercoaster year materialise? A number of reasons could be cited, including solid, consistent economic growth in the Eurozone countries. But perhaps more relevant is what didn’t happen. Political risk has been the dog that didn’t bark. The Dutch election was a non-event, while Emmanuel Macron emerged from nowhere to claim victory in the French presidential election, much to the relief of everyone bar National Front voters. Angela Merkel’s Christian Democrats are well ahead in the polls and she looks set to retain her chancellorship. Only Italy has the potential to reignite volatility, and it is by no means certain that an election will happen this year rather than next.
|
|
|
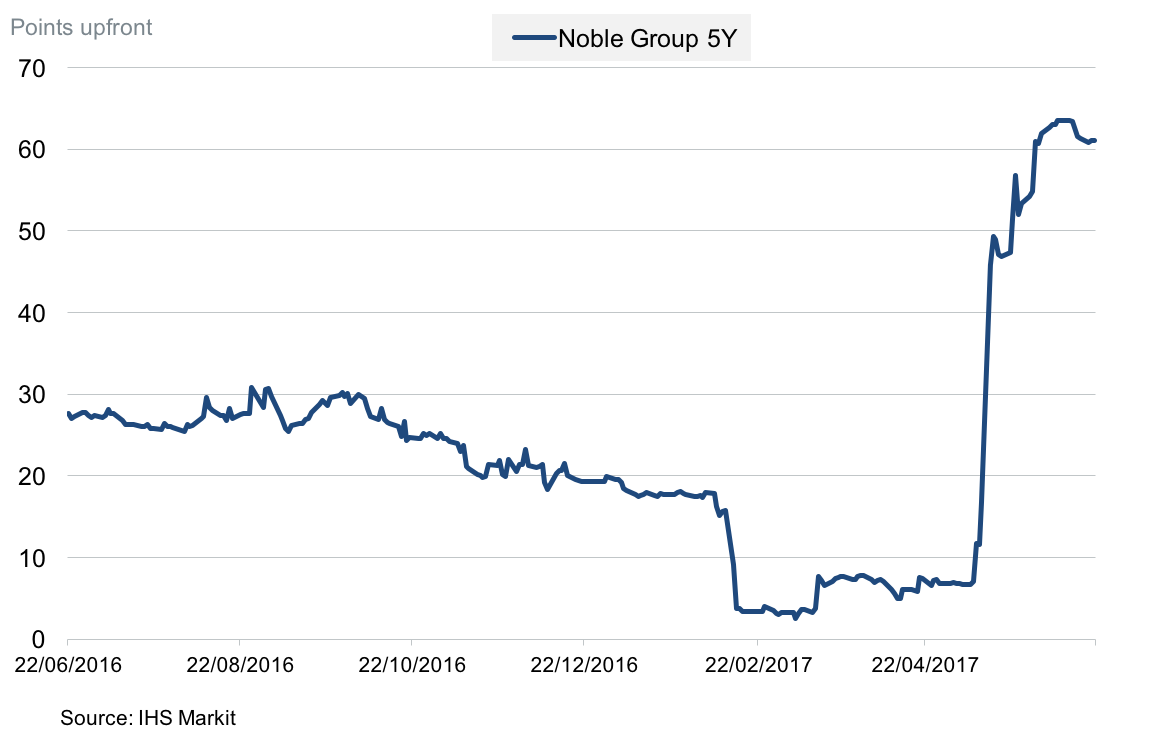
On a macro level, it would therefore be no surprise to see a quiet summer, barring unexpected monetary policy actions. But idiosyncratic risk remains, and one name in particular is worth monitoring in the coming weeks. Noble Group, an Asian commodities trader, has struggled for some time and matters appear to be coming to a head this year. It managed to secure a 120-day extension to a credit facility, buying it some time. But though the firm’s equity price rose on the news, the fixed income markets reflect that the extension may be delaying the inevitable. Noble CDS shot up from 10 points upfront in May to 60 points earlier this month as its dire predicament became apparent and barely budged on news of the loan extension. Indeed, the apparently positive news only prompted a question to be put to the ISDA DC, asking if a restructuring credit event had occurred.
At the time of writing, the ISDA DC was still opining on this question. But even if they decide a credit event has not occurred, Noble’s scheduled interest payments over the next few months may prompt speculation that a failure to pay could happen. IHS Markit data shows that the firm’s perpetual bond is trading at 15 points, while its March 2018 bond is trading at 43 points. We will soon find out if Noble manages to escape the summer without a credit event.
|
|
|
|
|
Join the leading voice of the middle market. Try us free for 30 days.
|
|
|
|
This publication is a service to our clients and friends. It is designed only to give general information on the market developments actually covered. It is not intended to be a comprehensive summary of recent developments or to suggest parameters for any prospective financing opportunity.
|
|
|
|
|
|
|