THE LOCATION STRATEGY TOP 10


HAVE REASON TO THINK MAYBE YOUR EMAIL MAY SUDDENLY CHANGE? WANT TO KEEP RECEIVING OUR NEWSLETTER? CLICK HERE TO SEND US YOUR PERSONAL EMAIL AND WE'LL KEEP YOU ON THE LIST. AND AS ALWAYS, WE DON'T GIVE OUR EMAIL LIST TO ANYONE.

Request Consult with Location Strategy

MARK YOUR CALENDAR


Scott Davis will be speaking at the North Houston Counties Builder Association meeting on December 7.  We’ll post the link as soon as it available.   This will be your only chance this fall to hear Scott’s public presentation on the state of the market.


HOUSING DEMAND IS STILL THERE


The Location Strategy thesis remains this downturn is a battle between ongoing unmet housing demand and the Fed's attempts to recover from the reckless increase in money supply during COVID. The chart below shows the gap between new households and housing added in the US since 1960. Over time the gap has waxed and waned, but it was only during the pandemic that the ratio of households to new housing approached and then collapsed below 1, because of a sizable decline in new population growth created by covid-era border closures and a fall in fertility rates. Thus, the number of new residents per housing unit then collapsed below 1 for the first time in decades.


2022-11-17_10-00-21 image

But this trend is unlikely to continue since "after a construction boom in the second half of 2020 and 2021, the home building sector is contracting." Population growth is also returning to more normal rates. The gap between new population and new units will already be growing again in 2023. It does not look like boom of the last 18 months will be enough to reverse the worsening situation in housing production. This ratio should shortly return to normal levels - and when combined with the largest number of 30 year-olds in US history coming next year, presents a wave of demand coming into the market. Certainly the Fed is powerful, but demographics is destiny.


POWELL'S REVENGE 


Building permits are down, back to around 2020 levels. But the decline in mortgage purchase applications is even more significant, driven of course by the rapid rise in interest rates. This is the weakness in what we would call "interim demand." When compared to NAHB Homebuilder's sentiment (2nd graph) suggests starts have much farther to decline until interest rates stop suppressing this demand.

US-Starts-downside2211180537 image

MORTGAGE DELINQUENCIES ARE LOW


We showed a few weeks ago how the universe of mortgages likely to refi was basically zero because no one had a mortgage with rates above current levels. Mortgages have very low delinquency rates in part because the rate doesn't change - and ARMs are only 4.7% of total mortgages. This chart also explains why student loans are such a hot political issue.

US-Student-loan-delinquencies-are-about-to-pick-up-as-payments-resume2211180537 image

How will prolonged high rates affect the market for your project?  Click here to contact Location Strategy for a quick consult.

MORTGAGE APPLICATIONS HAVE HIT A DECADE LOW

US-MBA2211170436 image

MORGAN STANLEY FORECASTS HOUSING RECOVERY IN 2024


Residential investment will remain depressed next year, according to a forecast from Morgan Stanley.

US-MS-Resi-investgment2211150535 image

SIGNS INFLATION MAY EASE


At the risk of joining our chart of failed inflation predictions, this is the first best sign we have seen that inflation may actually be going down. You may remember earlier in the year we predict 8% inflation this fall based on spring PPI increases. Now they are reversing; suggesting that next spring we may see reducted inflation.

US-PPI-Upstream-price-pressures-are-easing2211160433 image

RETAIL HEADLINE RISK


Headlines show retail sales going up, but in real terms they have fallen sharply and are flat at best.

US-Ret-Real-Control2211170436 image

GETTING OUT OF TOWN


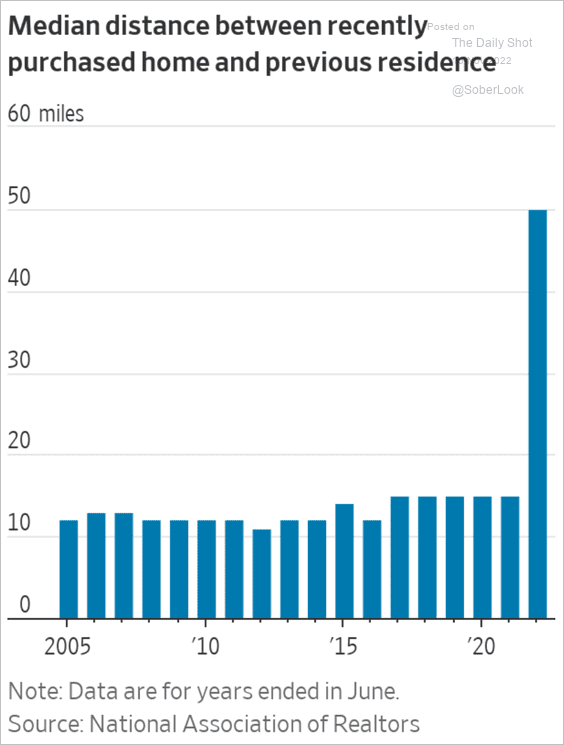
NAR surveys show that for the last 15 years the median distance between a new home and the buyer's previous residence was about 10-15 miles. Last year it was 50 miles. The NAR explains: "Family support systems still prevailed as a motivating factor when moving and in neighborhood choice. For others, housing affordability was a driving factor to seek homes in areas farther away. For many, remote work decisions were formalized in the last year, providing clarity for employees to permanently move to more distant areas."


The shares of buyers who purchased homes in small towns (29%) and rural areas (19%) were the highest ever recorded, while the shares of homes purchased in suburban (39%) and urban (10%) locations declined from one year ago.

VTC-Moving-farther-away2211160433 image

WHERE'S THE BEEF?


The US Department of Agriculture released a report Friday that might show ranchers sent the fewest cattle to feedlots in a decade. Cattle generally spend several months at feedlots while they grow and gain body fat and muscle before being transported to a meat packing plant. Fewer cattle at feedlots may only imply dwindling beef supplies and high prices at the supermarket. Bloomberg's average estimate for cattle placed into feedlots in October is about 2.17 million, a decline from nearly 2.5 million in early 2019 (right before the virus pandemic), and the lowest level since 2012. 


We don't consider ourselves preppers at Location Strategy, but we are enjoying our new deep freezer, full of ribeyes from Costco -- just in case.

Snag_281e6bc8 image

THE GREAT LITHIUM RUSH OF 2023


Last week we featured a chart showing that E&P jobs in the oil sector were flat, even at current high price levels. This week we wanted to show the alternative behind that slowdown. The all-electric future, with homes, cars and factories all powered by renewable sources, and stored in batteries for when the wind doesn’t blow and the sun doesn’t shine. Those batteries need lithium, and here's some elementary math on how much more we’ll need to scale up batteries:


Lithium-demand image
mining-lithium-fotolia_23141047 image

Above is what one of these lithium mines looks like. These mines take a decade to get up and running. Lithium mines also routinely employ children as young as 7 - with 40,000 children are reported to be working in mines in the DRC alone. This is the the desired alternative to oil and the reason we are not presently adding new jobs in this key sector for our region. To borrow a phrase from environmentalists, the demand curve on this chart is not sustainable; growth is forecast at 8.1% per year for the next five years and then it accelerates again.


Why did we include this? Because the preferred energy path is not realistic and the pause in energy hiring is temporary. The current Administration's willingness to negotiate with foreign oil producers and tap the SPR is evidence that this is true. Eventually hiring will return to our market because no scalable credible alternative exists. Houston will ultimately face the end of oil, like Pennsylvania coal towns and Nantucket whaling towns before it. But that day won't be soon, and not before someone figures out the math on the chart here.


Do you need help with your inventory situation? Click here to contact Location Strategy for a quick consult.

JOB LISTINGS


Thanks for your submissions! We'd love to post your job here. It's free and we can keep the name of your company confidential if that's important to you. Email me to post. N.B. We post the newest jobs up front, and we refresh this list every week.


Scott Davis

LOCATION STRATEGY, LLC

1302 Waugh Drive #178

Houston, Texas 77019


www.locationstrategyllc.com


832.304.DIRT (3478)