HAVE A PROJECT SOMEWHERE IN TEXAS?

WE'VE PROBABLY BEEN THERE.

THE LOCATION STRATEGY TOP 10


IF YOU'RE NEW TO OUR TOP 10, WELCOME. WE SEND OUT THE TOP 10 DATA CHARTS WE SEE EACH WEEK WE THINK OUR CLIENTS SHOULD KNOW ABOUT. WE HOPE YOU WILL ENJOY IT, AND WE NEVER GIVE/SELL OUR LIST TO ANYONE.


HAVE REASON TO THINK MAYBE YOUR EMAIL MAY SUDDENLY CHANGE? WANT TO KEEP RECEIVING OUR NEWSLETTER? CLICK HERE TO SEND US YOUR PERSONAL EMAIL AND WE'LL KEEP YOU ON THE LIST. AND AS ALWAYS, WE DON'T GIVE OUR EMAIL LIST TO ANYONE.


LOCATION STRATEGY IN PERSON NEXT WEEK


SCOTT DAVIS WILL BE SPEAKING AT THE FOLLOWING EVENTS NEXT WEEK:

TELL ME AGAIN ABOUT THAT GREAT JOB MARKET


The Wall Street Journal recommends that you skip breakfast to help make ends meet.

Wells Fargo sees three down quarters of GDP growth this year, but a resumption of growth in 2Q24.

US-Wells-Fargo-sees-three-down-quarters-this-year2302130444 image

The Fed’s Magic Housing Inflation Chart is Back! 


Shelter inflation is the single largest component of Core CPI. Remember the housing inflation according the USFG is based on asking homeowners how much their houses would rent for, and lags actual transaction-based indices by 6-9 months.

US-CPI-Core-Detail2302150528 image

Apparently the Fed is still only looking at year-over-year charts, like this chart below from S&P Case-Shiller national index. While it's true the current YOY figure shows home prices up 7.7% versus a year ago, the index peaked in July 2022, it's presently declining at nearly 1% point per month and that rate of decline is accelerating. That is not the same thing as "home prices are up almost 8% over last year." But the policy is treating like it is - which is why we think a higher mortgage rate environment will persist longer than seems necessary.

The chart below clearly illustrates the phenomenon: pandemic boom gains are masking significant declines this year - and we've confused "prices went up" with "prices are still going up" in calculating home price gains and even the CPI - about 40% of which is comprised of home price gains.

The Fed's index for rental costs has the same flaws as the one for owned homes. The OER is aligned with Zillow data advanced by 10 months - meaning that the Zillow data started showing declines months ago, while OER is still showing increases.

US-CPI-Rent-inflation-hopeful-signs2302150528 image

WHAT IS A LANDING FOR THE ECONOMY?


When it comes to "soft landings," every Fed chair thinks they are Sully Sullenberger. The reality is building permits have bottomed and reversed 13 times since 1960; only 4 have been "soft landings," which are reversals that took place without a recession. But in the other nine times, the recession did not end until housing broke out. While the outlook for rate chages is unclear, and Location Strategy still thinks the terminal Fed funds rate will be 5.25-5.5%, we expect to see a quick reversal in building permit trends because the underlying supply and demand factors that caused the rapid increase in prices over the last few years have not really been resolved.

US-GDP-ECO-landings2302160501 image

HISTORY DOESN'T ALWAYS REPEAT ITSELF


Busts start alike but end differently. Despite being caused by the most rapid change in interest rates in history, the decline in sales is similar to the late 1970s and post-2005. Both of those were fairly long recoveries and we expect sales to return to near peak levels in shorter time frames than either of these prior downturns.

US-New-home-sales-v-previous-busts2302160501 image

Builders are already starting to see sales increase in some areas in response to lower base prices.

US-Housing-uptick-in-sales2302170441 image

Even with those upticks now, we are still seeing mortgage applications and rate locks dropped to multi-year lows last week (2 charts).

US-MBA2302160501 image

GAP BETWEEN SUPPLY AND DEMAND STILL CAVERNOUS


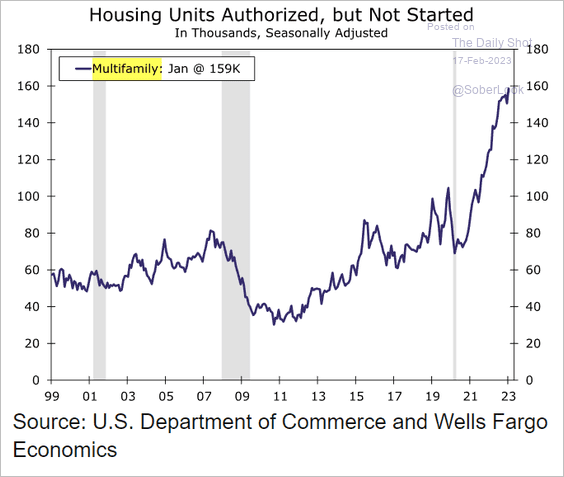
The charts below from Evercore ISI show that at the end of 2022, there were almost 100K more new homes in the pipeline than normal.  However, when this inventory is added to the low resale inventory, the total homes available for sale is more than 1 million below average. (Hat tip: Mike Zarola). Even when you add the 160,000 new houses permitted but not yet started, the supply is far below what we expect current demand to be.


Is there an economist out there who can explain to me how limiting the supply of a good will reduce the price?

US-Starts-authorized-but-not-started2302170441 image

We may soon see a sharp drop in construction jobs


I would guess it's already easier to find subs and construction workers. With the decline in housing activity, it's probably about to get even easier.

US-Housing-v-construction-jobs2302160501 image

JOBS!


Remote


Houston


Dallas


Scott Davis

LOCATION STRATEGY, LLC

1302 Waugh Drive #178

Houston, Texas 77019


www.locationstrategyllc.com


832.304.DIRT (3478)