THE LOCATION STRATEGY TOP 10


IF YOU'RE NEW TO OUR TOP 10, WELCOME. WE SEND OUT THE TOP 10 DATA CHARTS WE SEE EACH WEEK WE THINK OUR CLIENTS SHOULD KNOW ABOUT. WE HOPE YOU WILL ENJOY IT, AND WE NEVER GIVE/SELL OUR LIST TO ANYONE.


HAVE REASON TO THINK MAYBE YOUR EMAIL MAY SUDDENLY CHANGE? WANT TO KEEP RECEIVING OUR NEWSLETTER? CLICK HERE TO SEND US YOUR PERSONAL EMAIL AND WE'LL KEEP YOU ON THE LIST. AND AS ALWAYS, WE DON'T GIVE OUR EMAIL LIST TO ANYONE.


THE MOST POSITIVE INDICATOR I'VE SEEN


We cover a lot of negative news in our publication, but we are optimists at heart.  Thus we present the most bullish indicator we’ve seen.  In the unlikely event you don’t receive the newsletter next week, you might find me slinging chopped beef sandwiches and stuffed beavers somewhere like Wharton or Royse City.


HOUSING DROPS

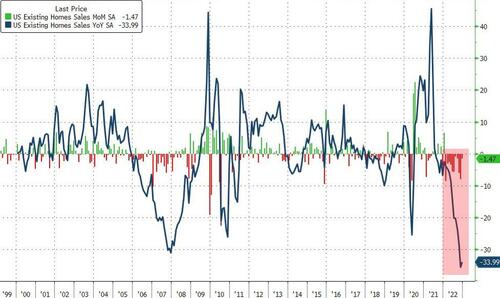
Existing home sales in the US dropped for the 11th consecutive month in December, with a 1.5% decrease from the previous month, and a record 34% drop year-over-year. This was worse than the worst drop during the Great Financial Crisis. Sales of single-family homes fell by 1.1% from the previous month to a pace of 3.6 million, the lowest since the end of 2010. Additionally, existing condominium and co-op sales decreased by 4.5%. This marks the longest streak of monthly sales declines in history and brought the Existing Home Sales SAAR to 4.02mm, the lowest since November 2010, even worse than the worst month of the COVID lockdowns.


2023-01-20_07-04-25 image


U.S. new-home construction continued to fall in December, underscoring deterioration of the market amid high building costs and elevated mortgage rates. Housing starts declined to an annual pace of 1.382 million last month, down 1.4% from November. For the year as a whole, starts slid to 1.553 million from 1.601 million in 2021, marking the first annual decline since 2009.


chart-8e17fdd9287c58e459458ae4-ipadFeed2305 image

Both of these declines took place as mortgage rates declined for three straight months:

2023-01-20_06-56-16 image

RECESSION FORECAST


Historically, recessions start about 17 months after the 2s/10s Treasury curve has inverted for three months. So far, we are roughly nine months away from that point.

US-Recessions-ST2301190539 image

JOB LOSSES ARE UNDERSTATED


We've covered problems with job reports for several months now. Companies announcing major layoffs must report them because of Worker Adjustment and Retraining Notification ACT. Goldman recently constructed a timely WARN notices measure to uncover layoffs. To account for reporting delays, the bank's economists adjusted their measure for the average number of days between when notices are dated and when they are posted on state government websites. The analysis suggests that WARN notices were well below their pre-pandemic levels between April and August of 2022 but have risen relative to the pre-pandemic seasonal norm in the last few months. The notices we have observed so far this month are consistent with a roughly 21k monthly rate for January, somewhat higher than the 19k average in 2017-2019.


We looked at the WARN layoff postings for the Texas markets, and they still look relatively healthy, at least outside of Austin:

Q1 layoffs typically represent 16-18% of a full year, so these numbers are suggesting 2x the number of layoffs in 2023 as the previous two years.  There is one caveat:  the Q1 numbers for 2023 are high because of a couple of outsized layoff events – Ryder Trucks will be laying off 800 people in March, and Facebook is presently letting another 200 go in Austin.   Perhaps the bloom is off the rose for the Capital City.

REAL WAGES STILL NEGATIVE

JOB LOSSES ARE UNDERSTATED


As of Q3, household cash balances remained well above pre-COVID levels, which will be a tailwind for consumer spending.

US-Recession-HH-cash2301170259 image

How much house can you buy for $1,600/month and 20% down?


Last fall we saw a dramatic drop in the price of house could be purchased with an average mortgage. With the recent decline in rates, buyer purchasing power is up $30,000, or 10%.

US-How-much-home-can-you-buyQ2301200436 image

And who’s qualifying for those mortgages?


US-Number-of-potential-homebuyers-who-can-qualify-for-a-mortgage-based-on-mortgage-size-and-rate2301200436 image

Tighter standards have made it harder to sell homes, but have resulted in higher quality borrowers:


US-Mortgage-origination-by-credit-score2301200436 image

JOBS!


Anywhere


Houston


Dallas


Scott Davis

LOCATION STRATEGY, LLC

1302 Waugh Drive #178

Houston, Texas 77019


www.locationstrategyllc.com


832.304.DIRT (3478)