|
Dear Clients and Friends,
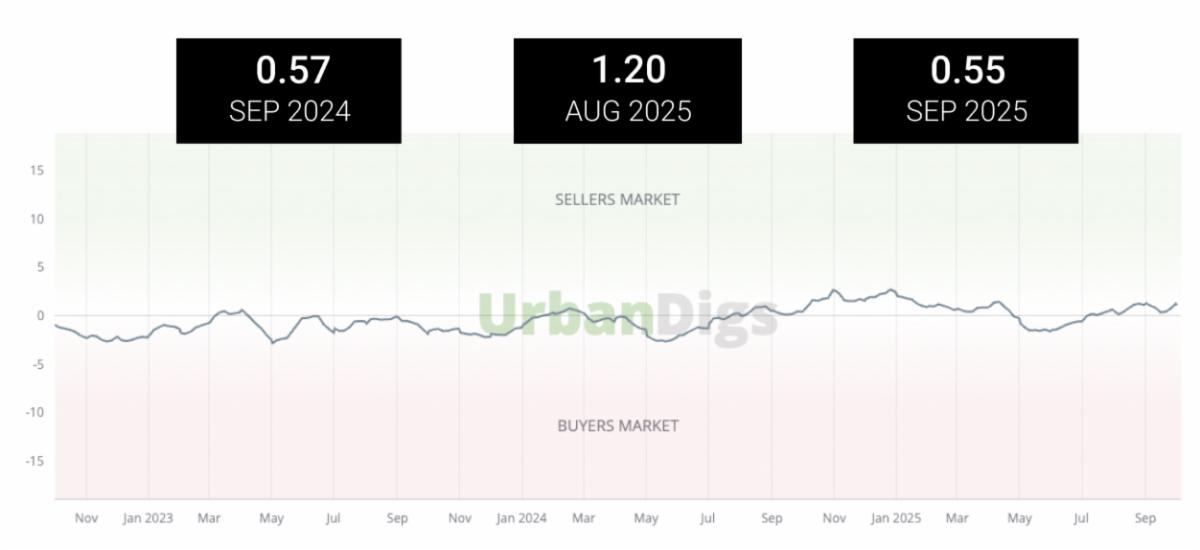
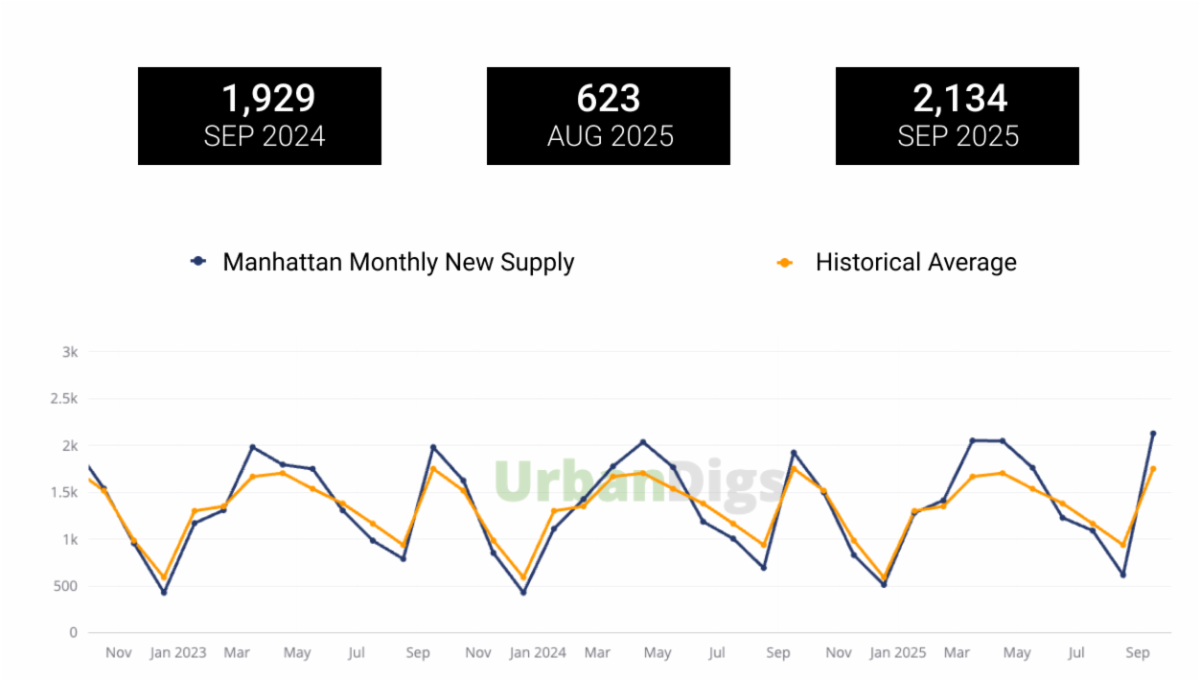
The number of new listings rose significantly in September 2025 compared to the prior month (2,134 homes versus August’s 623), while monthly signed contracts simultaneously declined (764 compared to August’s 811). Historically speaking, contract activity is generally low in September and picks up around mid-October. This is logical, as listings first come on after Labor Day, are subsequently viewed/considered by buyers, and then deals are negotiated and ultimately contracts are signed. Just how ‘seasonal’ sales activity is depends on each home’s price-point, location, and the type of buyer it caters to (e.g. pied-a-terre, large UES/UWS primary residence, downtown condo, etc.), and we are always happy to answer any specific questions.
Focusing on the luxury sector, 70 contracts were signed above $4M in September 2025. While this represents a relatively steep decrease from September 2024’s 92 contracts, NYC’s upper price segments have generally overperformed the broader market since the pandemic and appear stable. September’s year-over-year dip is more likely an anomaly than a trend; however, we’ll continue to closely monitor the data going forward.
Lastly, as our clients consider their real-estate portfolios, we believe it’s important to call out the often-overlooked fact that available prime new development inventory is currently quite limited and will continue to be so through 2026. The ~3,600 available new development units (per the most recent 2Q25 data) represents a 10-year low – and that number is only anticipated to decrease in 2026. This reduced inventory is the result of the gap between two eras of development: i) the immediate post-pandemic boom when pent-up buyer demand ate up much of the available new construction homes and developers were able to acquire parcels for future projects with relatively inexpensive financing, and ii) the subsequent 2022/2023 simultaneous increase in interest rates and land prices which jointly made potential ground-up construction projects more difficult to profitably underwrite and consequentially shrank the future pipeline. While many builders are now once again actively pursuing future residential projects, it will take years for much of that product to come to market.
|