|
Dear Clients and Friends,
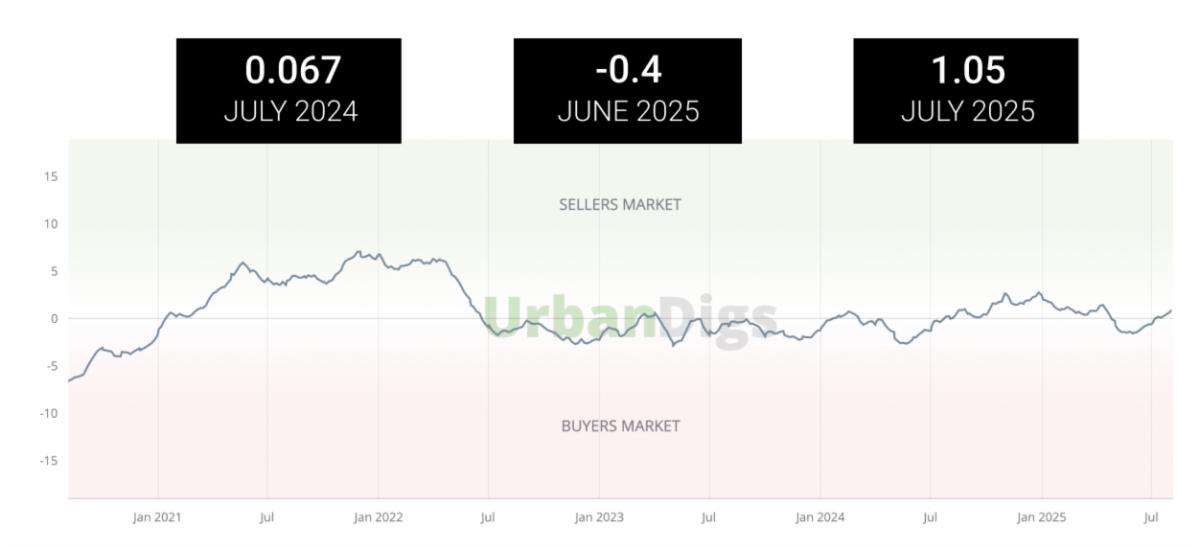
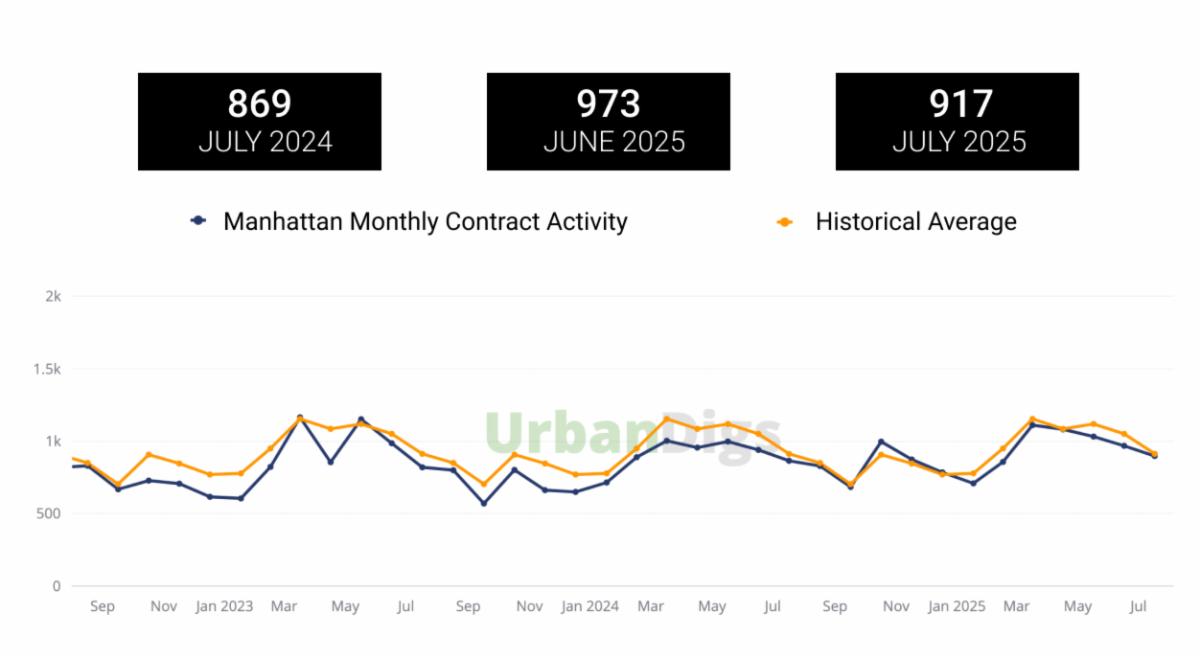
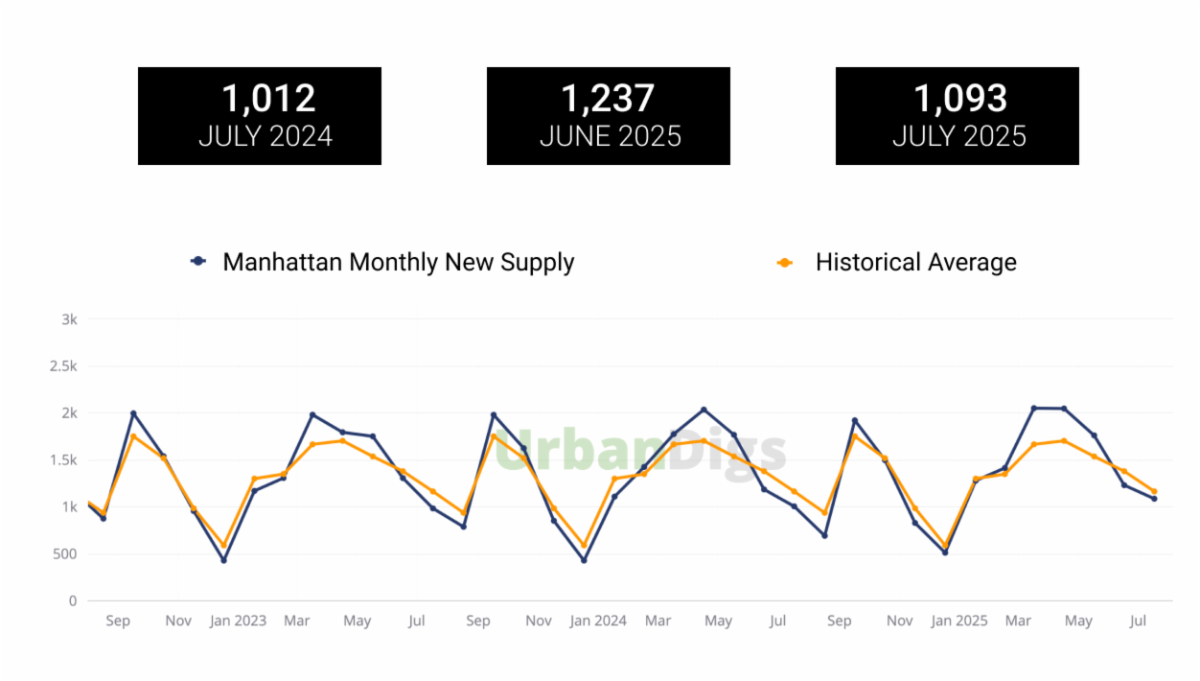
The New Yok City residential market experienced a moderate expected seasonal slow-down in July 2025 vs. the month prior, though the ~12% decline in new listing supply outpaced the contemporaneous ~5% reduction in contracts signed. This technically implies that the market pulse has shifted in favor of sellers, however we remain in ‘neutral’ territory and buyers across all price points feel empowered and remain focused on properties’ relative value. Looking forward, lower-than-expected job numbers from May-July, combined with the dissent of two Fed Officials who indicated they would have lowered rates rather than keeping them unchanged at their July 30th Fed meeting, has boosted market expectations of a possible rate cut at the next Fed meeting scheduled for mid-September.
Turning to the luxury market: there were 91 contracts signed for Manhattan homes over $4 million in July 2025 -- a decrease from June 2025’s record 153, and just a tick higher than July 2024’s 85. PropertyShark’s recent 2Q25 report identified the two highest price-point neighborhoods in NYC as Hudson Yards (median sale price of $5.95M) followed by Tribeca (median sale price of $4.15M). Brooklyn also notched an ever-growing share of luxury transactions, primarily driven by sales of water-front new development units and single-family townhouses. In fact, from January – July of 2025 townhouse sales comprised approximately 78% of the transactions over $5 million in Brooklyn.
Lastly, as many of our readers are in the midst of summer travels, we wanted to underscore NYC’s unique draw as a destination unto itself. The average weekly occupancy rate for New York City hotels for the first half of 2025 was ~82% (twenty-percent higher than the national average) and the most recent 2024-2025 Broadway season grossed the highest sales in its recorded history!
|