|
Dear Clients and Friends,
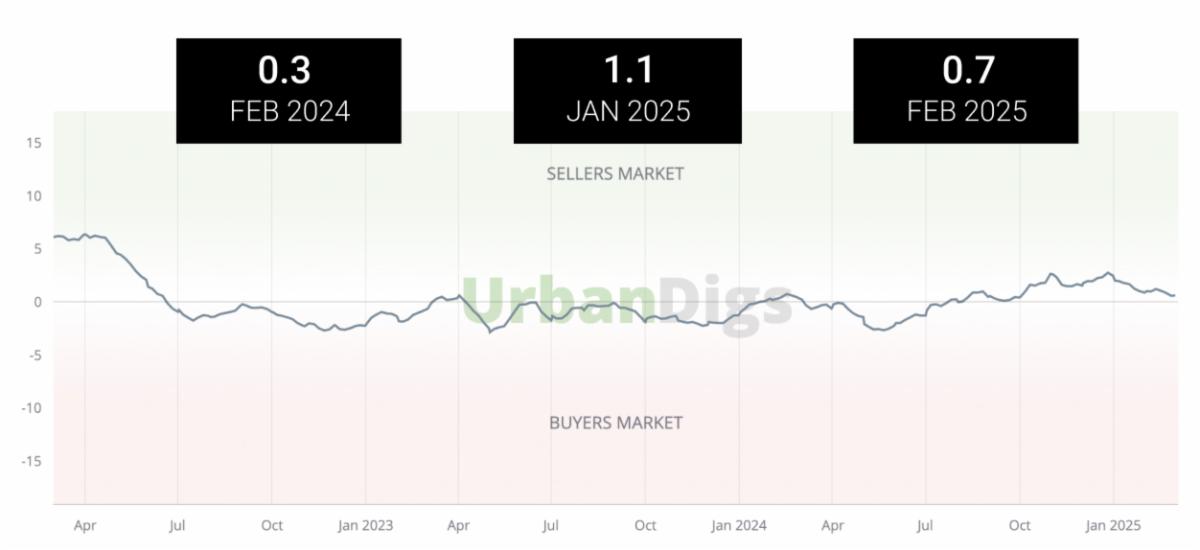
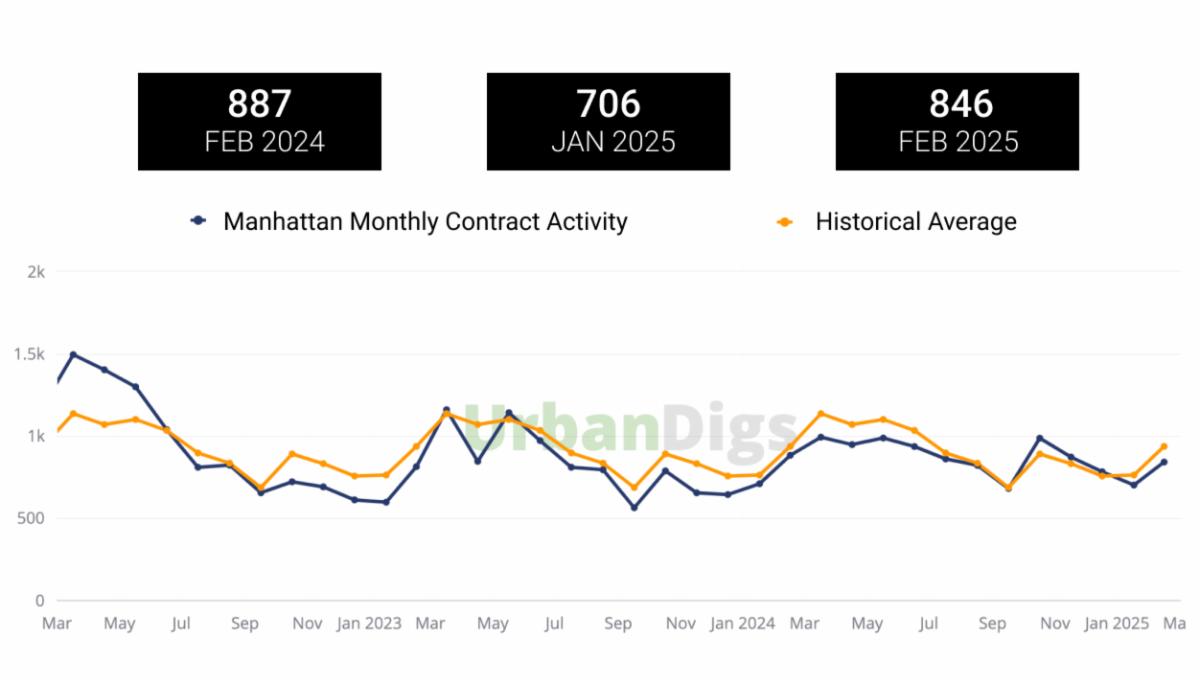
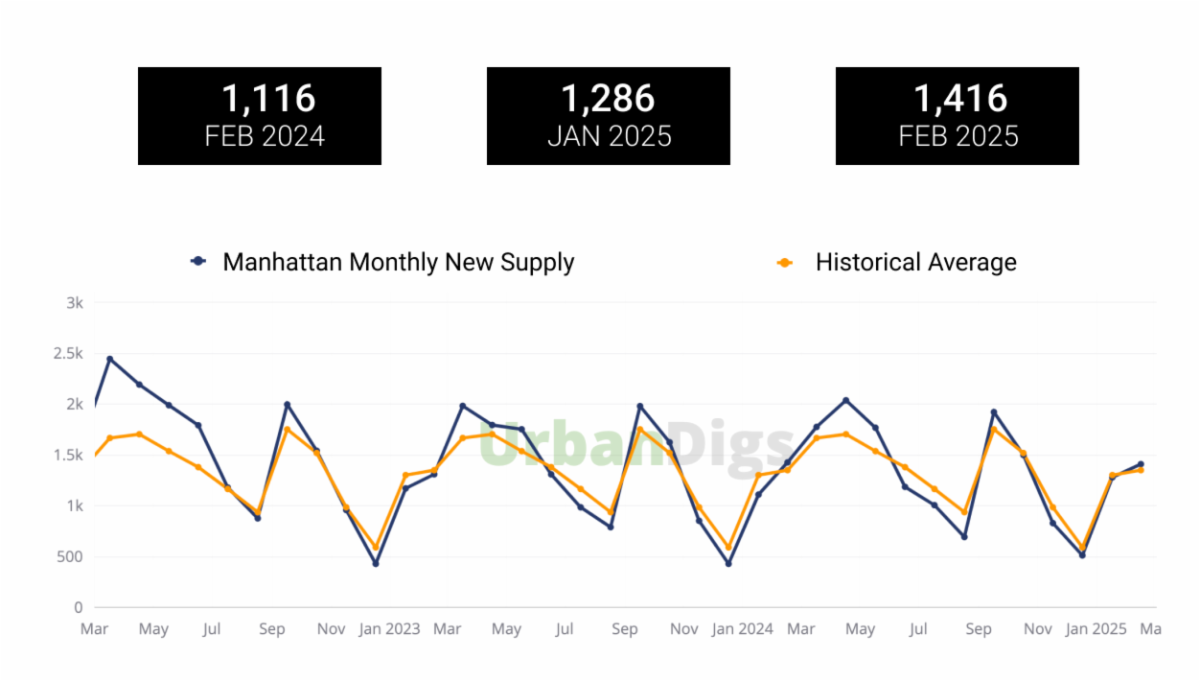
February 2025 marked the first increase in the number of monthly signed contracts since last November, suggesting a more robust Spring market ahead and buyers re-focusing now that the holidays have passed, children’s school acceptance letters have (largely) been received, and purchasers are starting to see more potential properties list. While the number of new listings increased in February, supply still feels quite tight. We would generally describe the current environment as a brokered ‘matchmaking’ market in which buyers are specific and deliberate on what they want, and poised to act on properties that fit the bill. While the current average discount between sale and asking price ranges from ~2%-9%, buyer and seller leverage varies by each property’s intersection of price point/location/product-type, and understanding these nuances, alongside effective representation and communication between sellers and buyers, is key to achieving the best possible deal.
The luxury market had a relatively strong February 2025, with 109 contracts signed for properties priced above $4 million, up from both January 2025’s 82 contracts and February 2024’s 98 contracts.
Lastly, we wanted to further examine a ‘topic du jour’ among those of us who live and work in NYC: congestion pricing. The initial 2025 data gathered since the implementation of congestion pricing actually dispels many business owners fears that the tolls would deter individuals from visiting and patronizing the various retail and restaurants below 60th street. In fact, foot traffic has increased by ~5%, mass transit ridership and revenues are up (in additional to the funding generated towards improving the city’s infrastructure), and drivers are experiencing less gridlock and faster commutes.
|