Disability Data for the Workforce | |
|
In our last e-news we described the overall employment situation of people with disabilities seeking employment. This issue will focus on a subset of this population, people with intellectual and developmental disabilities.
*Note - You can download the article below as a Word document. The Word document includes footnotes and has been checked for accessibility.
How many people with I/DD within working age (16 to 80) residing in Nevada, Placer, and Sacramento Counties are employed?
Project LIFE is focused on people with I/DD living in Nevada, Placer and Sacramento counties. For this article, data has been combined from a special study by Cara Welsh, Labor Market Consultant, that uses 2021 American Community Survey 5-Year Estimates with employment and enrollment data from Department of Development Services and the Alta California Regional Center compiled by Lou Vismara M.D. Project LIFE consultant.
To quote DDS: “What the data tells us: The employment rate for people with disabilities is far
lower than the employment rate for people without disabilities; and the employment rate for people with developmental disabilities is far lower than the employment rate for people with all types of disabilities.”
| 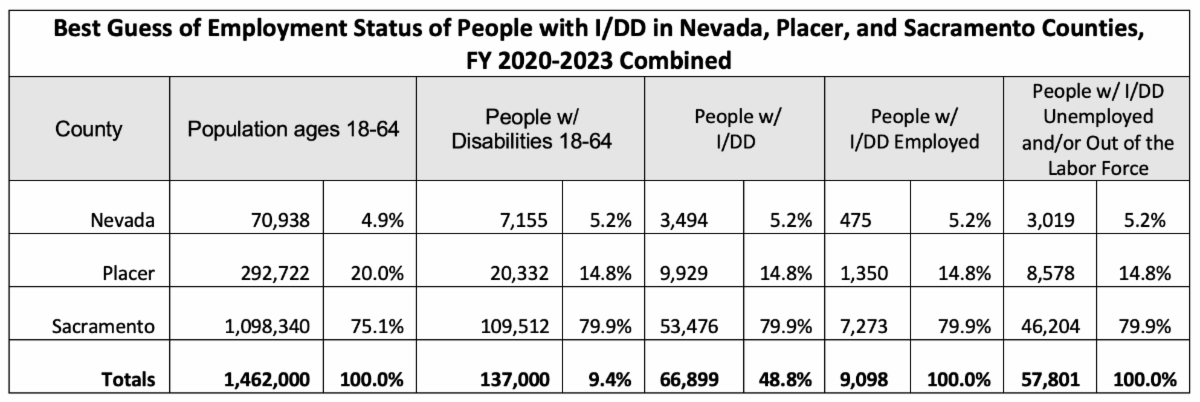 | |
- The total population, ages 18 to 64 in the three counties, is approximately 1,462,000;
- The total population of people, with disabilities, ages 18 to 64, is approximately 137,000 or 9.4% of the total;
- Of this amount, approximately 66,900 (49% of disabled totals & 4.6% of total population) are people with some type of “cognitive difficulty”.
Of the remaining 57,800 it is not clear:
- who are without work, are able to work, and seeking work (in the labor force) but are unemployed;
- who can work, but don’t want to work, or
- who want to work but are not able to work for a variety of reasons.
What is the nature of the employment of people with I/DD in Nevada, Placer, and Sacramento Counties?
2,764 ACRC consumers of 11,515 are working are working a range of less than 10 hours a week to more than 40 hours a week (based on a (5-year estimate from 2020 data).
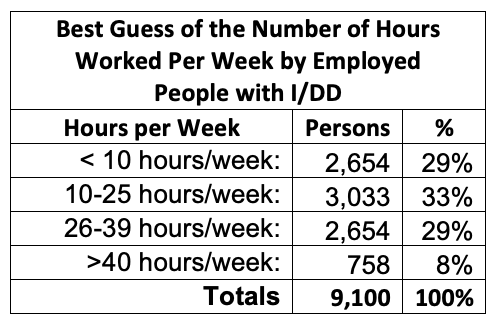
Using the percentages of hours worked from this group and applying it to the 9,100 people working in the three counties we come up with the following guesstimate:
| |
|
Note that of the 9,100 people working, 8% are working full time or more and 62% are working less than 25 hours a week.
From this information, there no real way to assess the degree to which the individuals involved are working to their maximum capability. We’re also unable to assess to what degree CIE services are improving the ability to work more hours a week; to what degree people are satisfied with the number of hours they work?
How Much do People with I/DD Earn?
When it comes to wage reimbursement, the figures are disappointing. As with hours worked per week, this information has to be inferred for the 9,100 workers because there is no direct information. Using the ACRC consumer data provided by EDD we find:
| |
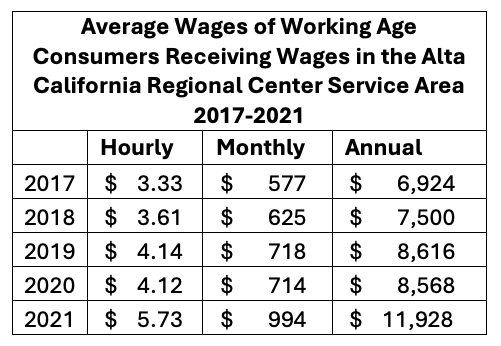 | |
* Notes on Employment Data: 1) Working age is defined as ages 16-64. 2) EDD data reflects the average monthly wages and average number of consumers reported for the purpose of unemployment insurance. It excludes certain individuals such as contractors.
The reason for the lower wages:
- Since 1938, California employers have been able to apply for a certificate that has allowed them to pay employees with disabilities less than the federal minimum wage and
- People with disabilities who are in “sheltered workshops” can be paid based upon a variety of reimbursement methods (piecemeal, per diem that does guarantee a minimum wage some of which results in pennies).
Under the current system, there are "Sheltered" disability programs, where people can be paid between $3 to $14 per hour depending on their speed.
In 2021, California passed legislation (SB639) intended to eliminate these exemptions and to pay every employee a minimum wage. Starting in 2025, California will ban the practice of paying subminimum wages to individuals with intellectual or developmental disabilities. Interested in learning more about the progress of implementing SB639? Visit https://scdd.ca.gov/sb639-home/
In What Occupations Do People with Disabilities Work?
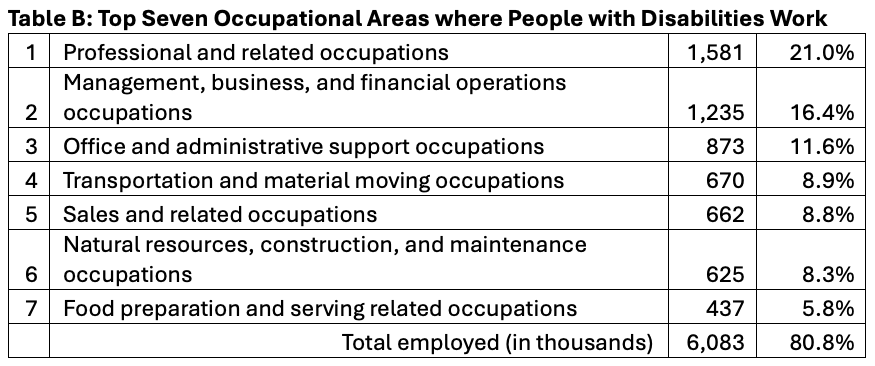
The latest Bureau of Labor Statistics Report includes a section on where people with disabilities work. “In 2023, people with a disability were more likely to work in service occupations than were those with no disability (19.4 percent compared with 16.1 percent). Workers with a disability were more likely than those with no disability to work in production, transportation, and material moving occupations (14.5 percent compared with 12.3 percent).
| 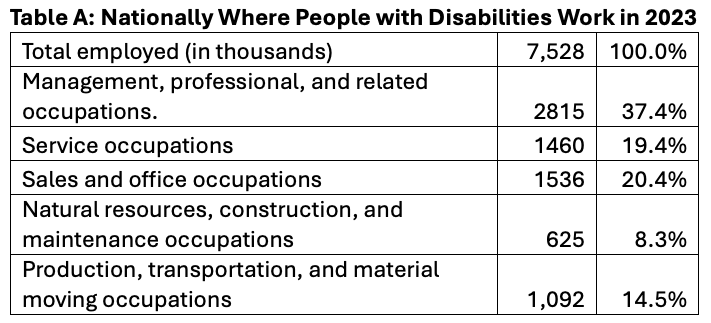 | |
Table B shows the top seven occupational areas that people with disabilities work accounting for 81 percent of the employment. White collar jobs account for 58 percent of the positions that people with disabilities work. | |
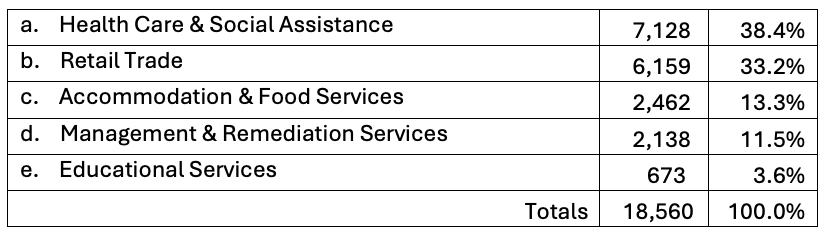
An EDD state report on California’s twenty-one Regional Center consumers who are employed indicates that they are working in the following industries: | |
|
Note that Food Service is twice as high in California that nationally (13.3% vs 5.8%). Also, Management & Remediation Services is 11.5 percent state vs 57.8 percent nationally (management, professional, & related and Sales and Office occupations).
Unfortunately, disaggregated data for the counties of Nevada, Placer and Sacramento for the above categories is not available. Data collection by individual companies concerning persons with disabilities in their workforce isn't often readily available.
In our next newsletter, we'll conclude this series on employment data with our comments, Findings, and Reflections. Stay tuned.
| |
Disability: IN recently released a report that indicates that 65% of Fortune 500 companies include workforce disability inclusion in their annual sustainability reports. Only 10%, however, provide quantitative workforce disclosures for employees with disabilities. The latest report, "On the Verge: Disability & Sustainability Reporting," analyzes voluntary sustainability reporting practices among U.S. Fortune 500 companies and showcases how leading companies have integrated disability into their corporate materiality matrices. | |
Check out LIFE Project's Events List to discover events relevant to you. Unless noted, events are not sponsored or endorsed by the LIFE Project.
If you have an event that you'd like featured on the list and in our newsletter, email us at info@lifeprojectinfo.org. | |
|
Sierra College and Alta California Regional Center (ACRC) have partnered to work on the Learning Independence for Future Employment (LIFE) Project through a California Department of Developmental Services Employment Grant. LIFE Project is a Service Model Transformation Project to develop a new and expanded role for the California Community Colleges (CCCs) in the preparation, placement, and the implementation of innovative strategies and practices to increase Competitive Integrated Employment (CIE) for individuals with intellectual and developmental disabilities and to provide employment and training information resources to employers, people with disabilities, and others working with people with disabilities.
If you have any newsletter topic requests or feedback, email us at info@lifeprojectinfo.org
To ensure that you continue to receive this newsletter, subscribe.
| | | | |