July 2022 Release

Hello Laura, The latest RPS House Price Index release for July is here with our downloadable file and some charts for you to explore.


Down from it's peak of 19.3% YOY growth in May, you'll see that the RPS Canadian Composite House Price Median of $881,951 is 17.8% higher than previous 12 months. 

House Price Index Trend

Jan 2014 to July 2022


The complimentary RPS House Price Index data set allows you to compare house price trends across Canada. This is a subset of our comprehensive data set that is available as a subscription service and includes detailed house price data for 3500 geographies and 6 property styles in an easy-to-read, well structured format.

The latest complimentary RPS House Price Index data set is available now.

Download the RPS House Price Index Data

Rate of Change in YOY House Price Growth

Jan 2018 to July 2022


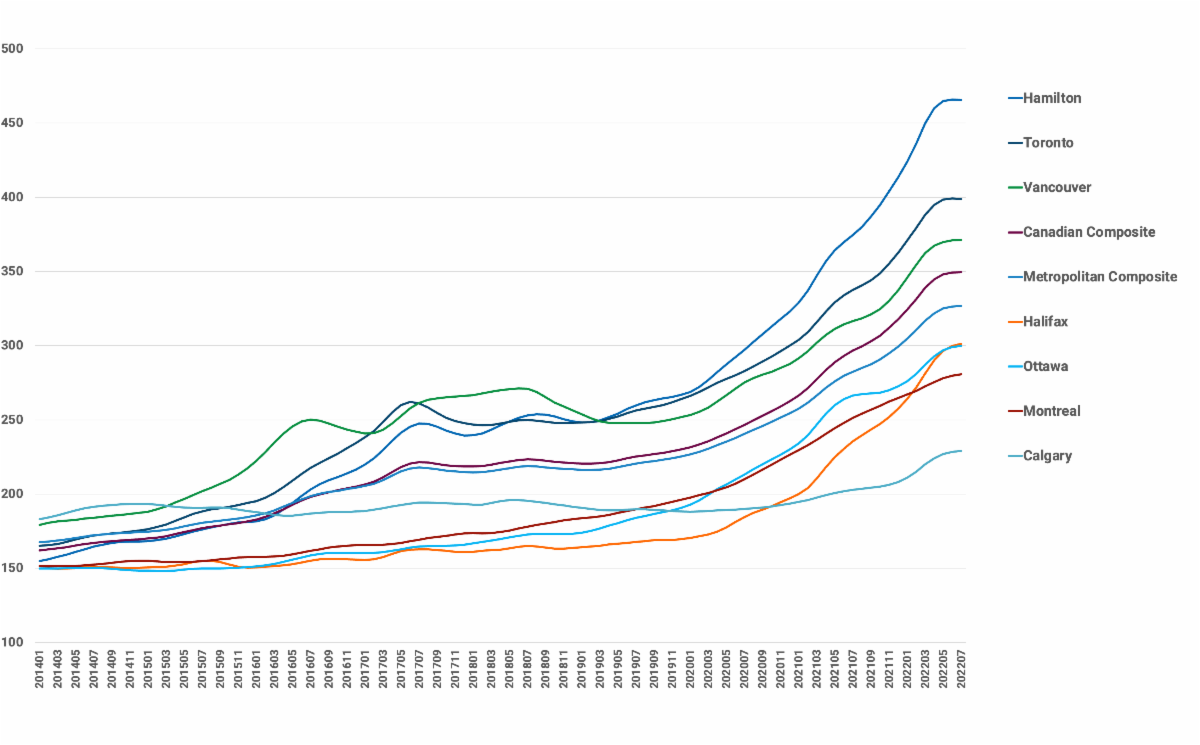
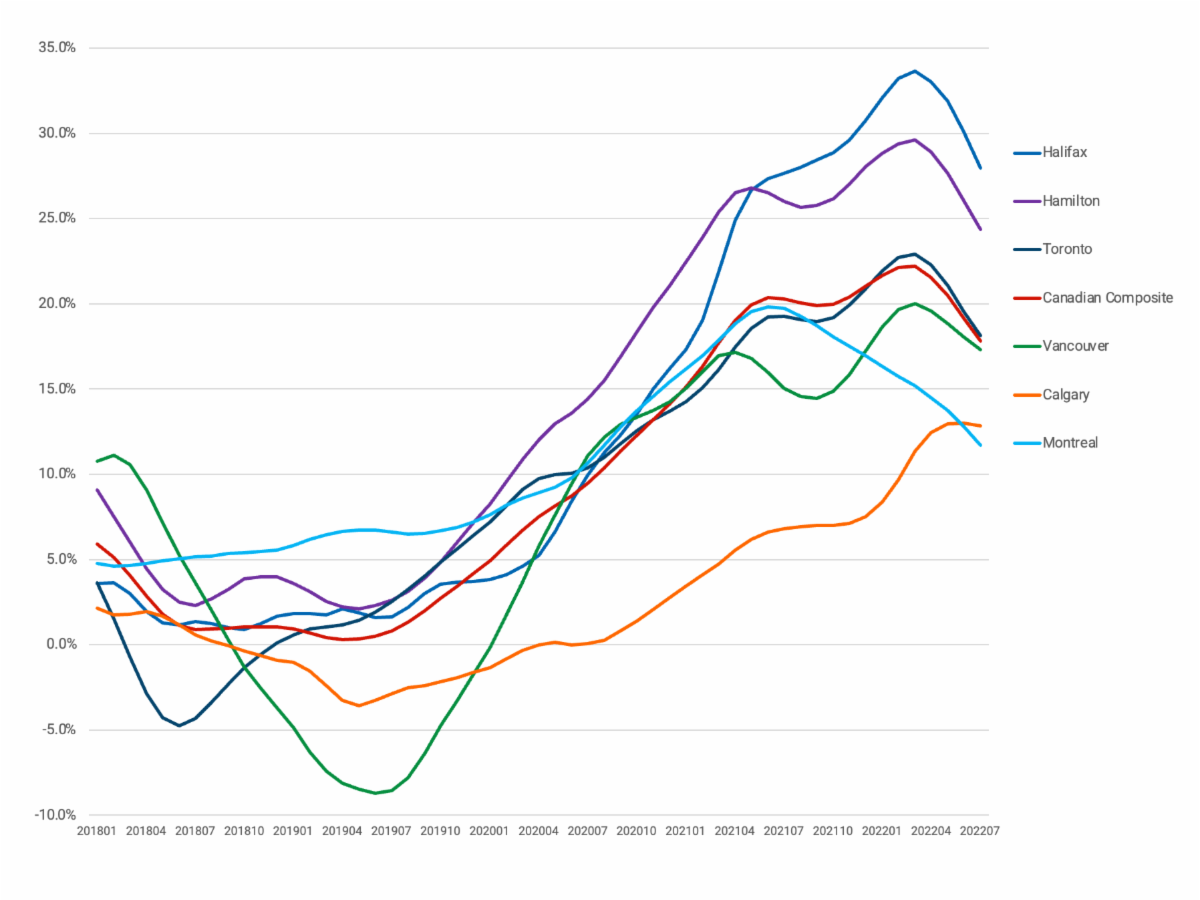
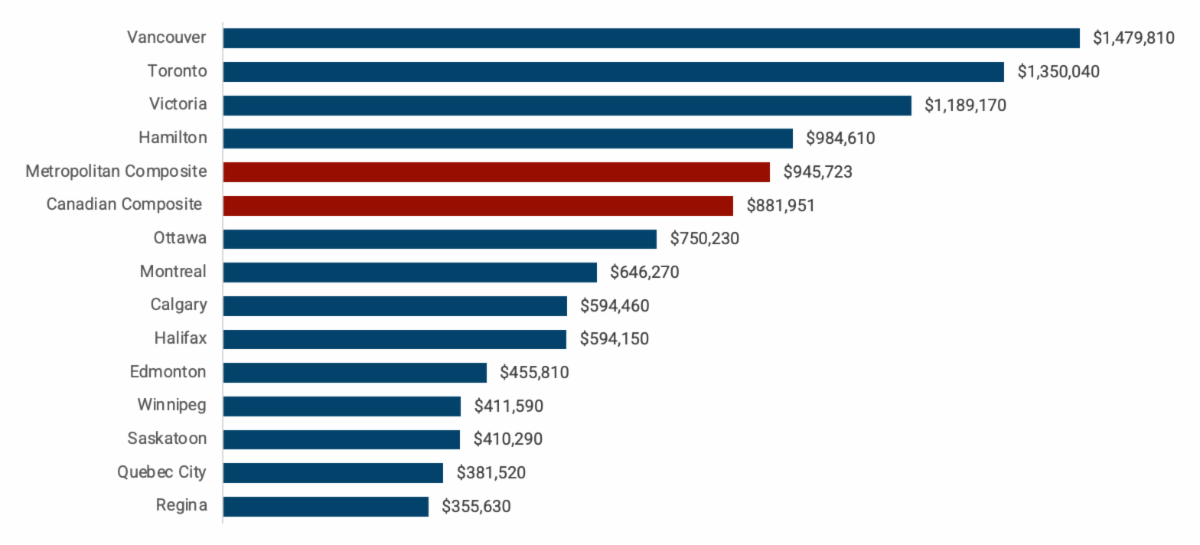
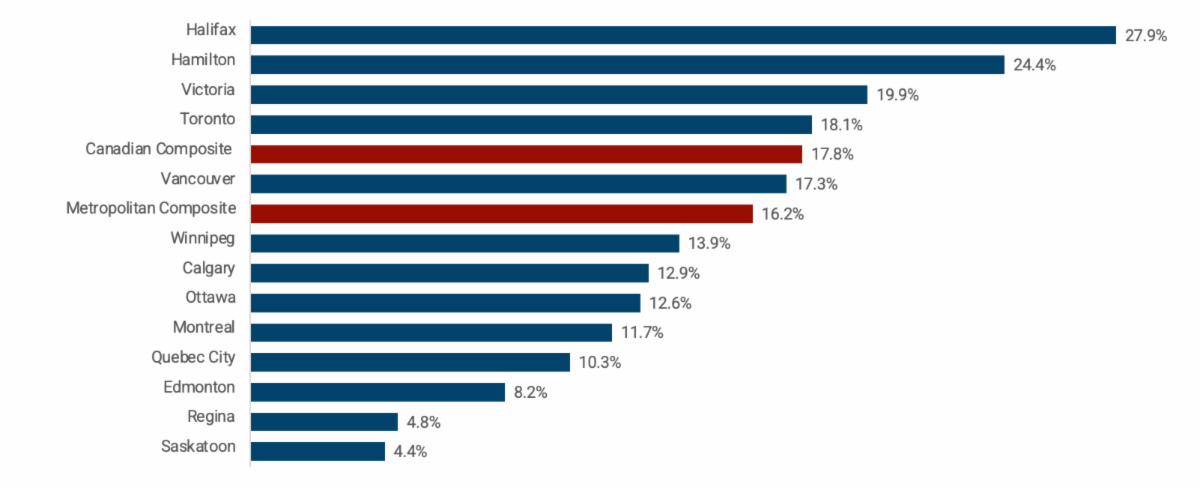
Want to see the trends? In the charts provided, you can view the house prices indices for 13 major cities in Canada, as well as two measures of national house price growth:


Metropolitan Composite is the weighted average of 13 major Census Metropolitan Areas (CMA) that represent Canada. This is a common method of measuring house price values in Canada.


Canadian Composite is the median average of all 1500 Forward Sortation Areas (FSA) across Canada including all major metro markets, all medium and small-sized cities, towns and rural regions. This is the most robust method of measuring and monitoring house prices in Canada. 

Learn more about the RPS House Price Index

Aggregate House Price Values

July 2022


Why do house price indexes differ? Each provider may have different data sources, include different geographic areas, define property styles differently or use a different methodology. As a result, although the composite value or indexes may vary, the overall trends are consistent.

Year-over-Year House Price Growth

June 2021 to July 2022

Want more data like this? The complete RPS House Price Index dataset is available and includes national and provincial trends - and local level data for over 2,500 geographies, 1,000 cities and towns, and 1,500 FSA-level neighbourhoods from coast to coast.


To learn more about the RPS House Price Index, what makes it the most robust and accurate HPI in Canada, or access to the full dataset, talk to you RPS Account Executive.


Call: 1-877-658-8258

Email: sales@rpsrealsolutions.com

Read the‬ Product Page
View the interactive chart

Copyright © 2022 RPS Real Property Solutions Inc. All rights reserved. The information provided in the charts are is for illustrative and general information purposes only and is not intended to provide specific financial or other advice and should not be relied upon in that regard. Any copying, reproduction, distribution, or other use of the charts or the data is prohibited. RPS makes no express or implied warranties or representations with respect to the information contained in the RPS Chart of the Week. RPS will not be liable for any losses or damages arising from any errors or omissions in any information or results, or any action or decision you make in reliance on any information in the charts.