|
|
Dear Reader,
We are pleased to share the first 2026 edition of the Sovereign ESG Newsletter, as we closed the first quarter of the year, and we would like to thank you for your continued interest in and engagement with the Sovereign ESG Data Portal.
This first quarter has already brought important milestones. We are proud to share that the Republic of Côte d’Ivoire’s inaugural USD 505 million Sustainability-Linked Loan guaranteed by the World Bank Group received two distinctions in Environmental Finance’s Sustainable Debt Awards 2026: Award for Innovation - Loan Structure (EMEA) and Sustainability-Linked Loan of the Year - Sovereigns/SSAs - and was also recognized as DFI and IFI Deal of the Year at the GBM Awards: Africa 2026.
In this issue, jobs and inclusive growth take center stage. With job creation now a core priority for the World Bank Group’s agenda, this quarter’s Indicator Spotlight and Tips & Tricks sections explore how better data and sharper evidence can strengthen the evidence base for jobs, supporting more informed analysis, stronger policy dialogue, and more effective financing.
We also reflect on key milestones from 2025 and look ahead to 2026. Among the year’s highlights was the launch of the Feasibility and Ambitiousness (FAB) Dashboard, a tool that allows users to conduct data-driven assessments of targets for performance-based and sustainability-linked financing. We are proud that this tool has already supported and continues to support several World Bank engagements, including five sustainability-linked financing frameworks, one WB Country Partnership Framework (CPF), a Country Climate and Development Report (CCDR), and policy research more broadly.
Finally, we turn to the latest Data and Stories, featuring a new story on the revised real wealth measure in Changing Wealth of Nations 2024, offering a fresh look beyond GDP to track long-term prosperity. We also introduce a new product note on Performance-Based Financing, which explores how credible, data-driven reform targets can be linked to financing to support private investment, growth, and quality job creation. We close with recent data updates, including two new job-related indicators that expand the core ESG framework and strengthen the Portal’s coverage of employment and youth inclusion, in line with the World Bank Group’s growing focus on jobs.
As always, we hope this content supports your work and sparks new ideas.
Sincerely yours,
Sovereign ESG Data Portal team
|
Spotlight: Côte d’Ivoire’s Sustainability-Linked Loan Earns International Recognition in 2026 Awards |
| |
We are proud to share that Côte d’Ivoire’s inaugural $505 million sustainability-linked loan, guaranteed by the World Bank Group, received two distinctions at the Environmental Finance Sustainable Debt Awards 2026: Award for Innovation – Loan Structure (EMEA) and Sustainability-Linked Loan of the Year – Sovereigns/SSAs. The transaction was also recognized at the GBM Awards: Africa 2026, where it was named DFI and IFI Deal of the Year. Together, these awards recognize the transaction’s pioneering design, including a first-of-its-kind guarantee structure in Africa, a strong policy anchor in Côte d’Ivoire’s Sustainability-Linked Finance Framework, and its ambitious and credible sustainability targets. All these features position the operation as a strong example of how sovereign financing can better align with climate and development priorities.
|
| ESG Data Portal Tips & Tricks | | |
Income adjustment tool
Uncovering true ESG performances
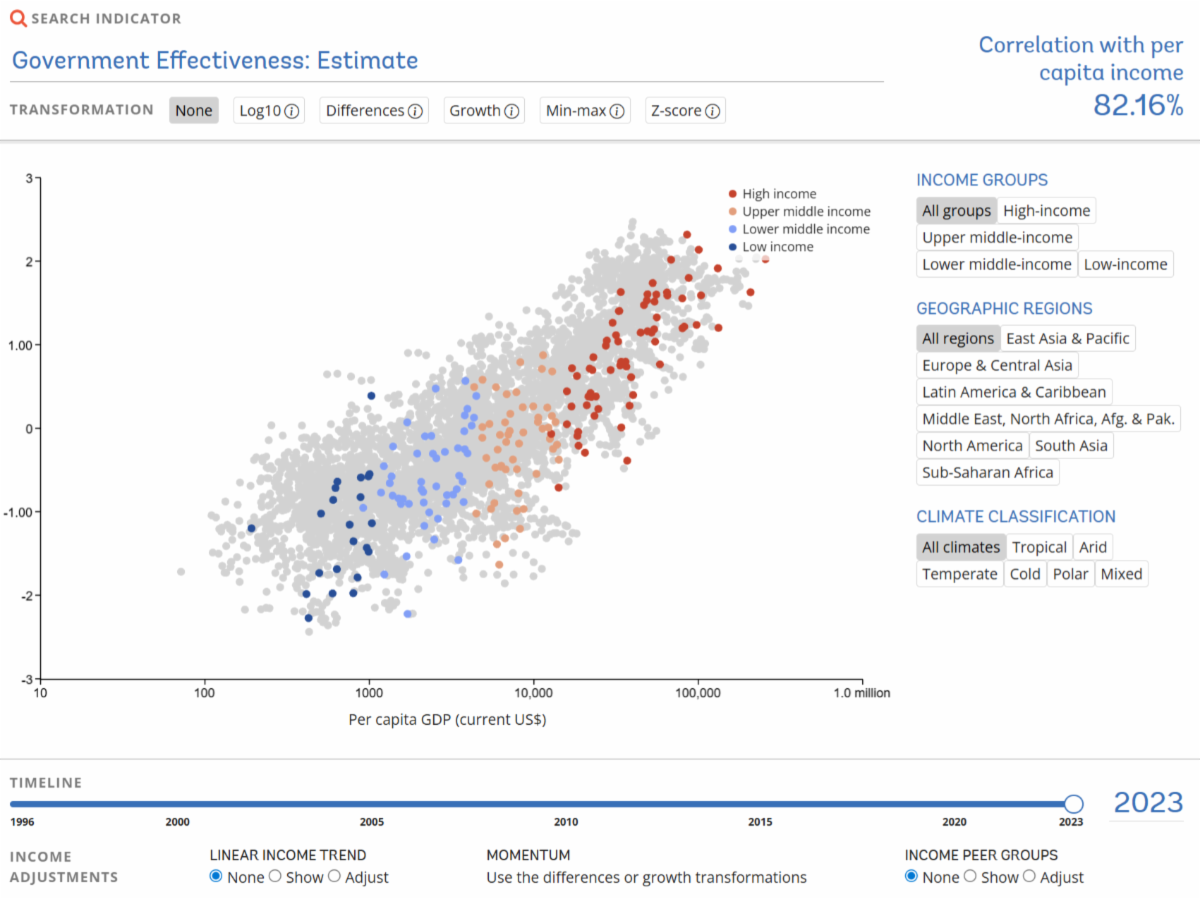
On most sovereign ESG indicators wealthy countries score high, while low- and middle-income economies appear weak. This so-called ingrained income bias can divert the flow of sustainable finance towards richer countries and away from poorer countries where investments may have the highest impact.
| |
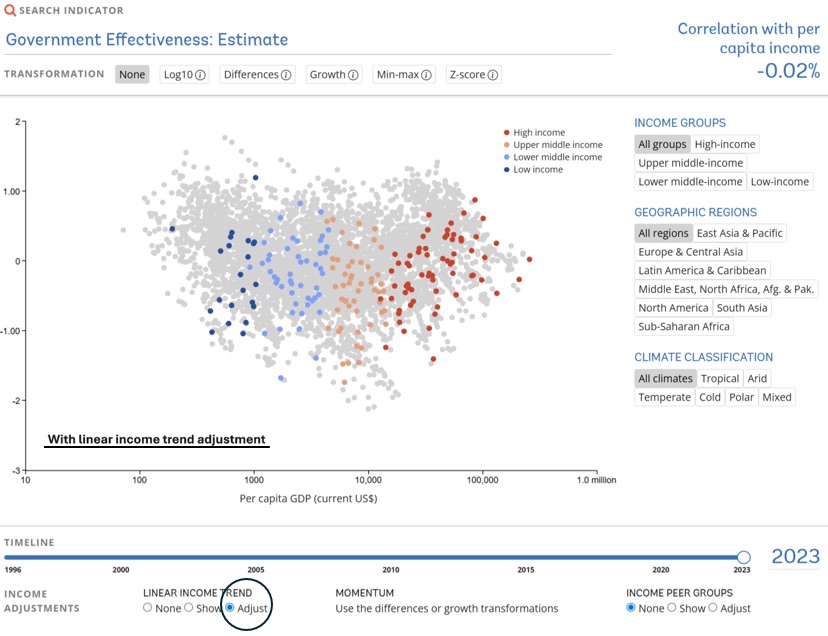
The income adjustment tool helps you cut through this bias by spotlighting countries that, relative to their income level, show exceptional ESG performance.
One way to do so is by applying a linear income trend adjustment to eliminate the correlation with income in all cases: simply select “adjust” under the linear income trend section in the tool. Of course, no single adjustment fits all. The linear assumption works best when the relationship between ESG scores and income is relatively steady. In cases where the dynamics are more complex, you may want to look at the “Income Peer Groups” adjustment which can better capture non-linear trends.
| | |
The share of youth not in education, employment, or training (NEET), total (% of youth population) (modeled ILO estimate)
A sharper lens on youth opportunity and inclusion
In this issue, we spotlight a new indicator that has been added to the Portal with the latest date update: The share of youth not in education, employment, or training (NEET), total (% of youth population) (modeled ILO estimate) —a concise indicator that captures how effectively countries are supporting young people (ages 15–24) to transition into the labor market.
From a policy perspective, the youth NEET rate is often more informative than the youth unemployment rate because it captures all young people who are out of work and not building skills, including those who are not actively job-searching (discouraged workers, particularly women), who are excluded from the unemployment rate by definition. The NEET rate can fall through higher employment or higher education/training participation (both positive developments), whereas the unemployment rate can rise even when education participation increases. Also, the NEET indicator is a more reliable proxy for vulnerability and exclusion than the unemployment indicator, especially where limited social protection means the poorest youth cannot afford a prolonged job search1.
In many low and lower-middle-income countries, a high youth NEET rate often reflects weak school-to-work transitions, including too few quality jobs to absorb new entrants, skills gaps and mismatches, and practical barriers that keep young people from staying in education or accessing training (cost, distance, entry requirements, and limited capacity/availability). These constraints are frequently reinforced by high informality and low-quality employment, which can push youth in and out of short-term or vulnerable work rather than into stable pathways.
A critical lens in this context is gender, for which a specific indicator can be examined: Share of youth not in education, employment or training, female (% of female youth population) (modeled ILO estimate). The NEET rates for young women are often higher, reflecting unequal care burdens and other constraints on mobility or labor-market participation. Disaggregating by sex can therefore help identify where policy action - such as childcare, safe transport, or targeted activation programs - could unlock significant gains.
| | |
Focus box: Finding credible targets for jobs-related indicators using the FAB dashboard
| | |
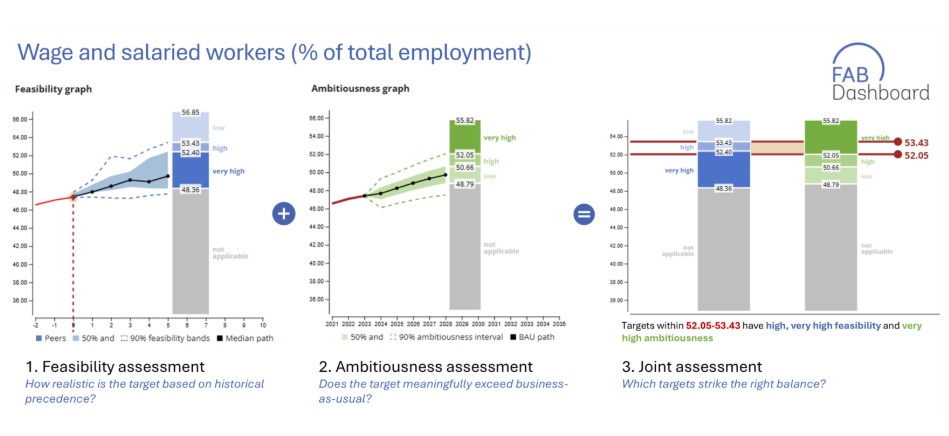
With the addition of two new jobs-related indicators to the Portal, the Feasibility and Ambitiousness (FAB) Dashboard can now be applied to target-setting in the jobs and inclusive growth space. For example, it can be used to assess and calibrate targets for increasing the share of wage and salaried workers (% of total employment). Using the FAB Dashboard, you can design credible, evidence-based targets for performance-linked frameworks. The process begins with a feasibility assessment, which asks how realistic an increase in the share of wage and salaried employment is for a given country. By selecting comparable peers, users can identify benchmarkable countries and derive feasibility ranges grounded in historical precedence. Feasibility is complemented by an ambitiousness assessment, which extrapolates recent trends to establish a business-as-usual trajectory—showing how the indicator is likely to evolve if current dynamics persist. Bringing these two dimensions together yields a joint assessment, providing decision-relevant metrics and highlighting the trade-offs between feasibility and ambition that matter most for robust target-setting.
| | Looking Back at 2025 & What to Expect in 2026 | | |
2025 KEY MILESTONES
-
FAB Dashboard went live, enabling users to assess targets for performance-based and sustainability-linked financing by balancing feasibility and ambitiousness.
-
Supporting Côte d’Ivoire’s Sustainability-Linked Finance Framework, which anchored measurable targets for renewable energy production and forestry and contributed to the issuance of the country’s $505 million inaugural sustainability-linked loan, backed by the World Bank Group’s Guarantee Platform.
-
Strengthening the evidence base for performance-linked forest finance, through the Congo Basin Policy Research Working Paper, which provides empirical foundations for linking forest protection outcomes to financing structures.
-
Launching the CCDR Stories Series, designed to help operationalize Country Climate and Development Report recommendations through a sustainable finance lens—highlighting policy priorities, relevant ESG indicators for tracking progress, and implementation pathways.
| |  | |
2026 PRIORITIES FOR DELIVERY AND SCALE
- Workshops and training for World Bank operational teams and counterparts to build practical capability in using the FAB Dashboard.
- Integrating FAB earlier across the project lifecycle, helping teams from country dialogue to KPI selection, target calibration, and monitoring.
- Continued Portal improvements, with ongoing enhancements to data coverage, usability, and decision-ready features.
-
Expand and enhance the Portal's thematic coverage selectively, where relevant and material, across priority sectors aligned with the World Bank’s evolving agenda.
.
| | | |
The ESG Data Portal team will continue supporting country operations and engagements, helping teams translate ESG data into practical country dialogue and financing design.
If you are planning a mission, diagnostic, research effort, or training where the FAB Dashboard could be embedded, we would welcome collaboration. Please get in touch with us at esgdata@worldbank.org.
| |
Measuring what matters: introducing CWON 2024’s revised Real Wealth Measure (January 2026)
This two-part blog series unpacks a major innovation in Changing Wealth of Nations (CWON) 2024: a revised real wealth measure that goes beyond GDP to track whether countries are building—or running down—the assets that sustain long-term prosperity. Part 1 explains the methodology and why it matters; Part 2 brings it to life with real-world application, focusing on natural capital decline in Sub-Saharan Africa.
Read Here - Part 1
Read Here - Part 2
| |
|
Product Note: Mobilizing Private Capital through FAB-anchored Performance-Based Financing
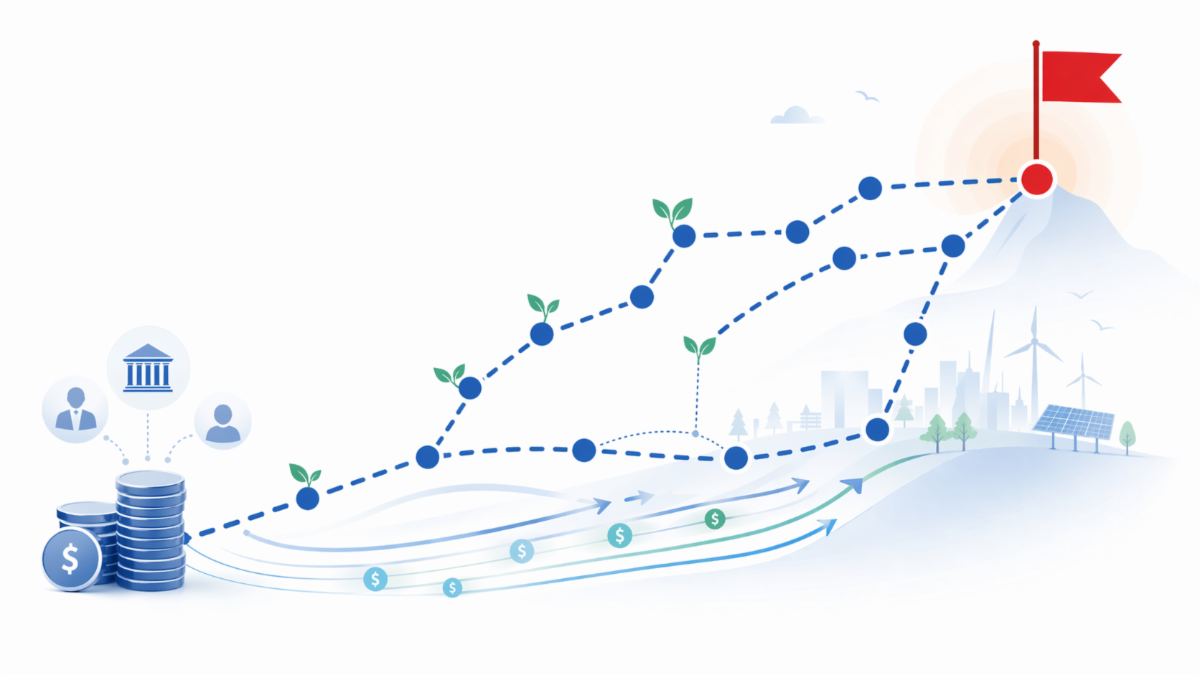
This product note provides an overview of how Performance-Based Financing (PBF), anchored in the Feasibility and Ambitiousness (FAB) methodology, can help countries link sovereign financing to credible, data-driven reform outcomes that unlock private investment in job-rich sectors and advance private-sector-led growth and quality job creation, especially for youth and women.
Read Here
| |
|
Data update: January 2026
The latest update delivers a broad refresh of the data set, with close to 60 indicators across the environmental, social, and governance pillars, extending time series for core measures and improving overall data timeliness. It also expands the core ESG framework with two new employment-related indicators; wage and salaried workers (% of total employment) and youth not in education, employment, or training (NEET) - aligned with the World Bank Group Scorecard to strengthen coverage of jobs and youth inclusion.
Read Here
| |
| | | |