|
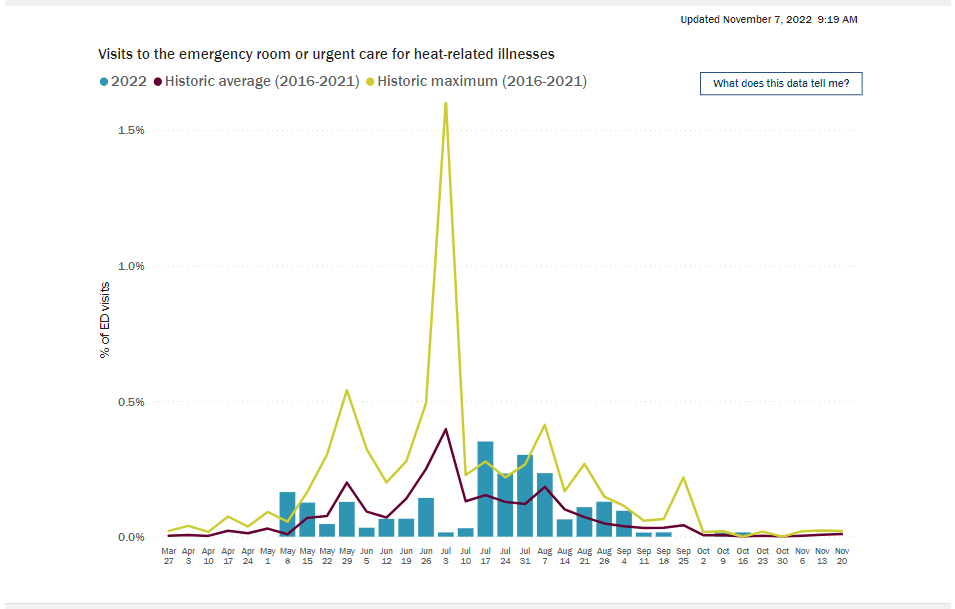
The report shows the weekly percentage of emergency room visits for heat-related illness for the current year, the historic average percentage of visits due to heat at that time of year, and the historic maximum percentage of heat-related illness visits that has been recorded at that time of year. It is updated every Monday during the warm season (May through September).
The Tracking Program is working on a similar report, but based on the weekly percentage of emergency room visits for cold-related illness. This report will also include the historic average percentage of cold-related illness visits and the lowest temperature recorded in the past week. It will be updated every Monday throughout the cold season (October through April). Stay tuned!
|