Expect more vehicle traffic this year
Vehicle tracking data shows a continued upward trend in traffic entering the Town of Banff in 2025, building on 2024’s record-setting year for vehicle counts at the town’s entrances.
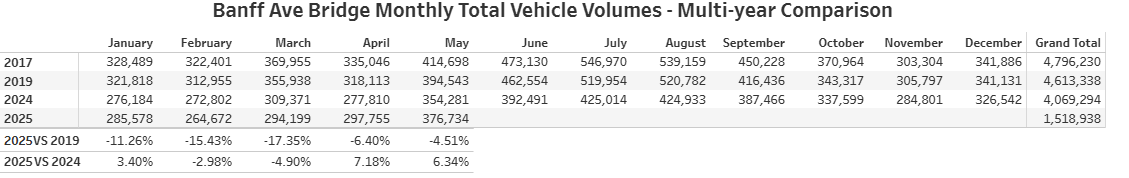
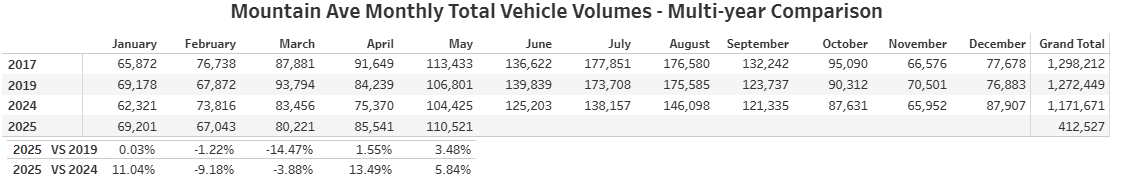
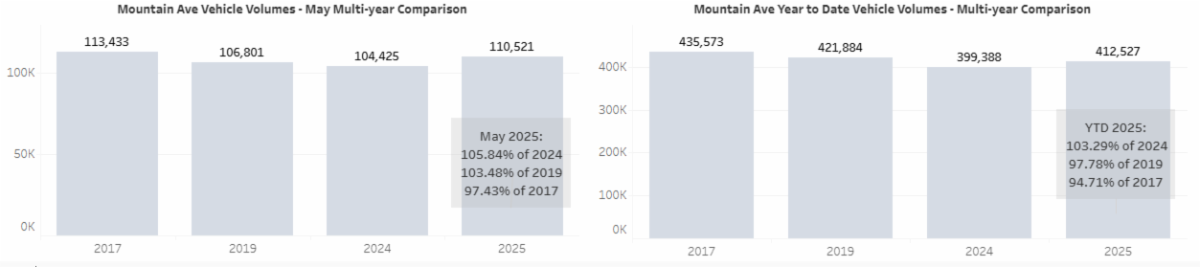
For the Victoria Day long weekend (May long weekend), total vehicles entering Banff increased by 2% compared to 2024, and by 13% compared to pre-pandemic 2019. Vehicle counts crossing the Bow River bridge were up 6% over the same weekend last year, while traffic on Mountain Avenue increased by 10% compared to the 2024 Victoria Day long weekend.
For the month of May, vehicle counts at the entrances were 11% higher than in May 2024. Year-to-date, as of the end of May, vehicles counted at the entrances were up 9% over the same period last year.
Factors that suggest there will be an increase in traffic this year include:
- The strong U.S. dollar is expected to attract more American visitors to Canada.
- Tariffs and trade disputes between Canada and the U.S. are motivating more Canadians to vacation domestically this year, instead of traveling to the U.S.
- The Calgary region saw a 6% population increase in 2024, with more than 100,000 new residents, boosting the pool of potential day-trippers to Banff. The Calgary region has the fastest-growing communities in Canada.
- Recreation area closures during the G7 Leaders’ Summit in Kananaskis in June may divert Albertans to Banff instead.
- A federal campaign promise to make entry into national parks free this year could drive higher visitation. In 2017, the last year with free entry, Banff National Park saw record visitation.
- The absence of the pedestrian zone is expected to affect a proportionate increase in vehicles travelling to the south side, adding to traffic congestion, because Banff Ave. traffic is not detoured past the three main pay parking lots in Banff.
- The absence of the pedestrian zone on Banff Avenue is expected to lead to more vehicles traveling south through town, increasing congestion as traffic is no longer detoured past the three main pay parking lots.
Traffic management measures in Banff
The Town of Banff is not allowed to restrict vehicles from entering the townsite from the main highway entrances or from the Sulphur Mountain area on Mountain Avenue. Only Parks Canada or emergency services can restrict traffic entering the town when congestion could impact emergency access.
Several measures are implemented to help mitigate traffic increases, including:
• Traffic control personnel stationed at key intersections on summer weekends
• Automated traffic signals that override normal cycles to manage backups on primary roads
• Manual monitoring 7 days a week and overrides of key traffic signals to move more vehicles and reduce back ups
• Daily manual monitoring and traffic signal overrides to improve traffic flow and reduce vehicle backups
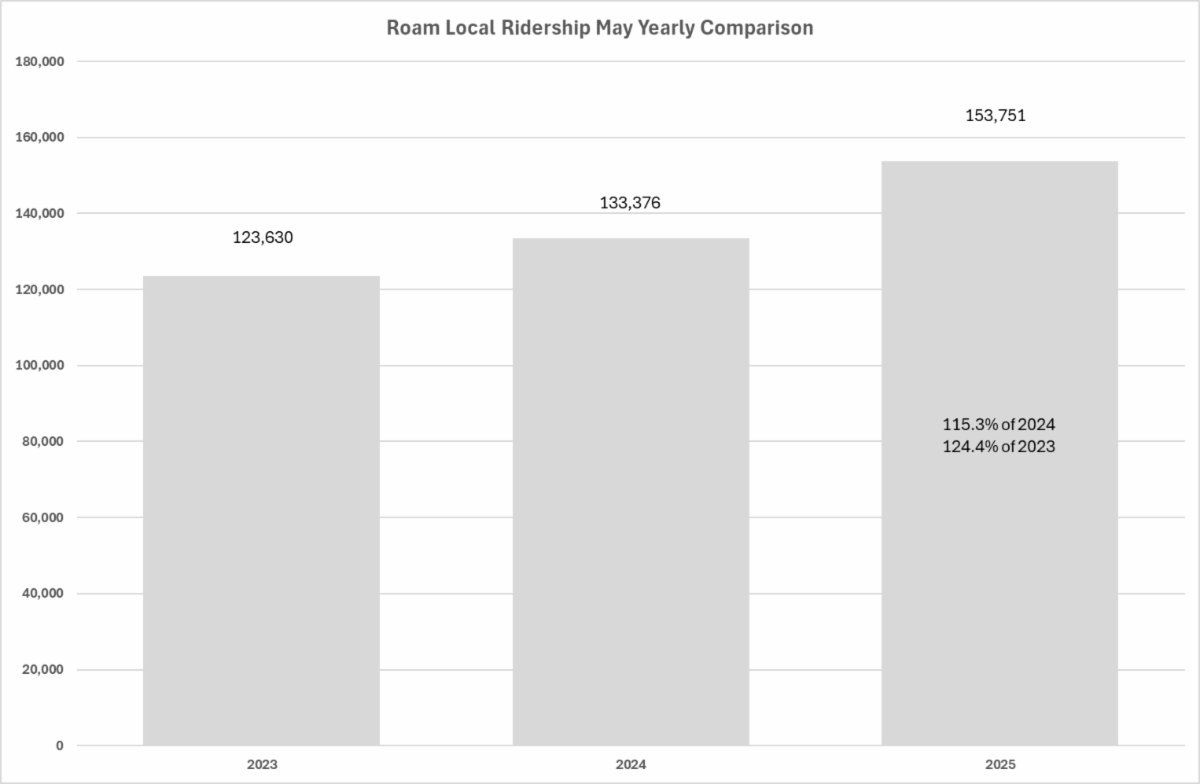
• Nine new buses added to the Roam Transit fleet, with increased frequency and contingency shuttles following full buses to minimize pass-ups
• Additional summer signage to encourage use of parking lots and transit
• Flip signs activated when Parks Canada notifies the Town that Gondola parking is full, discouraging bridge traffic
• Radio and social media campaigns in the Calgary region encouraging day visitors to use mass transit to Banff and take transit or shuttles within the town, or visit in the late afternoon or evening
• Signage and messaging at hotels and campgrounds encouraging guests to leave vehicles parked and use transit
• Increased Visitor Pay Parking rates to $7/hour to promote stall turnover and shorter stays in the downtown core
• Communications to RV renters in BC and Calgary advising against driving into the townsite
• Ongoing improvements to the new Mountain Avenue Express Bus Lane and multi-use trail
May Traffic Data
The Town of Banff Traffic Management Team shares the following vehicle volume comparison charts and graphs as a service to our community. Please note that all volume counts represent two-way traffic. Definitions on terminology in this report are the end of this e-newsletter.
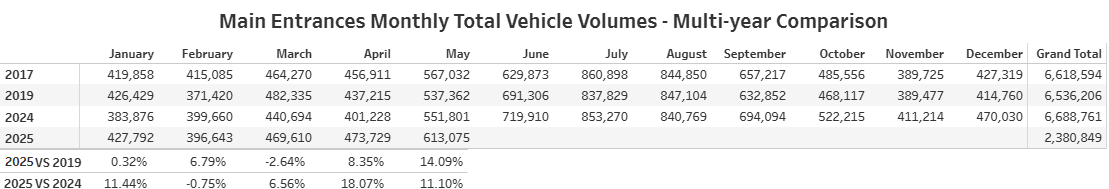
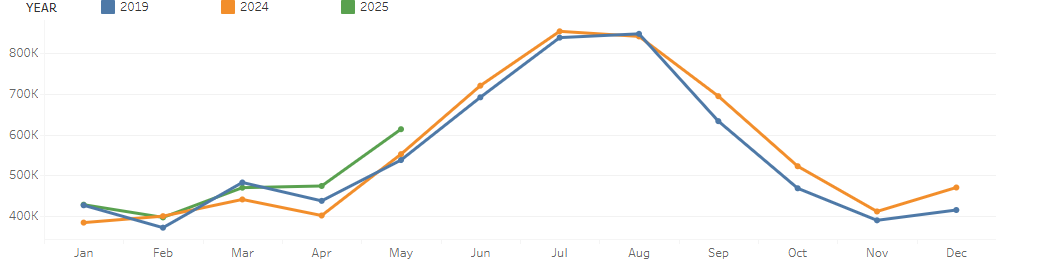
Main Entrances
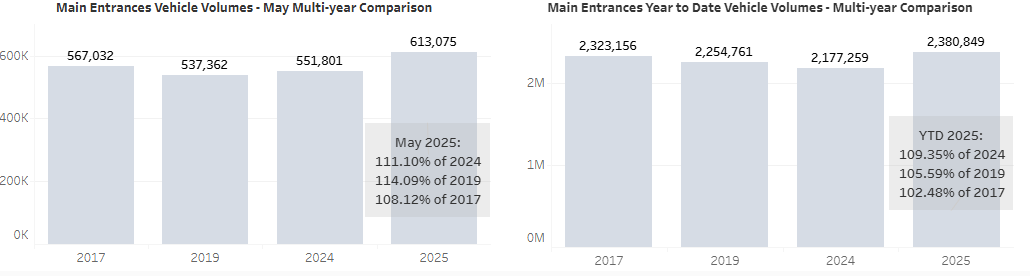
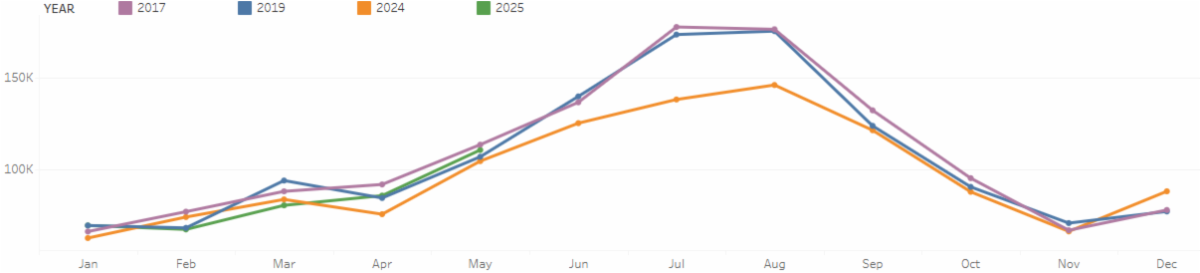
Counters at the two main entrances to town recorded 613,075 vehicles for the month of May 2025, which is an 11.1% increase when compared to May 2024 and a 14% increase when compared to pre-pandemic May 2019.
Year-to-date 2025 vehicle volume is 9.4% higher than the same period in 2024 and is 5.6% greater than the 2019 year-to-date volume.
Weather has an impact on visitation, specially for day visitors driving from the Calgary region.
- The average daily high in May 2025 was 17.2°C, the average daily Low 2.0°C and a total of 34.1mm of precipitation.
- The average daily High in May 2024 was 13.4°C, the average daily Low 0.6°C, and 44.6mm precipitation.
- The average daily High in May 2023 was 20.7°C, the average daily Low 3.4°C, and 31.1mm precipitation.
- The average daily High for May in Banff is 14.3°C, the average daily Low 0.5°C, and average 50.0mm precipitation. Climate normals are computed over a 30-year period to eliminate year-to-year variations.
Source: Environment Canada
|