Greetings!


February homes sales in Metro Vancouver continued the recent slower than average trend with a volume of sales 10% lower than February 2025 and 28.7% below the 10 year seasonal average.


The total home supply in Metro Vancouver in February 2026 is up 6.3% over February 2025 and that is 37% above the 10 year seasonal average.


These Metro Vancouver stats get a lot of press and are distinct from the west side market stats but we usually face similar trends here on the west side.


Westside home sales, when compared to the 10-year averages, are down by 18% for detached homes, down 33% for apartments and down by 8% for townhomes.


Compared to the 10-year average, supply is up 8% for Westside detached homes, while apartment supply is up 23%, and townhomes are up 56%.


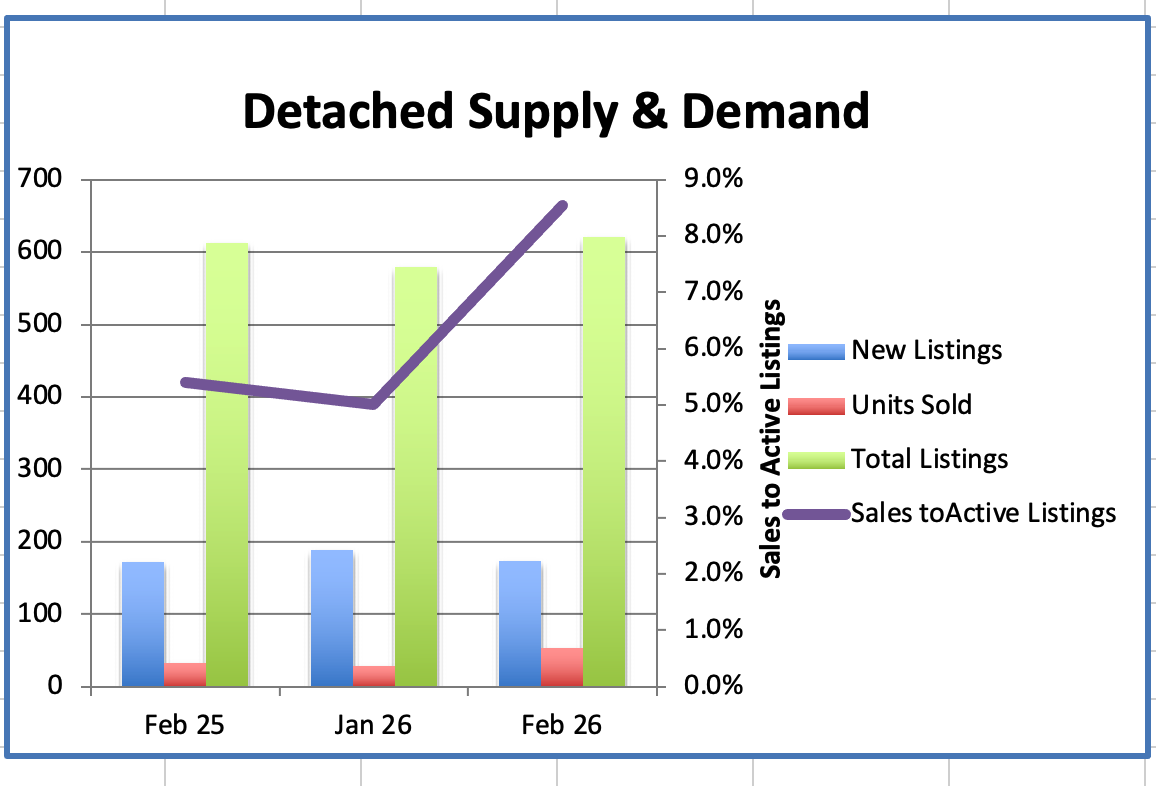
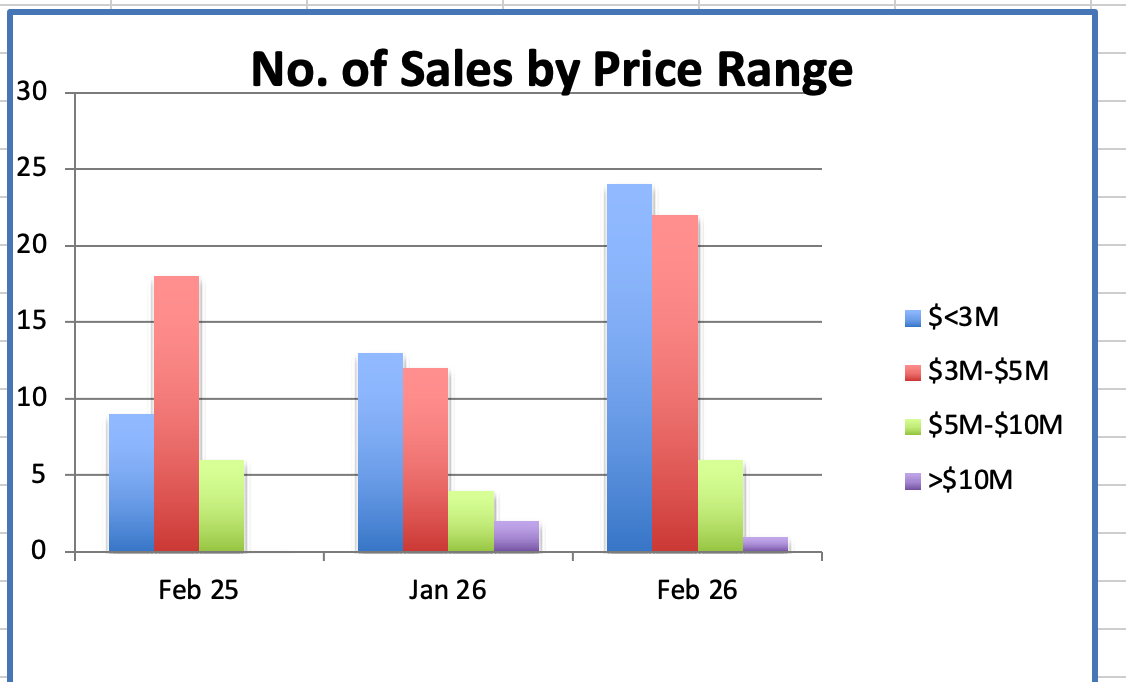
We had 53 Westside Detached home sales in February 2026, up 60%, compared to 33 sales in February 2025.

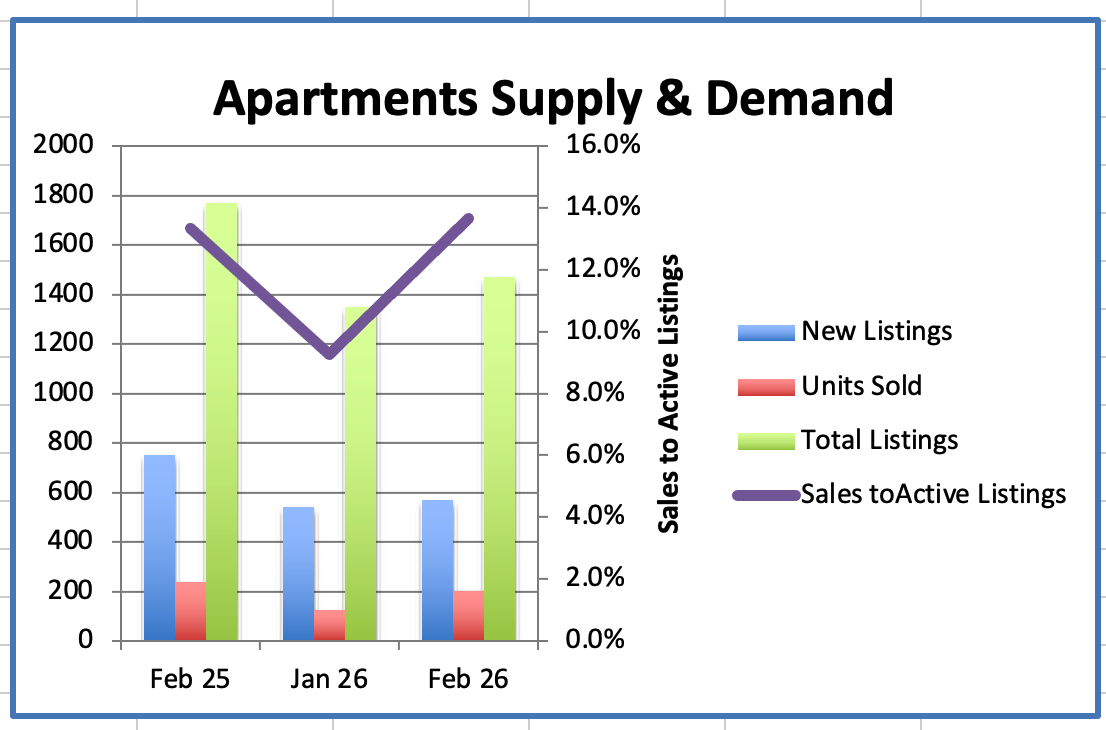
We had 201 Westside Apartment sales in February 2026, down 15% compared to 236 sales in February 2025.

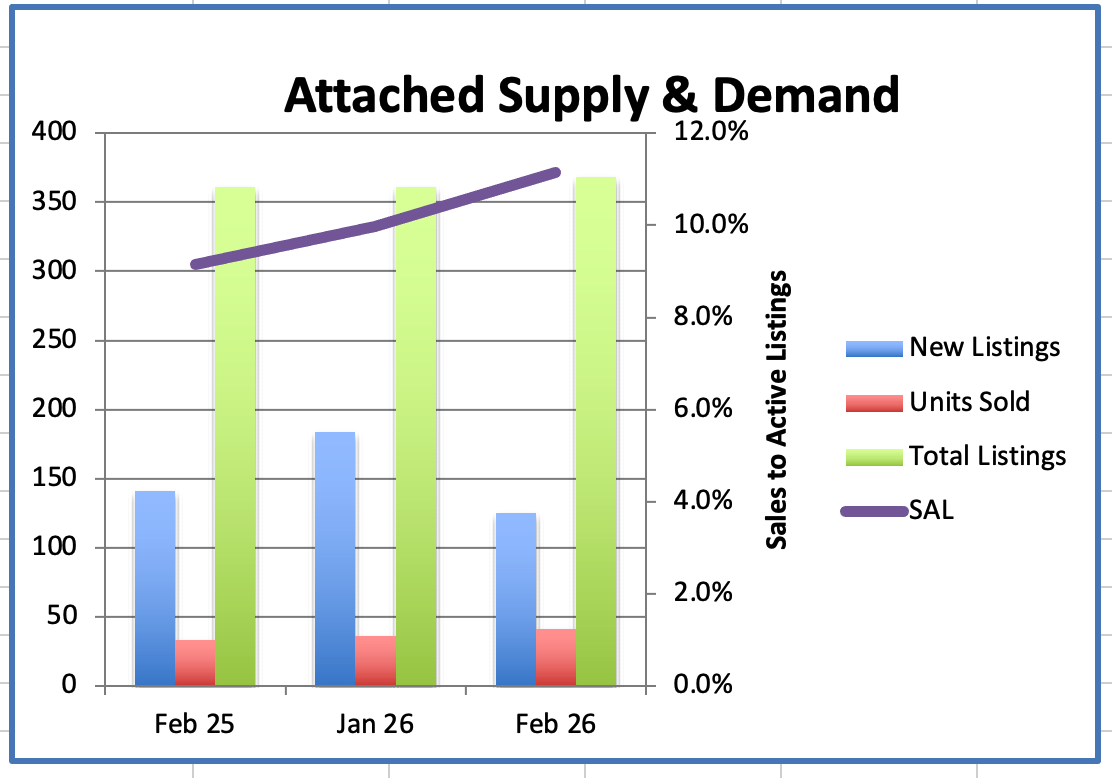
We had 41 Westside Attached home sales in February 2026, up 24% compared to 33 sales in February 2025.


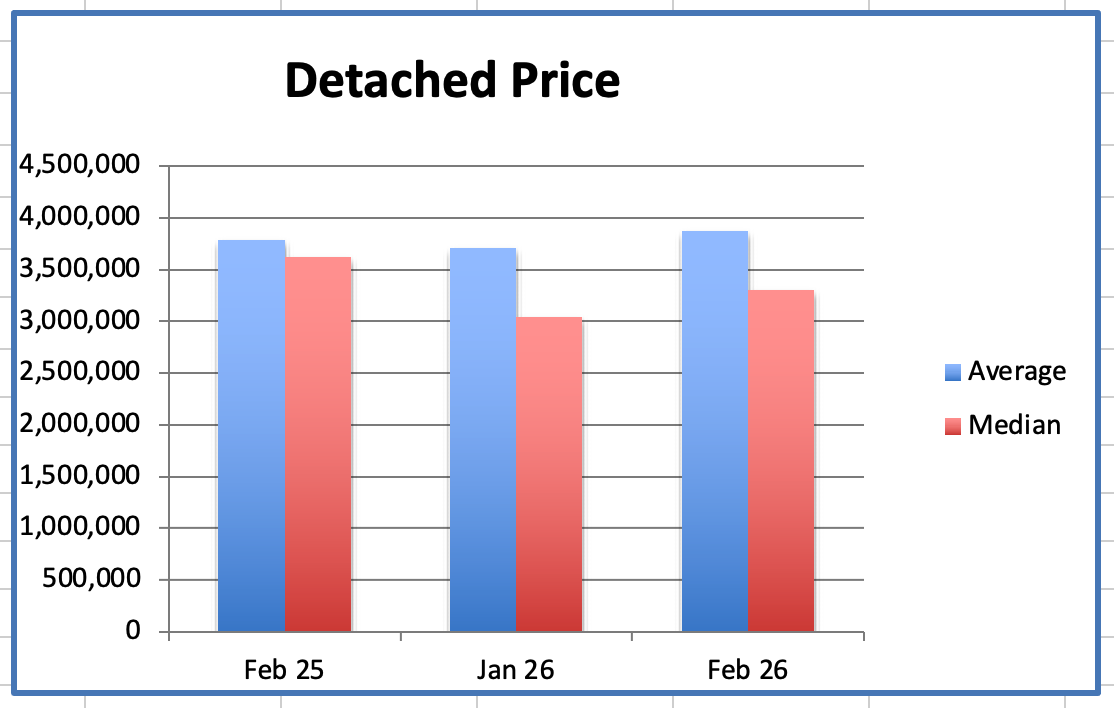
In February the Westside Detached Home average price was $3.868M, down 19% from $4.744M, the peak, in August 2023.

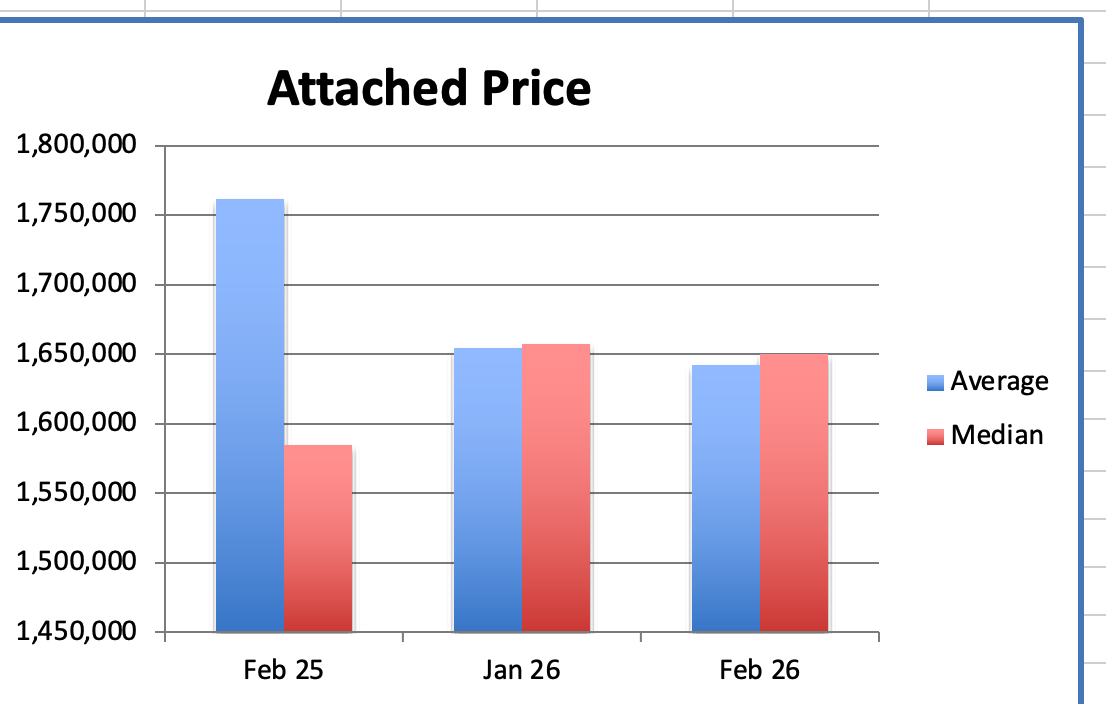
The Attached home average price was $1.642M, down 13% from $1.885M, the peak, in Dec 2024.

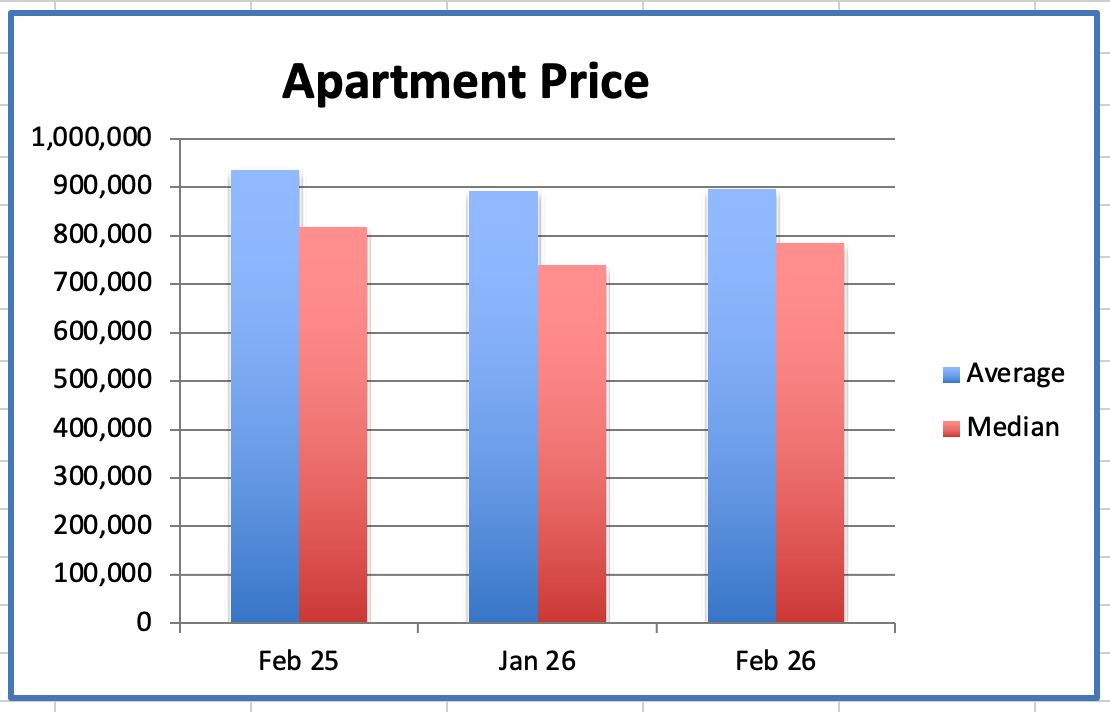
The Apartment average price was $896K, down 25% from $1.199M, the peak, in January 2018.


The Sales to Active Listings ratio (SALR) is a key indicator of market balance and it helps determine whether the market favours Buyers or Sellers. The range between 12% and 20% is considered a balanced market and prices are sustained.


Generally, downward pressure on home prices occurs when the ratio dips below 12% for a period of time. Upward pressure on home prices occurs when the ratio surpasses 20% over several months.


Currently the SALR for westside Detached homes is 9%, Attached homes is 11% and Apartments is 14%.


Market conditions are dynamic and can change rapidly due to various economic factors & the ratio can vary significantly depending on the property type.


Historically, the market has cycled up in the spring, slowed down in summer, revived a bit in the fall and become quiet in the winter. Currently the seasonal cycle has been disrupted by economic uncertainty, interest rate affordability, job security and global events that have combined to flatten out the demand for real estate.


Our current Buyers' market and expanding supply have not translated into a rush of activity but rather has reduced urgency as buyers are able to be more discriminating in their purchase. This compels Sellers to be more realistic in their price expectation if they want to be the best value in their cohort and sell rather than just sitting on the market.


Affordability is what buyers need and well priced homes offering good value are selling. Fewer Buyers are speculating and more are buying for a roof over their heads. Sellers are starting to grasp the idea that value is what is selling and they are adjusting their asking prices accordingly.


Buyer confidence while not lacking for folks needing a roof over their heads, is diminished compared with years gone by and relates to events beyond real estate into global headlines, consumer tariffs and other issues which detract from market momentum.


The years of irrational exuberance and speculative activity in our market have shifted to a more rigorous and rational search process less whipped into a frenzy by the fear of missing out.


This too may all be a cycle but it is not the seasonal cycle we are used to.


This is a buyers' market and a good opportunity to get into the market or to move up in the market. We expect the market to remain slow but we know that can change in an instant.


Sellers need to be the best value in their cohort to attract a buyer so strategic pricing is the key to achieving a sale.


Thinking of Buying or Selling? Let’s Talk!


πŸ“ž Call me today to discuss your options and make the most of the upcoming selling season.


Happy St. Paddy's Day! 🌈☘️🍺☁️🌱


Best regards


Stuart β›³ 🎾

Detailed information on the Westside detached homes market in February. Here's a summary of the key points:


  • Supply:
  • In February, the supply of Westside detached homes increased 7.3% compared to January, with a total of 621 homes available, up from 579.
  • This is relatively unchanged compared to February 2025 when there were 612 homes on the market.
  • Demand:
  • Sales of Westside detached homes in February were up 83% from January, with 53 homes sold.
  • Sales were up 61% compared to February 2025, which had 33 sales.
  • The number of sales remains 18% lower than the ten-year average of 65 sales.
  • Sales to Active Listings Ratio (SAL):
  • The SAL in February increased by 70% from the previous month, with a current SAL of 8.5% compared to 5% in January.
  • This is an increase of 58% from the SAL of 5.4% in February 2025.
  • An SAL between 12% to 20% is typically considered a balanced market, where prices tend to remain relatively stable.
  • Pricing:
  • The average detached home price in February decreased 18.5% and median decreased 22% from August 2023's peak.
  • The average price is $3.868 million, and the median price is $3.3 million.
  • Current prices are up 4.3% on average and 8.6% on median from last month.
  • High and Low Sale Prices:
  • Westside detached home sales in February ranged from a low of $1.6million to a high of $28 million. The most expensive property took 291 days to sell, while the least expensive took 109 days!
  • Of the 53 homes sold, only 10 sold at or above their asking price, indicating a buyer's market.


These statistics provide a comprehensive overview of the Westside detached homes market in February shedding light on changes in supply, demand, pricing, and notable sale prices.

Detailed information on the Westside apartment market in February. Here's a summary of the key points:

  • Supply:
  • In February, the supply of Westside apartments was up 9% compared to January, with a total of 1,470 apartments available for sale.
  • This number is down by 17% from February 2025.
  • Demand:
  • Demand for Westside apartments increased by 61% in February with 201 sales compared to 125 sales in January.
  • The number of sales in February was down 15% from the same month last year, which had 236 sales.
  • Apartment sales are down 33% from the ten-year average of 299 sales.
  • Sales to Active Listings (SAL):
  • The SAL in February increased by 48% compared to January, to 13.7%.
  • This is an increase of 2.5% from the SAL of 13.3% in February 2025.
  • An SAL between 12% to 20% is typically considered a balanced market, where prices tend to remain relatively stable.
  • Prices:
  • The average price of Westside apartments in February was relatively unchanged from January, with the average price at $896K v $892K.
  • It was down 4.2% from February 2025.
  • The median price was up 6% at $785K and is down 4% from February 2025.
  • Average prices are down 25% below the peak of $1,199,000 in January 2018, and median prices are 12% below the peak of June 2024.

These statistics provide a comprehensive picture of the Westside apartment market in February, highlighting changes in supply, demand, pricing, and their respective trends over time.

Detailed information on the Westside townhouse market in February. Here's a summary of the key points:

  • Supply:
  • In February, the supply of Westside townhouses increased 2% compared to January, with a total of 368 townhouses available for sale.
  • The supply was up 2% from February 2025, which also had 361 townhouses on the market.
  • Demand:
  • The demand for townhouses in February increased 14% from last month with 41 sales.
  • The number of sales in February increased by 24% from the same month last year, which had 33 sales.
  • Attached home sales are 8% below the ten-year average of 45 sales.
  • Sales to Active Listings (SAL):
  • With a slight increase in supply and an increase in demand since last month, the current SAL for townhouses increased by 12%, to 11.1%
  • This is 22% higher than the SAL of 9.1% in February 2025.
  • An SAL between 12% to 20% is typically considered a balanced market, where prices tend to remain relatively stable.
  • Prices:
  • The average price of townhouses in February was $1.642 million, relatively unchanged from January at $1.654 million.
  • It was down 7% from February 2025 when the average price was $1.762 million.
  • The median price in February was $1.65 million, relatively unchanged from January ($1.657 million), and up 4% from February 2025.
  • Average prices for townhouses are down 13% from its peak. Median prices down 11% from its peak. The average peak of $1.885 million in Dec 2024, and the median peak of $1.855 million in Dec 2024.


These statistics provide a comprehensive overview of the Westside townhouse market in February, indicating changes in supply, demand, pricing, and their respective trends over time.

Facebook  Twitter  Linkedin