Greetings!


Highlights


  • August sales demand in Metro Vancouver was 20.7% below the ten year average.
  • Supply in Metro Vancouver in August was 26.2% above the ten year average.
  • Metro prices are down in all segments compared to August 2025.
  • Westside remains a buyers’ market overall.
  • Westside supply of 672 is almost at the ten year average of 677 units.
  • Demand is 11% above the ten year average and up 31% over last year.
  • Strategic pricing is critical for sellers as buyers are very price sensitive.


Market Snapshot


Westside sales Demand is up from the 10 year average by 11% for detached homes, down 28% for apartments and up 11% for townhomes.


Westside Supply is at the 10 year average for detached homes, up 12% for apartments, and 64% for townhomes.


Year over year, Westside detached sales increased to 68 (up 31%), apartments declined to 225 (down 17%), and attached homes increased to 56 (up 4%).


Pricing


Detached house average price is $3.3M, down 30% from the 2023 peak.

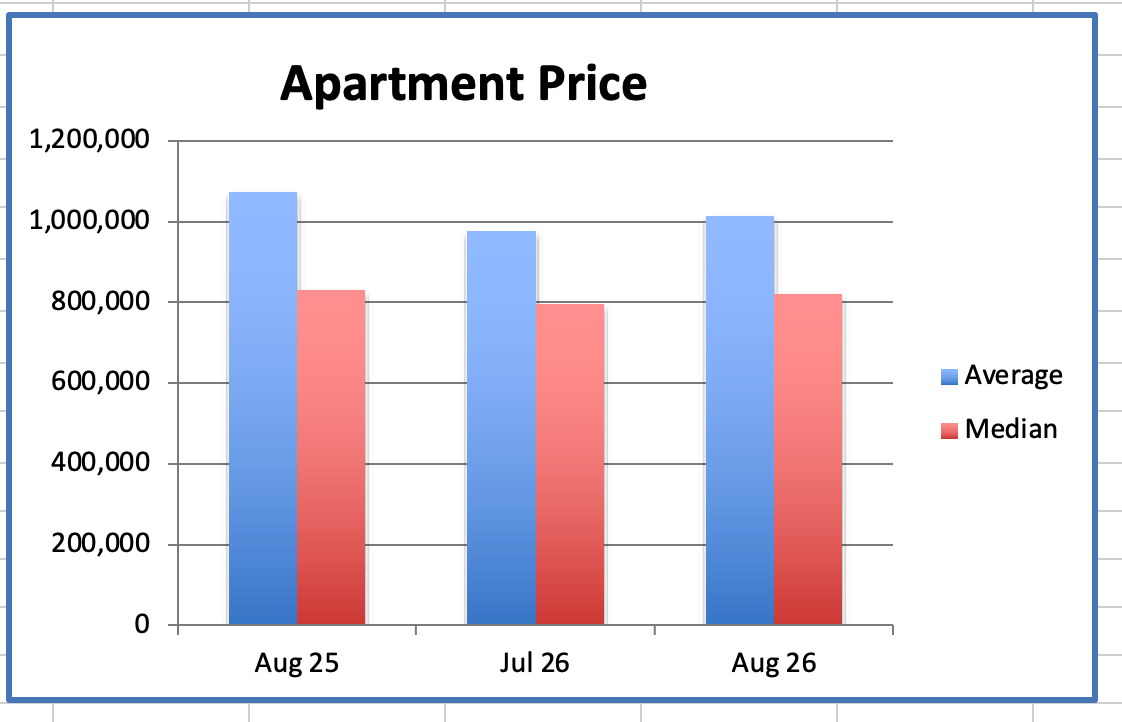
Apartments average price is $1014K, down 15% from the 2018 peak.

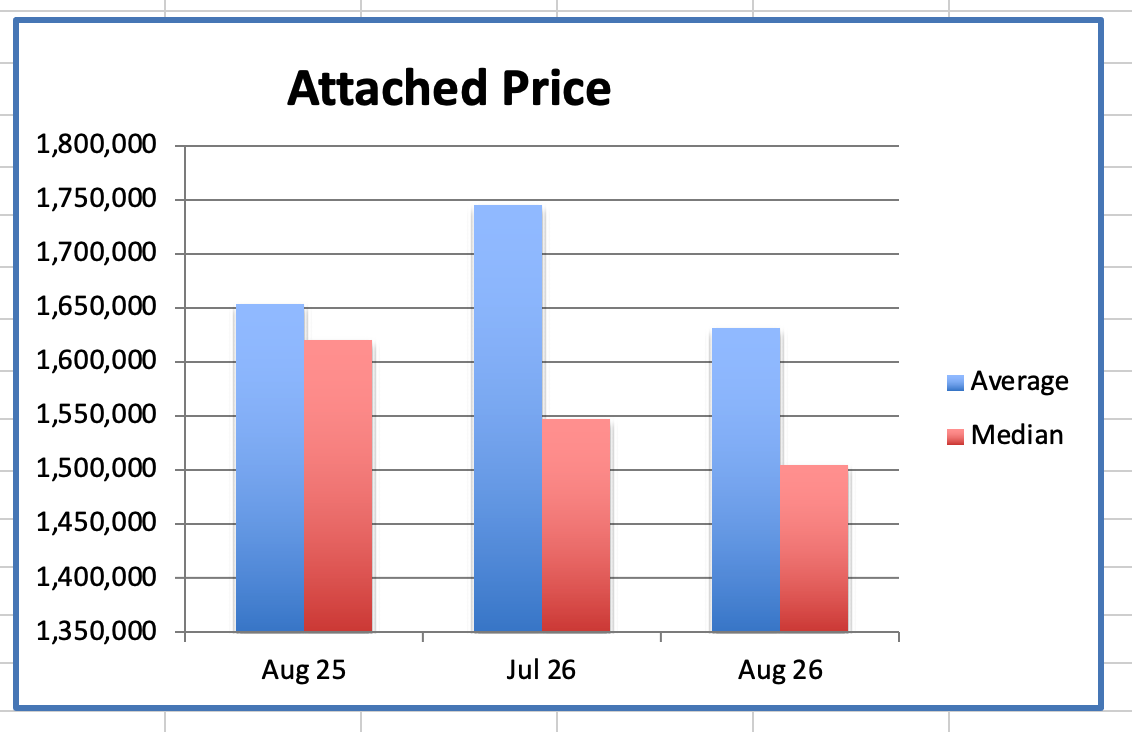
Attached homes average price is $1.63M, down 19% from the 2024 peak.


Market Balance


The sales to active listings ratio shows:

  •  Detached at 9.9% (buyers’ market)
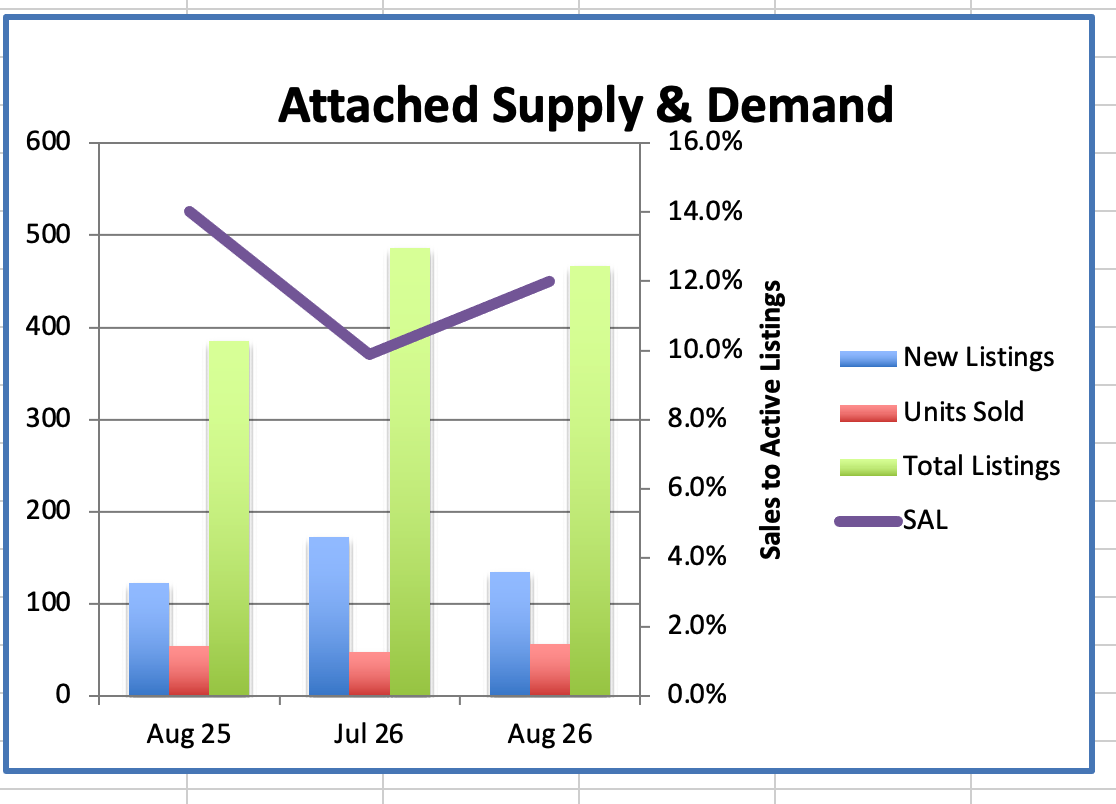
  •  Attached at 12% (balanced market)
  • Apartments at 14% (balanced market)


The Sales to Active Listings ratio (SALR) is a key indicator of market balance and it helps determine whether the market favours Buyers or Sellers. The range between 12% and 20% is considered a balanced market and prices are sustained.


Downward pressure on home prices occurs when the SAL ratio dips below 12% for a period of time. Upward pressure on home prices occurs when the ratio trends up and particularly when it surpasses 20% over several months.


Currently the SAL ratio for westside detached homes is 9.9% allowing prices to decline. The SAL ratio for attached homes is back up to 12%, not quite sustaining prices and the SAL ratio for apartments is level at 14%, balanced market territory, which is allowing prices to recover slightly from Dec & January.


Outlook


Westside detached homes value improves as prices decline. Buyers are competing for updated homes in move in condition. Supply down & Demand was flat in August and prices continue to decline, creating good opportunities for buyers. Successful sellers are pricing sharply!


Apartment supply & demand are both down in August and that is turning prices from a slow rise in the spring to flattening over the last couple of months. Fewer new strata apartment projects are coming to market as foreign buyer restrictions and zoning incentives favour rental construction. This is increasing rental supply, but it is resulting in a decline in the supply of apartments for sale. So while rents may need to adjust down to compete with the increase in rental supply, the decrease in for sale inventory should strengthen prices for apartment resales.


Westside Townhouse supply is up 21% over last year and 34% over August 2024 while demand is level with August 2025 which is causing prices to decline. The new R1-1 zoning is encouraging builders to create the many half duplex and Multi development units that are now on the market giving buyers more options.


Affordability remains a key driver. Buyers are focused on well priced homes that offer real value, with less emphasis on speculation. Builders are buying land value properties for conversion to new multi, duplex and single family homes with revenue suites & laneway homes. Sellers who need to move are pricing sharply to meet the market and selling within 3 weeks.


Click here for Westside Report


Buyer Takeaways


  • This is a buyers' market and a good opportunity to get into a home or to move up.
  • The market sales volume seems to have peaked in June and has come off as is typical in July & August which is a sign for buyers to get buying.


Seller Takeaways


  • To sell successfully, be the best value in your category
  • Prepare your home properly: Declutter, Paint & Repair and Clean, Clean, Clean!
  • Price strategically from the start!


Thinking of Buying or Selling? Let’s Talk!


📞 Call me today to discuss your options and make the most of the upcoming selling season.


Hope you had a great summer! Fall is just around the corner. 🍂☕️🪵


Best regards


Stuart ⛳ 🎾

Detailed information on the Westside detached (freehold) homes market in August. Here's a summary of the key points:


  • Supply:
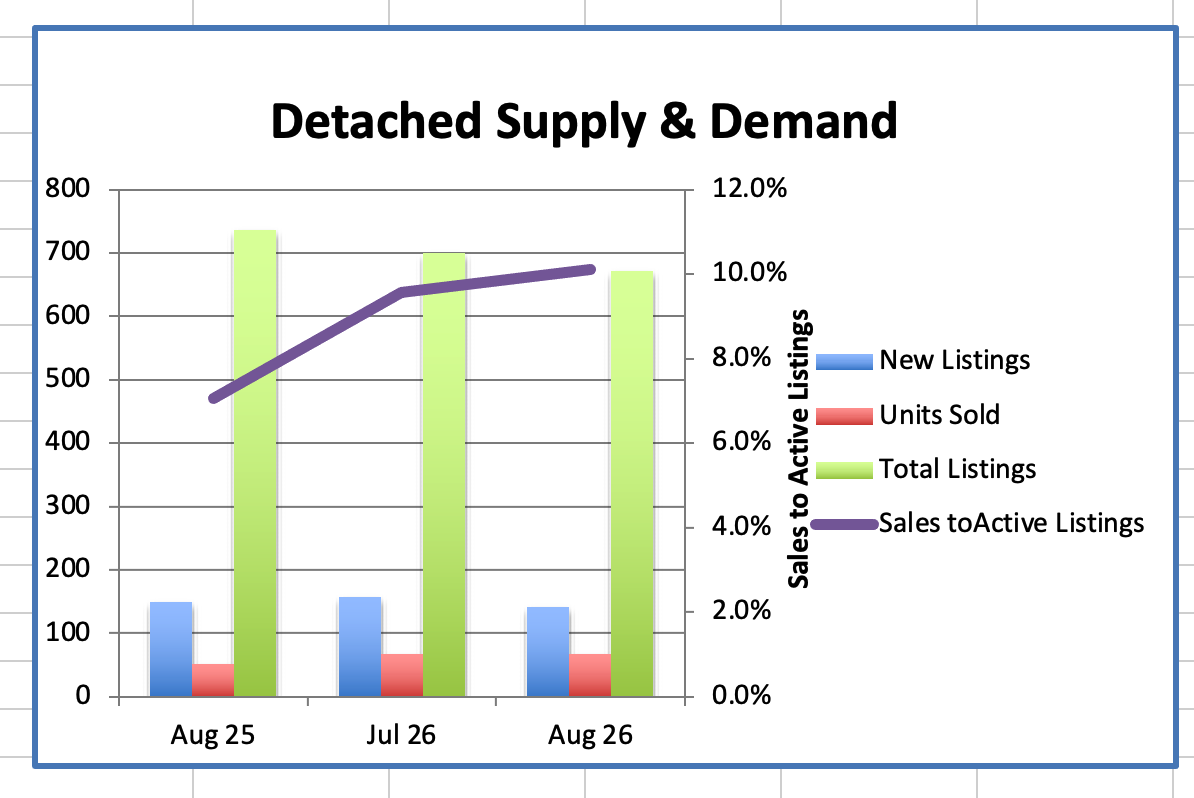
  • In August, the supply of Westside detached homes decreased 4% compared to July, with a total of 672 homes available, down from 700.
  • This is down 9% compared to August 2025 when there were 737 homes on the market.
  • Demand:
  • Sales of Westside detached homes in August were up 1.5% from July, with 68 homes sold.
  • Sales were up 31% compared to August 2025, which had 52 sales.
  • The number of sales remains 11% higher than the ten-year average of 61 sales.
  • Sales to Active Listings Ratio (SAL):
  • The SAL in August increased by 6% from the previous month, with a current SAL of 10% compared to 9.6% in July.
  • This is an increase of 43% from the SAL of 7.1% in August 2025.
  • An SAL between 12% to 20% is typically considered a balanced market, where prices tend to remain relatively stable.
  • Pricing:
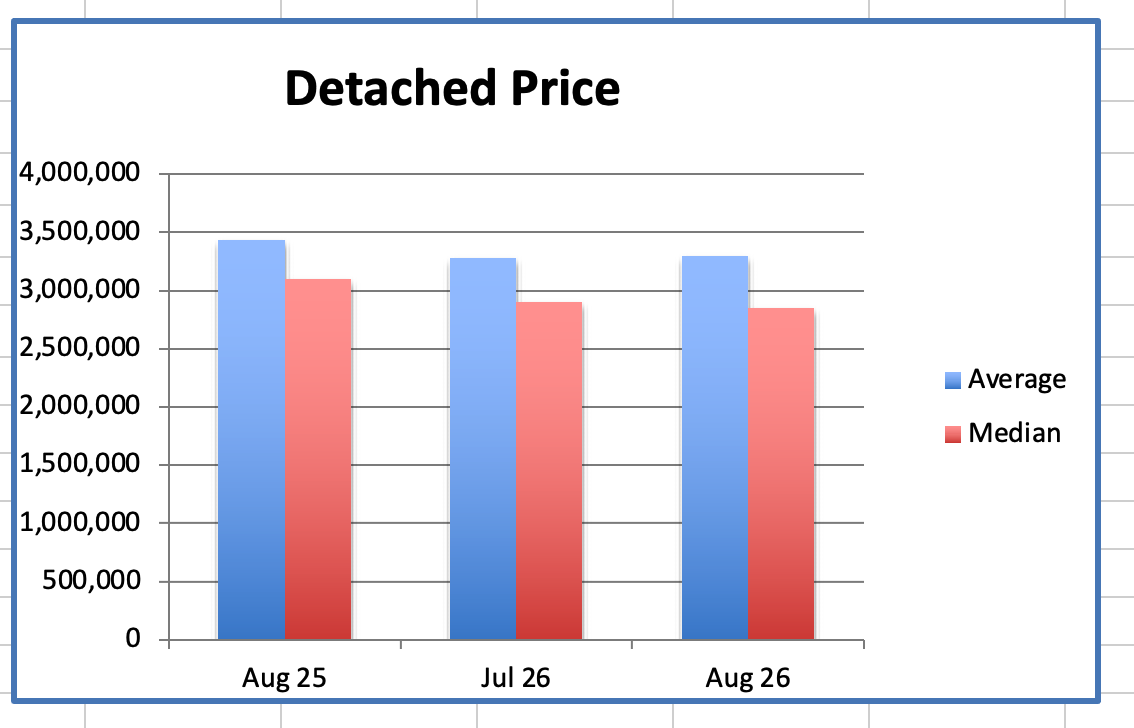
  • The average detached home price in August decreased 30% and median decreased 33% from August 2023's peak.
  • The average price is $3.3 million, and the median price is $2.85 million.
  • Current prices are relatively unchanged on average and down 2% on median from last month.
  • High and Low Sale Prices:
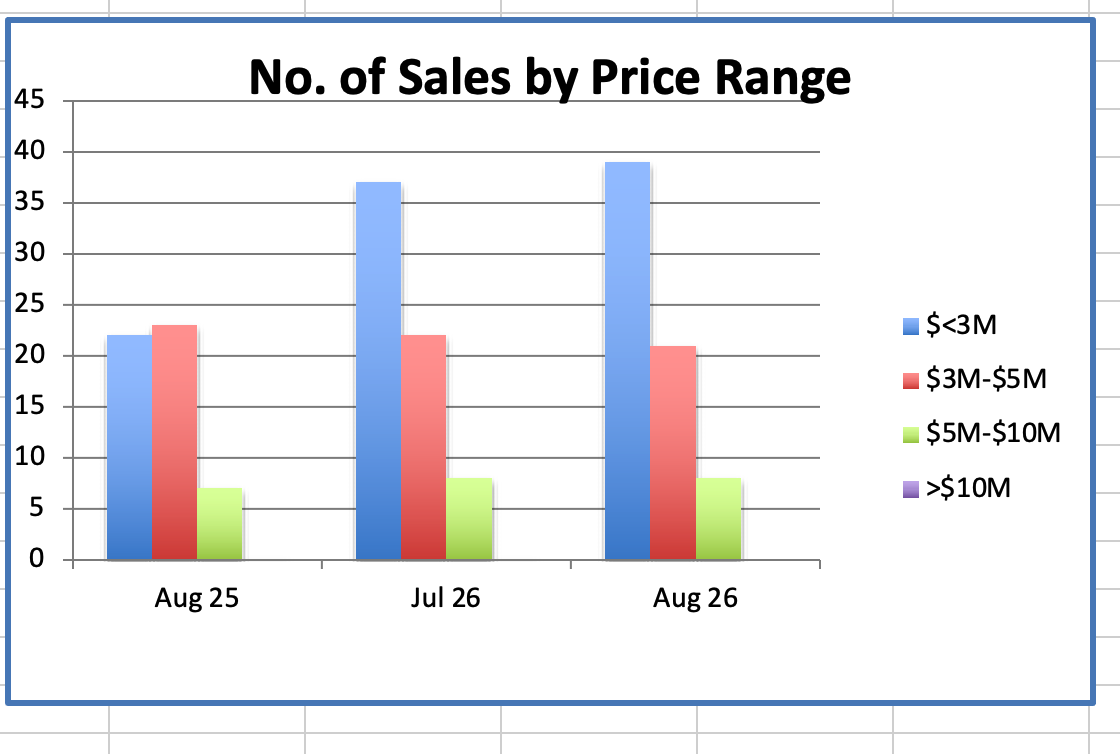
  • Westside detached home sales in August ranged from a low of $1.625million to a high of $9.5 million. The most expensive property took 312 days to sell, while the least expensive took 157 days.
  • Of the 68 homes sold, only 4 sold at or above their asking price, indicating a buyer's market.


These statistics provide a comprehensive overview of the Westside detached homes market in August shedding light on changes in supply, demand, pricing, and notable sale prices.

Detailed information on the Westside apartment market in August. Here's a summary of the key points:

  • Supply:
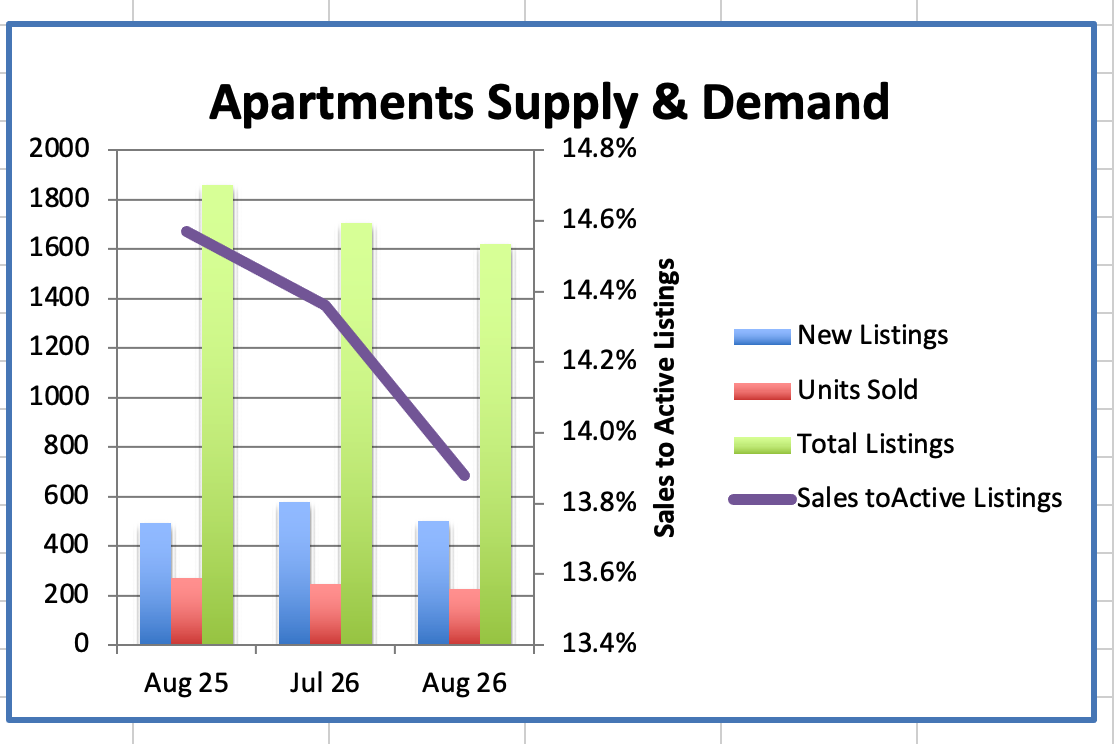
  • In August, the supply of Westside apartments was down 5% compared to July, with a total of 1,621 apartments available for sale.
  • This number is down by 13% from August 2025.
  • Demand:
  • Demand for Westside apartments was down 8% in August with 225 sales compared to 245 in July.
  • The number of sales in August was down 17% from the same month last year, which had 271 sales.
  • Apartment sales are down 28% from the ten-year average of 313 sales.
  • Sales to Active Listings (SAL):
  • The SAL in August decreased 3.3% compared to July, to 13.9%.
  • This is down 4.7% from the SAL of 14.6% in August 2025.
  • An SAL between 12% to 20% is typically considered a balanced market, where prices tend to remain relatively stable.
  • Prices:
  • The average price of Westside apartments in August was up 4% from July, with the average price at $1013K v $977K.
  • It was down 6% from August 2025 ($1074K).
  • The median price was up 3% at $820K and is down slighlty from August 2025.
  • Average prices are down 15% below the peak of $1,199,000 in January 2018, and median prices down 8% below the peak of June 2024.

These statistics provide a comprehensive picture of the Westside apartment market in August, highlighting changes in supply, demand, pricing, and their respective trends over time.

Detailed information on the Westside townhouse market in August. Here's a summary of the key points:

  • Supply:
  • In August, the supply of Westside townhouses was down 4% compared to July, with a total of 467 townhouses available for sale.
  • The supply was up 21% from August 2025, which had 385 townhouses on the market.
  • Demand:
  • The demand for townhouses in August increased 17% from last month with 56 sales.
  • The number of sales in August increased 4% from the same month last year, which had 54 sales.
  • Attached home sales are 11% above the ten-year average of 51 sales.
  • Sales to Active Listings (SAL):
  • With a decrease in supply and an increase in demand since last month, the current SAL for townhouses increased by 21%, to 12%
  • This is 14% lower than the SAL of 14% in August 2025.
  • An SAL between 12% to 20% is typically considered a balanced market, where prices tend to remain relatively stable.
  • Prices:
  • The average price of townhouses in August was $1.631 million, up 8% from July at $1.509 million.
  • It was down slightly from August 2025 when the average price was $1.653 million.
  • The median price in August was $1.505 million, unchanged from Julyand down 7% from August 2025.
  • Average prices for townhouses are down 14% from its peak. Median prices down 19% from its peak. The average peak of $1.885 million in Dec 2024, and the median peak of $1.855 million in Dec 2024.


These statistics provide a comprehensive overview of the Westside townhouse market in August, indicating changes in supply, demand, pricing, and their respective trends over time.

Facebook  Twitter  Linkedin