February 23, 2017


Director's Letter 
Carole Baggerly 
Director, GrassrootsHealth 


Just today, when I Googled "vitamin D in the news" the top 3 headlines were:
  • Should I take vitamin D every day? (yes!)
  • Should I be taking vitamin D? (yes!)
  • Don't believe the hype: vitamin D supplements unlikely to prevent chest infections. (no!)
That is today, tomorrow they will be different, but similar.

Today we want to make you aware of a paper from Europe that challenged the age old myth that there is a U or J-shaped curve with respect to vitamin D at physiological levels - meaning that vitamin D helps conditions up to a point, but then if you have too much it makes the condition worse or increases the risk. 

In most cases when the research is done following the elements outlined below we see an increasing benefit (or decrease in condition) and then a plateau with no additional benefit, but also no increased harm or risk. The plateau differs per condition, but many of them are around 40 ng/ml - and thus our scientist panel's recommendation of 40-60 ng/ml (100-150 nmol/L).

For any vitamin D study, and particularly those that report negative results, it is important to check these common problems:

Did they dose daily?
  • Immune function needs a regular supply of vitamin D, bone function does not.
Is the dose big enough to create a significant change in status?
  • Doses less than 2000 IU/day may not be enough to produce a change in status.
Are results reported by vitamin D levels, instead of or in addition to dosage groups?
  • As everyone responds to supplementation differently, it is important to report by end result of 25(OH)D.
Are other co-nutrients maximized?
  • For vitamin D to be most effective, other nutrients such as calcium, magnesium, and vitamin K need to be available. 
Since we are all invested in this vitamin D revolution, it is important to look for these key elements and be able to recognize shortcomings in the research and media reports out there. 

Many of you have great testimonials to this fact. We would love to publish some of the ways which testing and raising your vitamin D levels has made a change in your life. Please email Susan if you are interested in helping in this way.

Onwards!

Carole Baggerly 
Director, GrassrootsHealth 
A Public Health Promotion & Research Organization 
Moving Research into Practice NOW!
 
Paper of the Week


Vitamin D and mortality: Individual participant data meta-analysis of standardized 25-hydroxy vitamin D in 26916 individuals from a European consortium
Martin Gaksch, et al.
Medical University of Graz, Austria
PLoS ONE
February 2017

What did they do?

This study is a meta-analysis, which means it is a study of other studies - they combine and analyze data from several previously conducted studies. In this case, the authors standardized individual participant vitamin D levels from eight independent studies for their analysis on vitamin D and mortality.

The data came from 26,916 European individuals with a median age of 61.6 years, 58% females, and a median 25(OH)D of 53.8 nmol/L (about 20 ng/ml).

How did they measure the results?

Study subjects were grouped into different ranges of baseline 25(OH)D measurement and death rates were compared between those ranges. The groupings were

Severely deficient
< 30 nmol/L
< 12 ng/ml
Inadequate
30-39.99 nmol/L
12-16 ng/ml
Inadequate
40-49.99 nmol/L
16-20 ng/ml
Sufficient
50 - 74.99 nmol/L
20-30 ng/ml
Sufficient
75 - 99.99 nmol/L 
30-40 ng/ml
Sufficient 
100 - 125 nmol/L
40-50 ng/ml
High concentrations
> 125 nmol/L
> 50 ng/ml
 
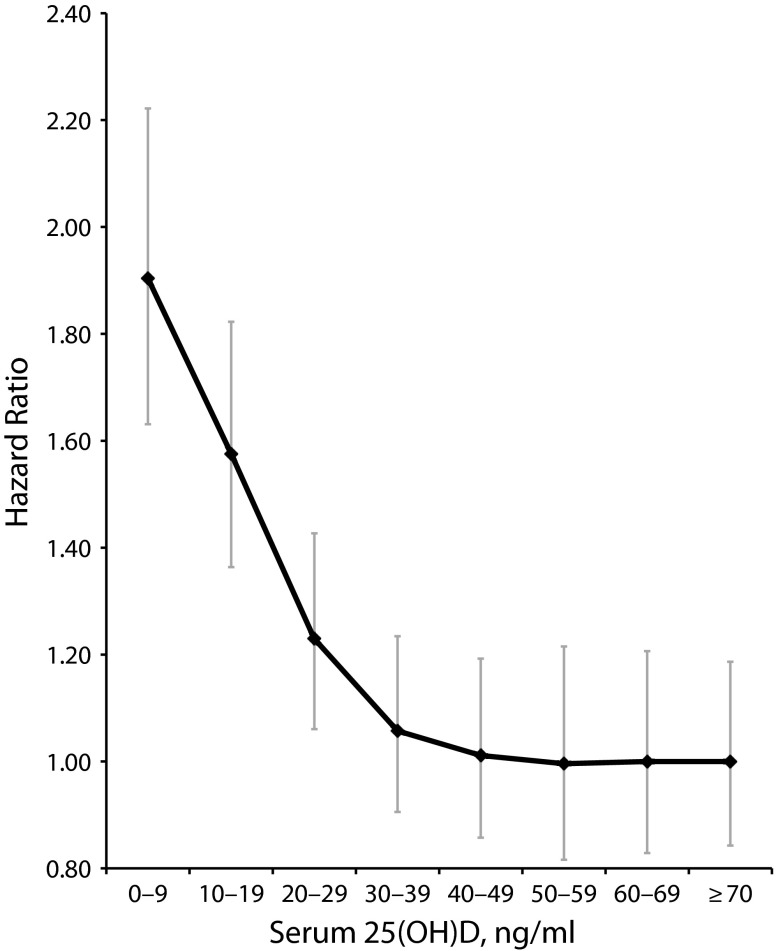
The biggest difference in mortality was seen in the comparison between the lowest category (< 12 ng/ml) and those in the middle sufficient category (30-40 ng/ml). Those in the lowest category were 1.67 times more likely to die than those in the higher category.

No J-shaped curve

This study created the top 2 sufficient groups (30-40 ng/ml and 40-50 ng/ml) because in the past they were the regions that would sometimes show decreased benefit - the area where the graph would take an uptick - the back half of the U or J-shaped curve.

The study population had most people < 30 ng/ml (22940, 85%). The largest group > 30 ng/ml was the first one - 30-40 ng/ml with 3125 people. The next two groupings had 679 and 172 people respectively. (Table 2 in paper). The risk for all-cause mortality was not significantly different in any of the groups above 20 ng/ml (50 nmol/L) - no J-shaped curve!


Figure 1 from paper

Cardiovascular Death

Cardiovascular death was also considered in these same groupings (the two highest were combined). Those with the lowest vitamin D levels, < 12 ng/ml, were 3.18 times more likely to die of cardiovascular related causes than those in the reference range of 30-40 ng/ml. As shown in table 3 of the paper, there was a continued decrease in cardiovascular death as vitamin D levels increased.

Cancer

The authors did not find a linear relationship between vitamin D and cancer - the cancer rate did not consistently go down as vitamin D levels increased, but, as shown in table 4 of the paper, all groups lower than the reference group of 30-40 ng/ml had a higher risk, and those in the highest group, >40 ng/ml, had a lower risk. Again, no sign of a J-shaped curve.

This data is consistent with previous research from Dr. Cedric Garland who has long noted that women need to get over 50 ng/ml to maximize the protective benefits against breast cancer. Again, it is always good to look at the data and read the paper - so see the specifics.

Mortality Decreases with Vitamin D Levels
> 30 ng/ml


Meta-analysis of All-Cause Mortality According to Serum 25-Hydroxyvitamin D
Cedric F. Garland et al.
University of California at San Diego
American Journal of Public Health
August 2014

Similar to the study above, this paper reports on data collected from past studies, in this case 32 of them, and reports on the relative risk of mortality.

 Figure 3 from paper

As seen in the figure, Garland et al. reported a decline in all-cause mortality rates from the lowest level (0-9 ng/ml) to the highest level, but saw a plateau starting at 50 ng/ml.
 
Again you can see - no J-shaped curve!

New Vitamin D Screening Program


Al Jalila Foundation announced that it has received a two-year Health Access Grant for $100,000 from the Medtronic Foundation.
 
The grant will fund a local research program focusing on Vitamin D deficiency across the country. The study will concentrate on early detection, evaluation, and treatment of Vitamin D deficiency. The grant will allow Al Jalila Foundation to screen thousands across the United Arab Emirates to promote early detection and prevention of the debilitating disease.  

Enroll Today

Limited Offer

Save $15!
Enroll now for only $50

Use coupon code 
DforLOVE

Sponsored by

Bio-Tech Pharmacal

10% off 
in February with coupon code GRH-Feb10

Bio-Tech Pharmacal has been providing quality nutraceuticals (dietary supplements) for over 32 years! 

D3-50,000 IU, D3Plus, D3/K2, and more!

cGMP/FDA registered facility


A session with The Vitamin D Lamp takes just five minutes. The UVB rays quickly & naturally generate healthy vitamin D.

Sperti's Vitamin D Lamp is the only FDA recognized ultraviolet product for vitamin D production in the human body. 


Free shipping within the USA (except Alaska & Hawaii)

When a study reports a U-shaped curve it means that there is the lowest incidence of disease in the middle ranges, with peaks in both the lower and upper ranges. A graph of the outcomes would look something like this:


A similar type of graph is sometimes reported as a "backwards-J" shaped curve as shown below. In this case the outcome is still the best in the middle region, but the outcome is worse in the low levels than the high levels. Here is an example of a backwards-J shaped graph:


Vitamin D information in German

Send this web site to your German friends - we all need our vitamin D!


Vitamin D and mortality: Individual participant data meta-analysis of standardized 25-hydroxy vitamin D in 26916 individuals from a European consortium
Martin Gaksch, et al.
Medical University of Graz, Austria
PLoS ONE
February 2017

Meta-analysis of All-Cause Mortality According to Serum 25-Hydroxyvitamin D
Cedric F. Garland et al.
University of California at San Diego
American Journal of Public Health
August 2014

Vitamin D deficiency and mortality risk in the general population: A meta-analysis of prospective cohort studies
Zitterman A et al.
Am J Clin Nutr
January 2012


Click here to receive weekly news from GrassrootsHealth.
 
Share this Newsletter
Share this newsletter on Facebook!  
Click on the top left social share buttons
to share this entire newsletter.

Like us on Facebook


Follow us on Twitter


View our videos on YouTube
Contact Us

760-579-8141