Banner for the Landsat Science News Digest newsletter. The graphic features the name of the newsletter in white text on top of a Landsat image of Svalbard. The NASA meatball logo is on the left side of the graphic and the bottom right reads, "August 2026".

Separating Wheat from Chaff — from Space

September 8, 2026

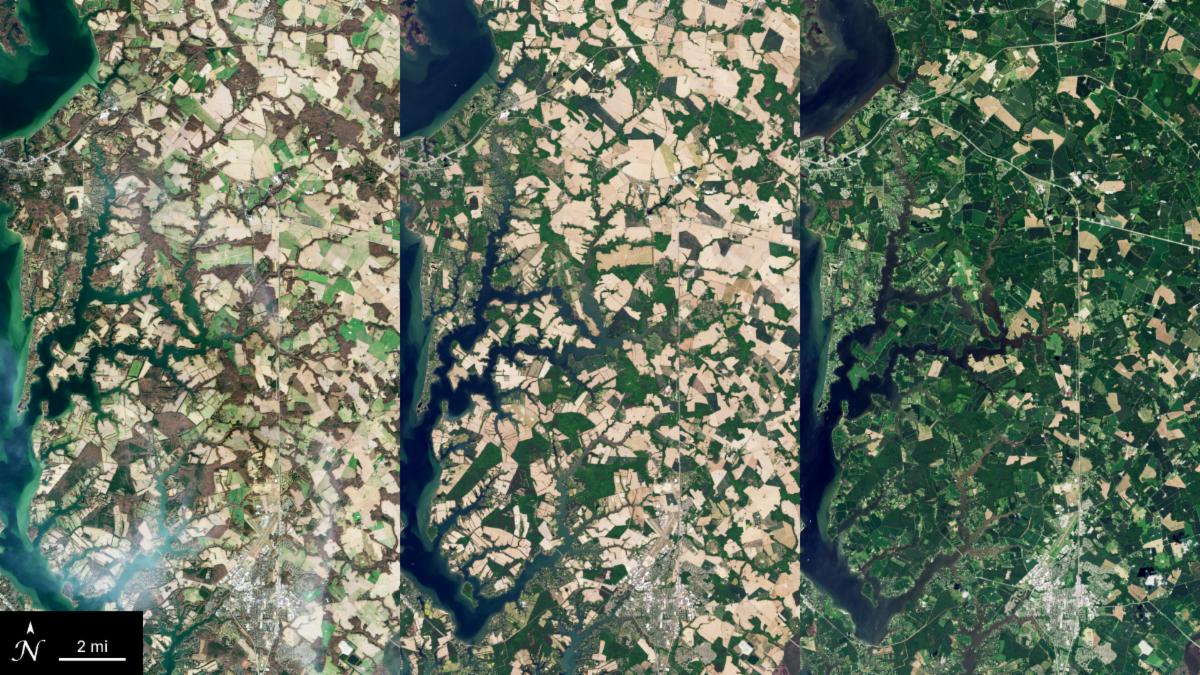
Graphic featuring three satellite images of cover crops in various seasons in Maryland. The left image has crop fields of various shades of light brown and tan, the middle image has tan and light green fields, and the image on the right is mostly fields of green with some fields of tan. A blue river cuts through the top left part of each image.

Imagery from the Harmonized Landsat Sentinel-2 (HLS) program is helping researchers (Gao et al., 2026) map Maryland's winter cover crops by tracking plant growth patterns, enabling agencies to verify conservation efforts that protect Chesapeake Bay water quality.


August 6, 2026

Vine by Vine: Conserving Water with Landsat


From 438 miles up, Landsat's thermal sensors reveal exactly how much water California's vineyards are using — helping growers cut water use without sacrificing the harvest. That insight helped E. & J. Gallo Winery work toward cutting vineyard water use in half, and laid the groundwork for OpenET.

 
A headshot of a smiling man in a suit

August 27, 2026

Eric Vermote Wins Pecora Award


In May 2026, Landsat Science Team member and atmospheric correction expert Eric Vermote won the 2025 William T. Pecora Award for his outstanding contributions set global standards for atmospheric correction and data validation. We spoke to him about the award and his legacy.

 
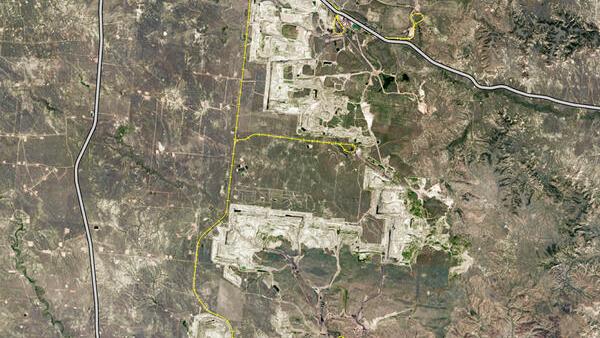
Map of an area with railroad tracks and roads indicated, along with a town and grassland areas

July 28, 2026

Landsat Illustrates the Life Cycle of Mines

Source: USGS EROS


Many satellites can show us what the Earth’s surface looks like now, but only Landsat can reveal more than 50 years of change. That's enough to watch the entire lifecycle of a mine.


PUBLICATION SPOTLIGHT


Validation of the Harmonized Landsat and Sentinel-2 (HLS) Version 2.0 Surface Reflectance Product Using RadCalNet


| Angal et al., 2026


Combining data from different Earth observation satellites provides researchers with high-frequency views of our changing planet, but doing so requires rigorous calibration to ensure seamless accuracy across sensors. Angal et al., 2026, published in July in Photogrammetric Engineering & Remote Sensing, presents a comprehensive validation of the Harmonized Landsat and Sentinel-2 (HLS) Version 2.0 surface reflectance product. To evaluate the radiometric consistency of this unified dataset, researchers compared satellite observations against independent, automated ground-truth measurements from four globally distributed Radiometric Calibration Network (RadCalNet) sites. Their analysis revealed strong overall agreement, with satellite surface reflectance matching ground measurements to within 5% for near-infrared and shortwave infrared bands, and within 10% for the shortest wavelengths. Using RadCalNet as a common baseline, the team also evaluated the interproduct agreement between HLS L30 (derived from Landsat data) and S30 (derived from Sentinel-2 data) products. They found interproduct agreement of within 4% across almost all spectral bands, confirming the successful harmonization of Landsat and Sentinel-2 data. This validation gives the scientific community the confidence needed to leverage HLS time-series data for global land monitoring.

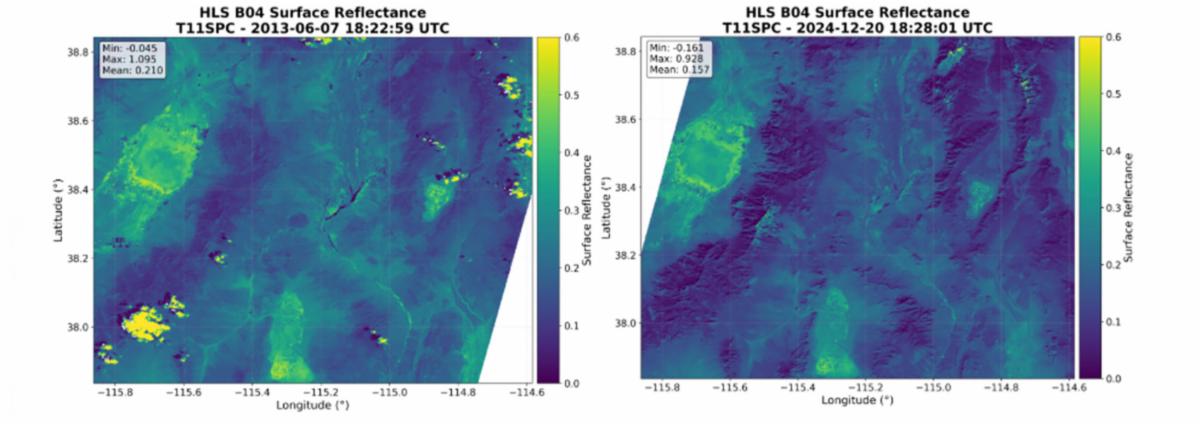
Comparison of the HLS L30 (Landsat-8/9, left) and S30 (Sentinel-2 A/B, right) surface reflectance products for the B04 (red) band over the Railroad Valley Playa (RVUS) RadCalNet site. The images demonstrate how observations from distinct sensors are harmonized to a common 30-m spatial resolution and military grid reference system, highlighting the uniform spatial characteristics of the playa within the designated extraction area used for ground-truth validation.

Comparison of the HLS L30 (Landsat-8/9, left) and S30 (Sentinel-2 A/B, right) surface reflectance products for the B04 (red) band over the Railroad Valley Playa (RVUS) RadCalNet site. The images demonstrate how observations from distinct sensors are harmonized to a common 30-m spatial resolution and military grid reference system, highlighting the uniform spatial characteristics of the playa within the designated extraction area used for ground-truth validation. Image credit: Angal et al., 2026

Find more selected Landsat publications on our website.


NASA's Earth Observatory

Selected Landsat Images

August 24, 2026

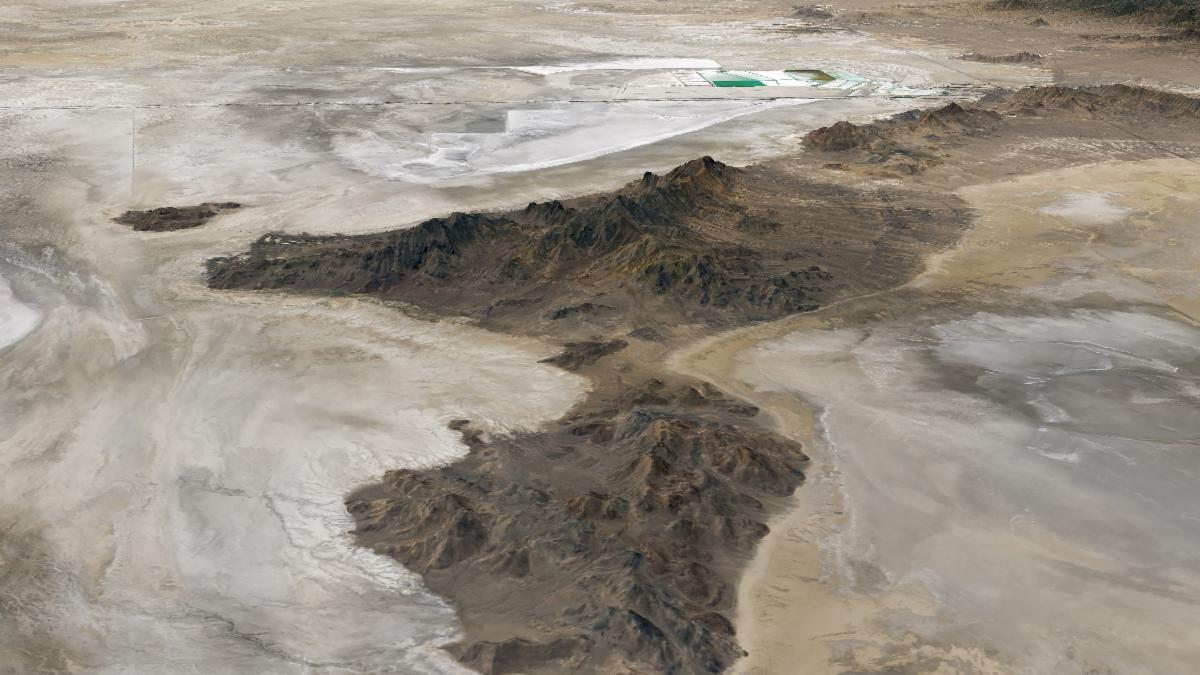
What Lake Bonneville Left Behind


The drying of the massive lake exposed playas that became the setting for feats of engineering and technological ingenuity, as well as epic tales of exploration and desperation.

Tan and white plains surround a dark mountainous ridge in a three-dimensional image of the Silver Island Mountains.

August 20, 2026

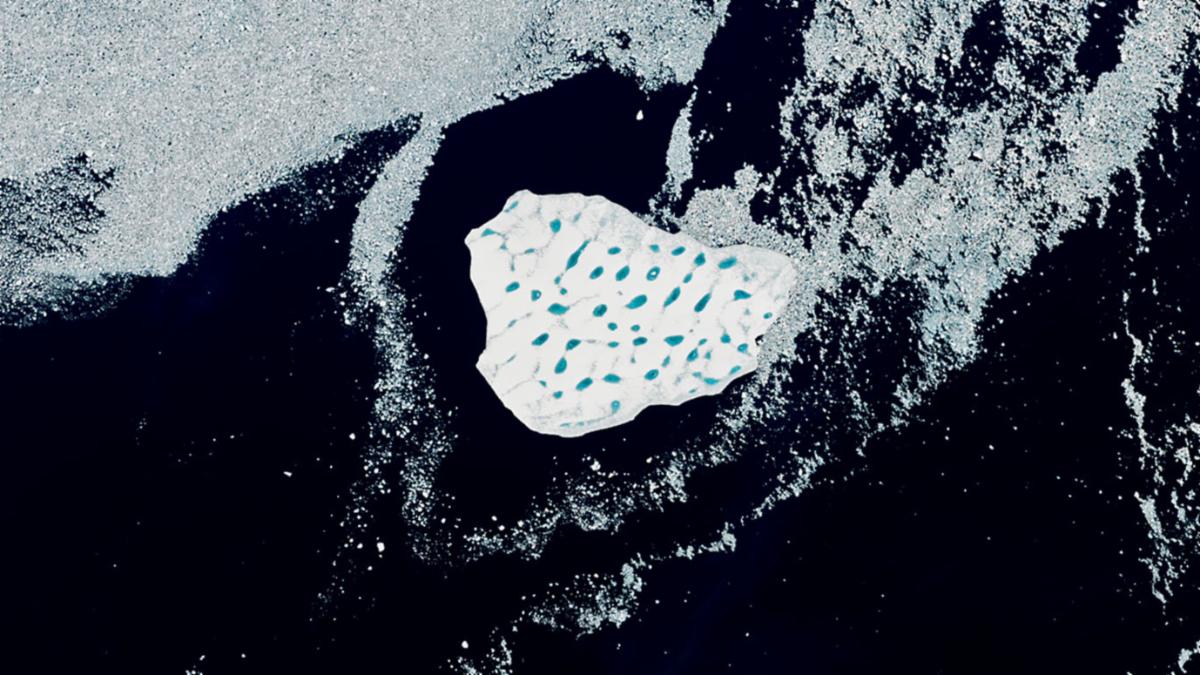
An Uncommon Drifter in the Denmark Strait


A large iceberg, observed in summer 2026, had drifted more than 1,000 kilometers south from the northeastern Greenland bay where it likely originated.

A detailed view shows an iceberg's bright white surface pocked with light blue meltwater ponds. Broken pieces of sea ice float around the iceberg in otherwise dark blue ocean water.

August 19, 2026

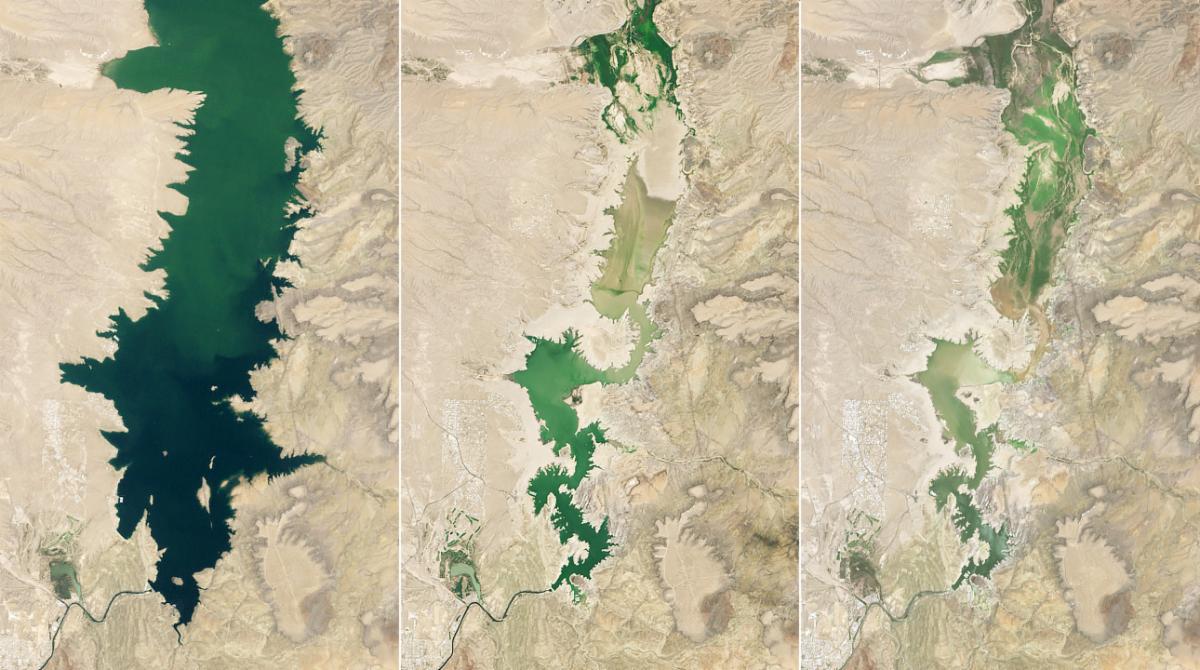
Elephant Butte Reservoir Runs Low


Drought in the Rio Grande basin contributed to New Mexico’s largest reservoir dwindling to its lowest level in decades.

A three-part image shows Elephant Butte Reservoir in New Mexico in 1994, 2013, and 2026. In 1994, on the left, the lake is nearly full. In the other two years, it is close to empty.

August 5, 2026

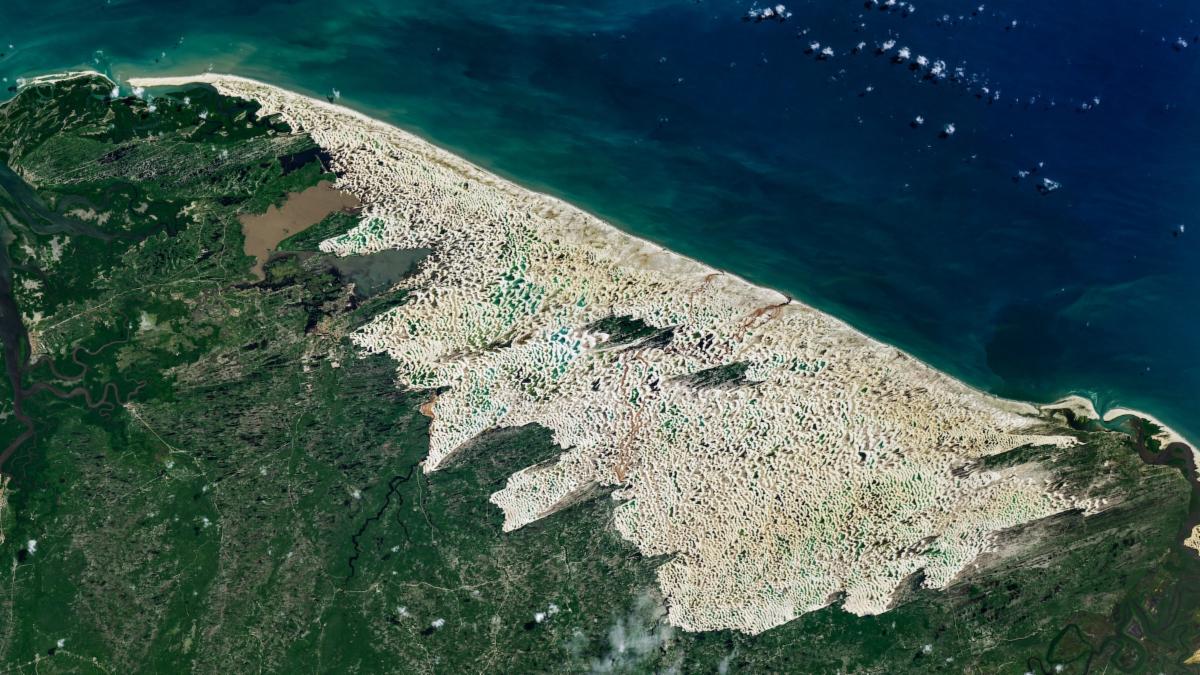
The Paradox of Lençóis Maranhenses National Park


The coastal dune field in Brazil looks like a desert but fills with freshwater lagoons every year.

Bright white sand dunes stretch for dozens of kilometers between the dark blue Atlantic Ocean and green coastal vegetation. Blue and green freshwater lagoons fill low areas between the dunes, while dark-green vegetated patches lie within the dune field.


Watch Landsat in Action

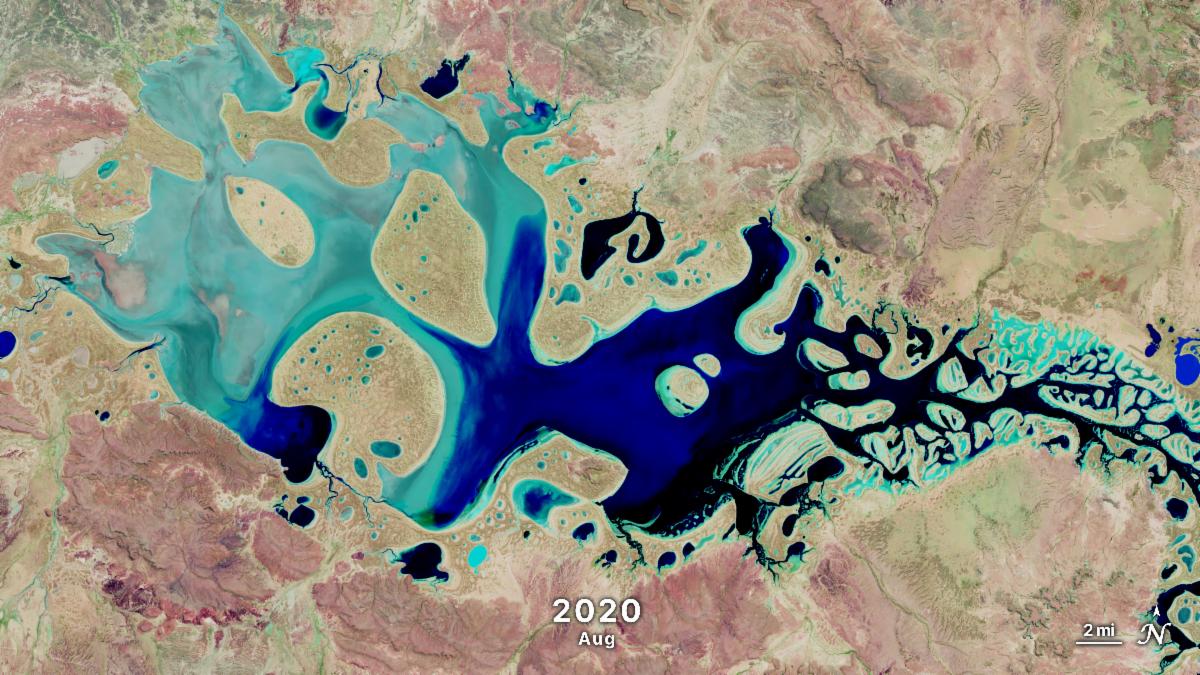
A infrared-color Landsat time series of Lake Carnegie, Australia, in August 2020, using Landsat 8/9 bands 7 (SWIR 2), 5 (NIR), and 4 (Red) to highlight seasonal variations in water, vegetation, and surrounding land.

This gallery contains time series animations which utilizes the extensive Landsat and HLS (Harmonized Landsat and Sentinel-2) data archive of Earth’s surface. Watch seasonal shifts in cropland, long-term coastline change, and more.


+ Landsat & HLS Animations Gallery


Did someone forward this newsletter to you? Subscribe here if you'd like to be on our mailing list.


science.nasa.gov/landsat