RBGWA - Logo - Full Color.png
 

RBG Wealth Weekly

June 23, 2023


Ladies and gentlemen, the weekend! In this space each week, Greg and I share some of our favorite articles, notes, and graphics from the past week along with our commentary. Please feel free to provide feedback and forward along to others if you enjoy. We appreciate you taking the time to read. 


If you are a client, we truly appreciate your business. If you are not a client, please click below to learn more about our firm and contact us.

Visit our Website
 

Articles of the Week

Market Attitudes Have Shifted in 3 Major Ways 💥


“1. The Fed has become less hawkish 🦅


Last spring, the Federal Reserve went into crisis mode over inflation. In May 2022, Fed Chair Jerome Powell first said economic ‘pain’ may be necessary to get inflation down. In June, the Fed hiked rates by an eye-popping 75 basis points. At the time, it was the biggest single rate hike since 1994.


After months of cooling inflation, the Fed’s tone became much less hawkish on February 1, when Powell acknowledged that ‘for the first time that the disinflationary process has started.’ And on March 22, the Fed signaled that the end of interest rate hikes was near.


[Last] Wednesday, the Fed kept its target range for the federal funds rate at 5% to 5.25%. This pause came after 10 consecutive interest rate hikes since the beginning of the rate hike cycle in March 2022.


The news came after Tuesday’s May Consumer Price Index report, which was the lowest annual reading on inflation since March 2021. It was also a record 11th straight month of decline.


To be clear, Wednesday was not necessarily the end of this rate hike cycle. In its updated summary of economic projections, the Fed’s estimated median federal funds rate for the end of 2023 was revised up from 5.1% to 5.6%, implying that the central bank sees a need for two more rate hikes by the end of the year.


A ‘key takeaway from the June meeting is that FOMC participants see a more moderate pace of tightening as appropriate now that the funds rate is closer to its likely peak,’ Goldman Sachs’ David Mericle wrote on Wednesday.


The bottom line is the Fed is moving away from emergency-mode. This bodes well for financial markets if it means efforts to further tighten financial conditions are coming to an end.


2. The economy has become less likely to go into recession 💪


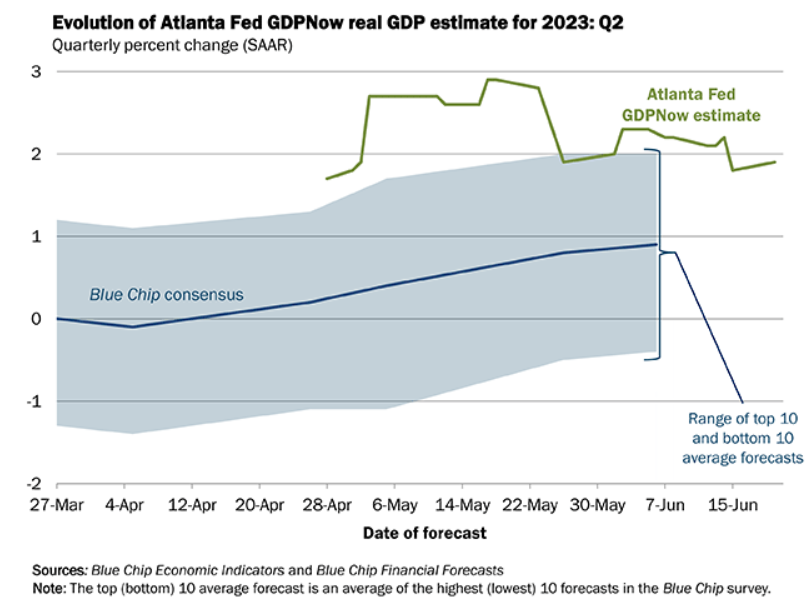
Coming into 2023, most economists were pretty convinced the U.S. economy would go into recession some time during the year.


TKer readers have long understood the economy has been bolstered by massive tailwinds. These persistent reasons for optimism have kept recession at bay and continue to do so. Month after month, we’ve gotten confirmation job growth remains hot and consumer spending remains strong…


The bottom line is that the case for an economic recession remains very weak as massive tailwinds continue to support growth.

3. The stock market is not doomed to crater 📉


The 'most popular prediction' coming into 2023 was that stocks would tumble during the first half of the year before rallying in the second half.


That prediction has been very wrong. In fact, the stock market officially entered a bull market earlier this month while spending almost no time this year in the red…


Indeed, while the improving outlook for earnings is the simplest explanation for higher stock prices, it’s a welcome development to see that the Fed-sponsored market-beatings may not go on for much longer.


Who knows for sure what stock prices will do in the second half?


The bottom line is that market conditions appear to be improving, and stock prices have been moving up (as they usually do).”


Sam might have been labeled as a contrarian or “perma-bull” at the beginning of the year, but the sentiment has been spot-on. “Don’t fight the Fed” is coming to an end, the economy has been incredibly resilient due to consumers via a strong labor market and excess cash savings, and corporate earnings have not recessed to the extent expected. Those factors have contributed to a great start to the year and recovery from last year.

How Cheap (or Expensive) is the Stock Market Right Now?


“Here’s a piece of jargon that never made much sense to me — fair value.


Our fair value of the S&P 500 is 4,357 based on blah, blah, blah.


Fair relative to what? Historical data? Other markets? Earnings? Sales? Free cash flow? Interest rates? Taylor Swift concert ticket prices?


The problem in trying to nail down fair value is there are so many different valuation measures to choose from.


Historical valuations. Robert Shiller has CAPE ratio data going back to 1871.


The current CAPE at nearly 30x inflation-adjusted trailing 10 year earnings certainly looks high relative to the 17.4x average if we go back to when Ulysses S. Grant was president.


But it’s not that much higher than the 27x average we’ve seen this century…


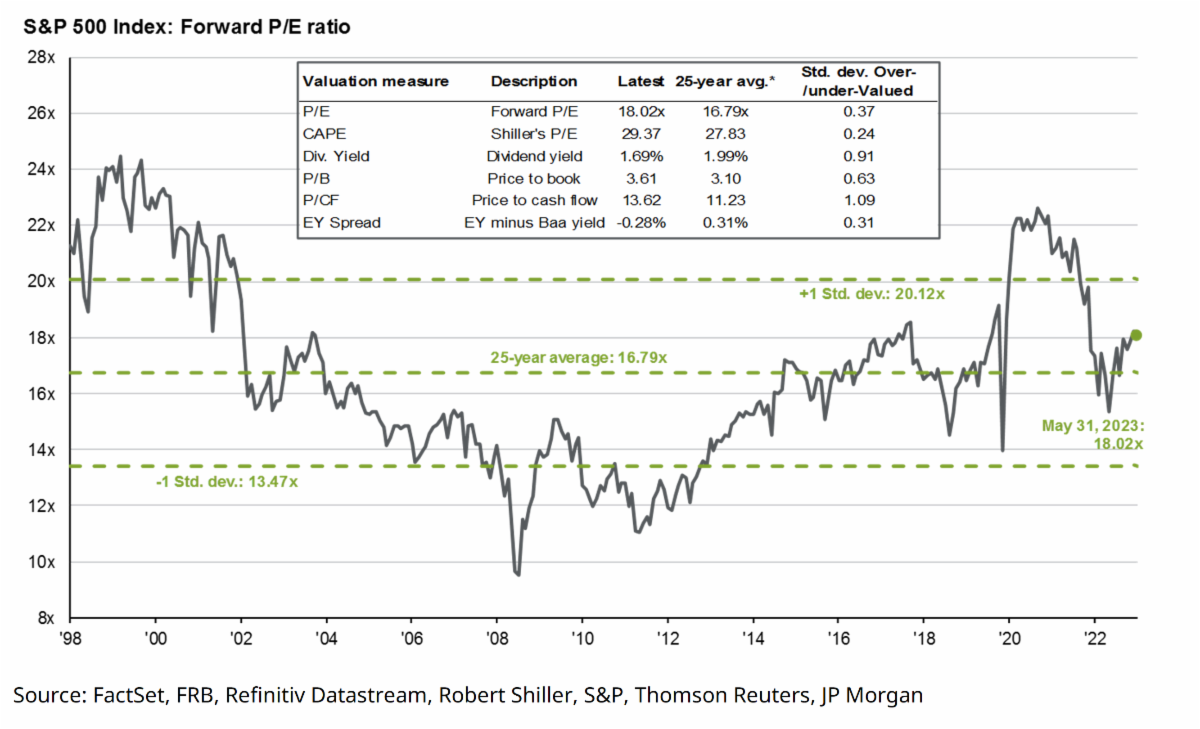
Relative valuations to recent history. JP Morgan has a chart that looks at valuations on the U.S. stock market using a bunch of different measures — earnings, CAPE, dividend yield, price-to-book, price-to-cash flow and the spread between the earnings yield and corporate bonds:

Things look a tad rich relative to the past 25 years but more or less in line with the averages…


Relative valuations. This is the first time in nearly two decades that bonds have given stocks a run for their money in terms of yields.


T-bills, muni bonds [on a tax equivalent basis] and corporate bonds are now all yielding over 5%. That’s a much higher hurdle rate than the yields investors were used to seeing in the 2010s and early pandemic years.


The inverse of the forward P/E ratio of 18.8x would give us an earnings yield on the S&P 500 of 5.3%. The earnings yield is higher for mid caps (7.4%) and small caps (7.5%).


I’m not suggesting that earnings yields can accurately predict future returns. They can’t.


But the spread between what you can earn on bonds and what you can earn on stocks has compressed considerably over the past 15 months or so...


The good news is it doesn’t seem like the stock market is egregiously overvalued at the moment. Some would even argue we’re trading at or near fair value but I’m not going to say that because I don’t like the phrase.”


The natural questions after a nice market run: Are we overvalued? Is this sustainable?


By most metrics, the stock market, as a whole, is nearly fairly valued. As always, there are sectors, factors, styles, and regions that are overvalued and undervalued. However, for diversified investors buying into a full market cycle, it’s an average starting point based on historical and relative valuations.


Another positive is the potential for returns in other asset classes like bonds, alternatives, and cash. For much of the last 20 years, the Fed’s zero interest rate policy created an environment that only rewarded stock investors (TINA – There Is No Alternative). That’s not the case anymore. Although over the long term, investors should continue to overweight portfolios towards growth and risk assets - the risk premium factor.

There Were Fewer Homes for Sale in May Than Any Other Month in More than a Decade.


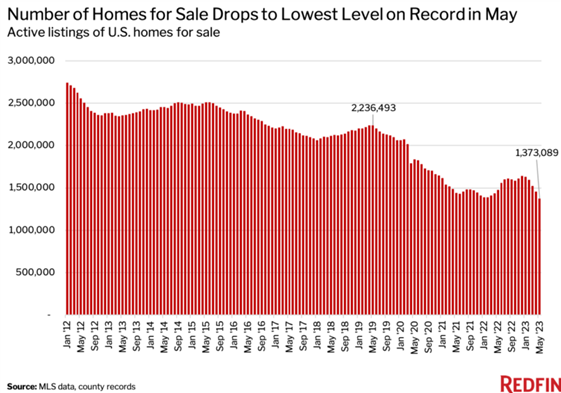
“The number of homes for sale in the U.S. fell 7.1% year over year to 1.4 million on a seasonally adjusted basis in May. That’s the lowest level in Redfin’s records, which date back to 2012, and the first annual decline since April 2022.

By comparison, there were 2.2 million homes for sale in May 2019—before the pandemic rocked the U.S. housing market—meaning housing supply was 38.6% below pre-pandemic levels this May.


America’s housing stock is dwindling because there are very few people selling homes. New listings of homes for sale declined 25.2% year over year in May to the third lowest level on record on a seasonally adjusted basis, as homeowners were handcuffed by high mortgage rates. 


Nearly every homeowner with a mortgage has an interest rate below 6%, meaning many are opting to stay put because selling and buying a new home would mean taking on a higher monthly mortgage payment. The average 30-year-fixed mortgage rate in May was 6.43%, up from 5.23% a year earlier and a record low of 2.65% in 2021…


As the pool of homes for sale shrinks, homebuyers in many markets are grappling with competition, which is preventing home prices from plunging despite a cooldown in buyer demand brought on by elevated mortgage rates.


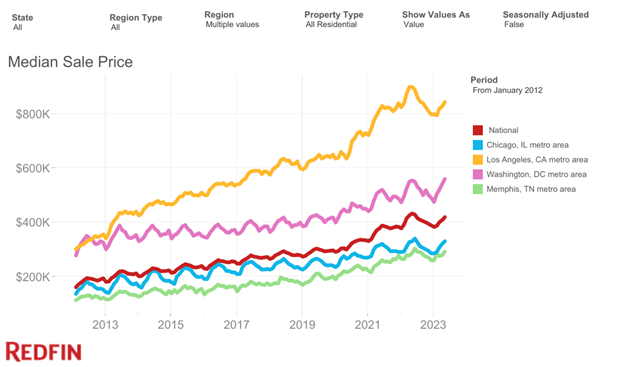
The median U.S. home sale price was $419,103 in May. That’s down just 3.1% from a year earlier, when prices hit a record high of $432,311.”

The Fed’s clumsy attack on inflation has stripped the housing market of supply as mortgage rates doubled in less than 2 years and effectively locked homeowners into their existing residences. Housing starts are on the rise, but the lag time and numbers are unlikely to make much of a dent in the imbalance. On the positive side, it has been enough to support elevated prices and therefore household net equity.

Read More
 

Graph of the Week

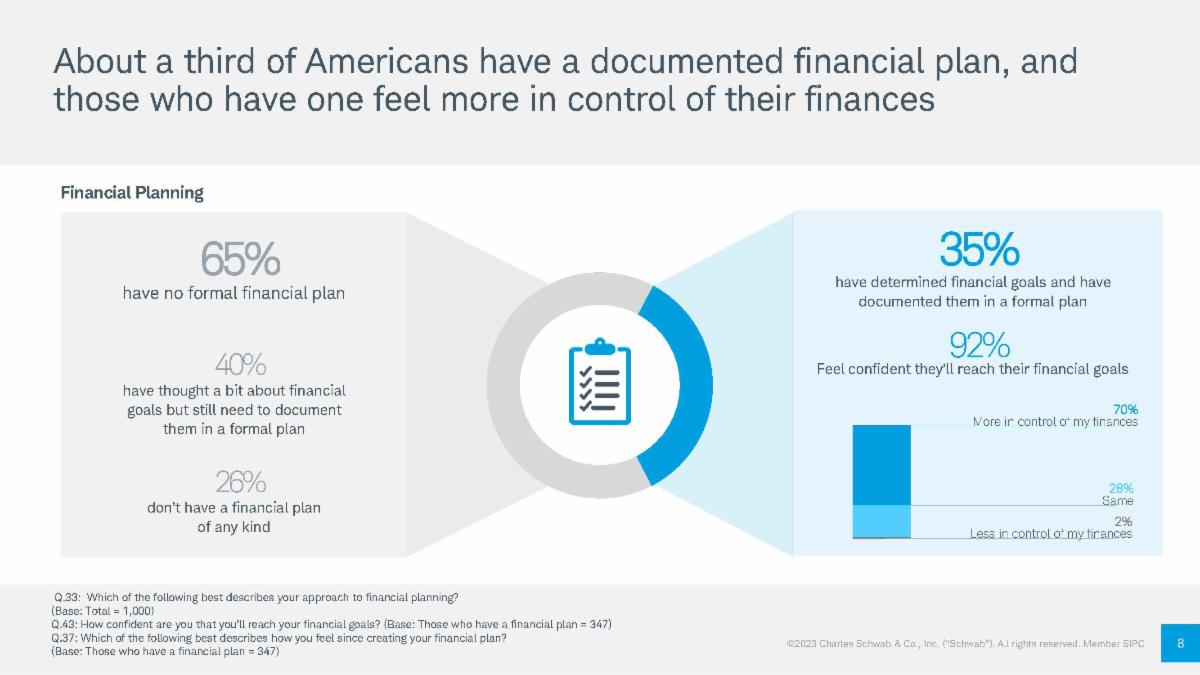
According to a national survey, 35% of Americans have a documented financial plan. Of those who do have a financial plan, 70% feel more in control of their finances, and 92% feel confident that they will reach their financial goals. 

Tweet of the Week

Thanks for reading. Have a great weekend!


Guidance for today. Growth for tomorrow.


RBGWA - Logo - Full Color.jpg

Tim Ellis, CPA/PFS, CFP®

CIO and Wealth Advisor

RBG Wealth Advisors

O: 901.244.2891 | C: 662.444.1415

E:  tellis@rbgwa.com

A:  5100 Wheelis Dr., Ste. 211, Memphis, TN 38117

W: rbgwa.com

LinkedIn  Twitter  Facebook

RBG Wealth Advisors LLC is a registered investment adviser. Information presented is for educational purposes only and does not intend to make an offer or solicitation for the sale or purchase of any specific securities, investments, or investment strategies. Investments involve risk and, unless otherwise stated, are not guaranteed. Be sure to first consult with a qualified financial adviser and/or tax professional before implementing any strategy discussed herein. Past performance is not indicative of future performance.