RBGWA - Logo - Full Color.png

RBG Wealth Weekly

June 30, 2023

Ladies and gentlemen, the weekend! In this space each week, Greg and I share some of our favorite articles, notes, and graphics from the past week along with our commentary. Please feel free to provide feedback and forward along to others if you enjoy. We appreciate you taking the time to read. 


If you are a client, we truly appreciate your business. If you are not a client, please click below to learn more about our firm and contact us.

Visit our Website

Articles of the Week

How a Flexible Spending Strategy Works


“The most popular retirement spending advice out there is the 4% rule. Based on research from William Bengen, the 4% rule assumes that you spend 4% of your portfolio each year and adjust it for inflation on a go-forward basis.


For example, if you retired with $1 million in assets and inflation was constant at 5% per year, you would spend $40,000 in year 1 [4% * $1 million], $42,000 in year 2, $44,100 in year 3, and so forth. This rule grew in popularity because of its simplicity and because it almost guaranteed that you wouldn’t run out of money.


But what if you could be more flexible with your spending? What if you reduced your spending in bad years? Would that allow you to spend more in good years? Yes! Depending on how flexible you can be, you could spend up to 5.5% of your portfolio instead of just 4%.


How is this possible? Because we follow a simple strategy that cuts our spending when we enter a correction or bear market. We will call this the Flexible Spending Strategy, and here’s how it works:


On December 31 of each year you check to see how far the S&P 500 is away from its all-time highs. Based on that number, you would fall into one of three possible spending conditions:


  • Normal market: If the S&P 500 is less than 10% away from its highs, you spend all of your discretionary spending in the next year.
  • Correction: If the S&P 500 is more than 10% away from its highs but less than 20% away from its highs, you spend half of your discretionary spending in the next year.
  • Bear market: If the S&P 500 is more than 20% away from its highs, you spend none of your discretionary spending in the next year.


But what do I mean by discretionary spending? Discretionary spending includes all the things in life that are nice to have, but not necessary for you in retirement…


I created the table below which shows the probability of you not running out of money for different discretionary spending levels and withdrawal rates over a 30-year retirement (using an 80/20 U.S. stock/bond portfolio).”

This was a nice, clean illustration with data on dialing up or down discretionary spending in retirement based on the market environment with clearly structured rules. It’s a variable that fits alongside sequence of returns risk and can make a meaningful impact on financial planning and cash flows in retirement.


If truly discretionary spending is 30% of total spending, the 4% rule can turn into the 5% rule.

Key Market Price Ratios Still Suggest Risk-On Bias Persists


“The US stock market has pulled back after briefly hitting a 14-month high on June 16, but there’s still a case for expecting the recent revival in risk-on sentiment to roll on and push markets higher in the near term.


‘We know it’s old news at this point, but on June 8, 2023, the S&P 500 entered a new bull market,’ write analysts at LPL Research. ‘After such a strong rally off the October lows, this young bull probably needs a breather.’

Looking at the stock market’s momentum bias via a pair of ETFs suggests that the bulls are still driving the trend. So-called high beta (i.e., high-risk) stocks (SPHB) vs. low-volatility (low risk) shares (SPLV) continue to point to more upside ahead…

Semiconductor shares (SMH), which are considered a proxy for risk appetite, are also showing strength relative to equities generally (SPY)…

Part of the reason for the improvement in market sentiment is related to the growing conviction that inflation has peaked, which is reflected in the weaker price trend lately for inflation-indexed Treasuries (TIP) vs. conventional Treasuries (IEF).”


Overall trends often tell investors more than short-term rallies and dips. Stock market technicals appear to be in a bullish trend, even with a couple of cooling / consolidation periods this quarter. Those are necessary and healthy. For a short amount of time, the U.S. stock market as measured by the S&P 500 was trading at more than 2 standard deviations above its 50-day moving average.


More importantly, the market ratios noted above, serving as historical indicators, are trending in positive directions.

Burns or Volcker?


“The one report we will be following the most is the one that might get the least media and investor attention: the Fed’s report on Tuesday about the money supply. No matter how you slice – M1, M2, or M3 – the key measures of the money supply have all been falling lately.


In turn, this means the Fed has been tight. It remains to be seen how quickly this tightness can get inflation back down to the Fed’s 2.0% target, but that’s where it would ultimately head if these measures of money remain in decline. Hence our focus on Tuesday’s report, where we will see whether monetary policy has stayed as tight as it’s been the past few months.


Meanwhile, for those still focused on short-term interest rates, back on June 14 the Fed tried to have its cake and eat it, too, when policymakers decided to refrain from raising rates but, at the same time, signaled two more quarter-point rate hikes later this year.


The most absurd part of all this is that the decision was unanimous; literally not one policymaker dissented from this “split the baby” tactic. We say it’s absurd because have you ever known even just two economists or policymakers to agree on everything? And yet the Fed is trying to represent itself as an organization with no alternative thoughts or narratives, as if it were part of the government of North Korea or the old Soviet Union.


Either way, while we recognize the absurdity of the Fed unanimously supporting skipping a rate hike while signaling two more later on this year, we think the Fed is likely to follow through on its projections of two more rate hikes. We are forecasting that when all is said and done that the economy ends up a little weaker than the Fed expects this year, but inflation stays higher than the Fed thinks. Combined, if we are right, that should keep the Fed on track to raise rates as it recently projected.


Ultimately Fed Chairman Powell has a decision to make: would he prefer to be remembered like Arthur Burns or Paul Volcker? Burns kept monetary policy too loose and let inflation reignite; he was respected at the time but now his name is Monetary Mudd. Paul Volcker tightened monetary policy to what was then considered excruciating levels in the early 1980s. Despised by many at the time, he’s now considered a great leader at the Fed, the slayer of the inflation dragon that Burns let loose.”


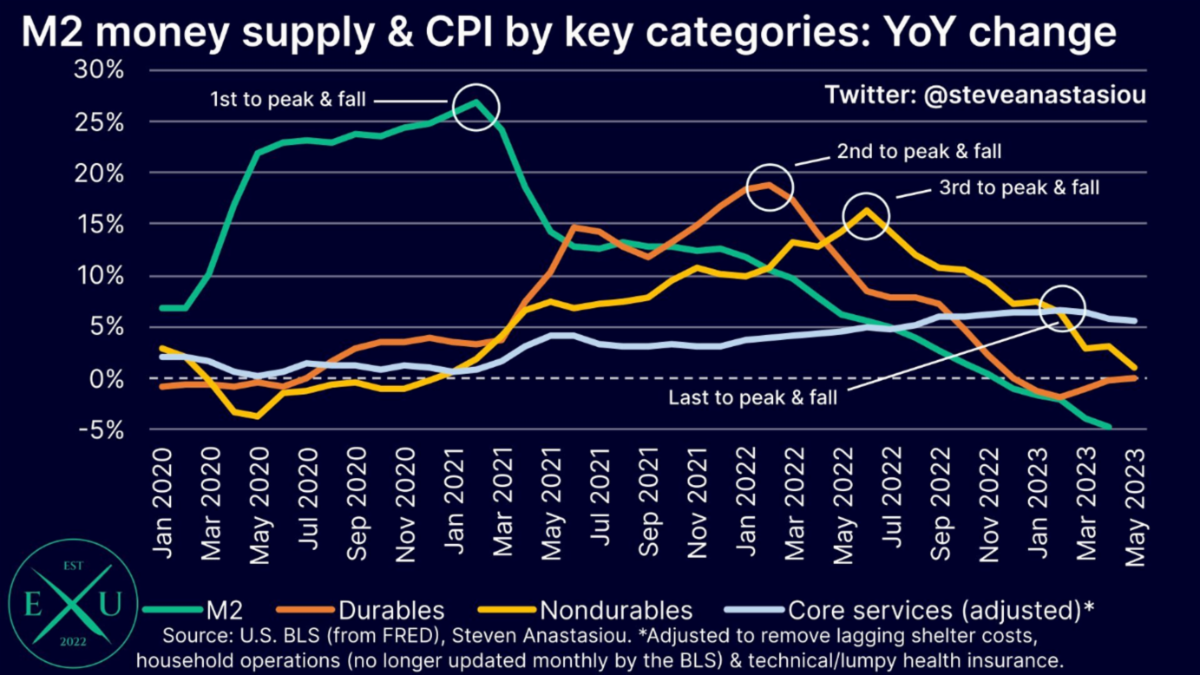
Please see the graph of the week and my commentary below on U.S. Money Supply. The quick preview is that while M2 money supply slightly increased from last month it has severely contracted from last year. Less money available undoubtedly, eventually will help with purchasing power (i.e., slowing inflation).

Read More

Graph of the Week

The U.S. M2 Money Supply growth measure which includes the total supply of cash and cash equivalents (currency, checking and savings deposits, CDs, money market funds, etc.) has been falling at a rapid pace over the last two years as post-pandemic fiscal spending shut off and the Federal Reserve reversed course on monetary policy.


This week, the Fed reported that the money supply decreased by 4% to $20.805 trillion in May compared to one year earlier. It’s also the sixth straight month to report year-over-year contractions. That’s the longest negative stretch since the measure was introduced in 1959.


It is one of the more underreported measures that impacts and indicates the course of inflation. We have seen peaks and disinflation in durable goods, nondurable goods, and now core services. Housing/shelter is the factor with the most lag.


To see all these measures falling and returning to normal levels as Fed officials continue hawkish speeches and testimony about raising interest rates another 0.50%, makes you question motivations and the actual data that is driving policy decisions.

Tweet of the Week

Thanks for reading. Have a great weekend!

Guidance for today. Growth for tomorrow.

RBGWA - Logo - Full Color.jpg

Tim Ellis, CPA/PFS, CFP®

CIO and Wealth Advisor

RBG Wealth Advisors

O: 901.244.2891 C: 662.444.1415

E:  tellis@rbgwa.com

A:  5100 Wheelis Dr., Ste. 211, Memphis, TN 38117

W: rbgwa.com

LinkedIn  Twitter  Facebook

RBG Wealth Advisors LLC is a registered investment adviser. Information presented is for educational purposes only and does not intend to make an offer or solicitation for the sale or purchase of any specific securities, investments, or investment strategies. Investments involve risk and, unless otherwise stated, are not guaranteed. Be sure to first consult with a qualified financial adviser and/or tax professional before implementing any strategy discussed herein. Past performance is not indicative of future performance.