RBGWA - Logo - Full Color.png
 

RBG Wealth Weekly

September 22, 2023


Ladies and gentlemen, the weekend! In this space each week, Greg and I share some of our favorite articles, notes, and graphics from the past week along with our commentary. Please feel free to provide feedback and forward along to others if you enjoy. We appreciate you taking the time to read. 


If you are a client, we truly appreciate your business. If you are not a client, please click below to learn more about our firm and contact us.

Visit our Website
 

Articles of the Week

Congress Scrambling to Avoid Government Shutdown


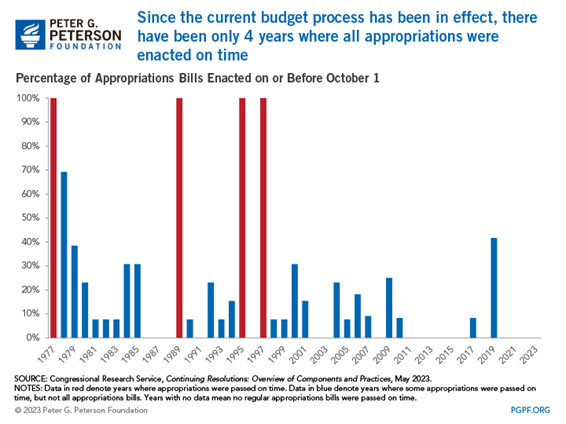
“Among the most basic responsibilities of Congress is funding federal government operations. Every year, lawmakers are supposed to pass the 12 appropriations bills that fund every government agency and program by September 30, in time for the start of the government's fiscal year on October 1.


But their track record for doing so is terrible. The last time all 12 bills had passed Congress by the deadline was 1997.

That produces an annual end-of-September drama on Capitol Hill as Congress scrambles to pass a ‘continuing resolution,’ a temporary extension of funding for a specific amount of time that keeps the government open and operating…


Without a continuing resolution, the government shuts down. The last shutdown lasted 35 days from late December 2018 to late January 2019—the longest shutdown ever…


Key economic data releases are likely to be delayed in a shutdown. The Bureau of Labor Statistics indicated earlier this week that it would "suspend data collection, processing and dissemination" if the government closes. That would likely impact the Job Openings and Labor Turnover Survey (JOLTS), due to be released on October 3, as well as the October 6 nonfarm payrolls report. A longer shutdown could impact the release of producer price index (PPI) and consumer price index (CPI) data, scheduled for release on October 11 and 12, respectively. All of this data will be critical for the Federal Reserve as it assesses the state of the economy in advance of its next monetary policy meeting on October 31 and November 1.


The Internal Revenue Service would continue to operate because last year's Inflation Reduction Act made additional funding available for the agency.


Non-essential government functions would stop during a shutdown…


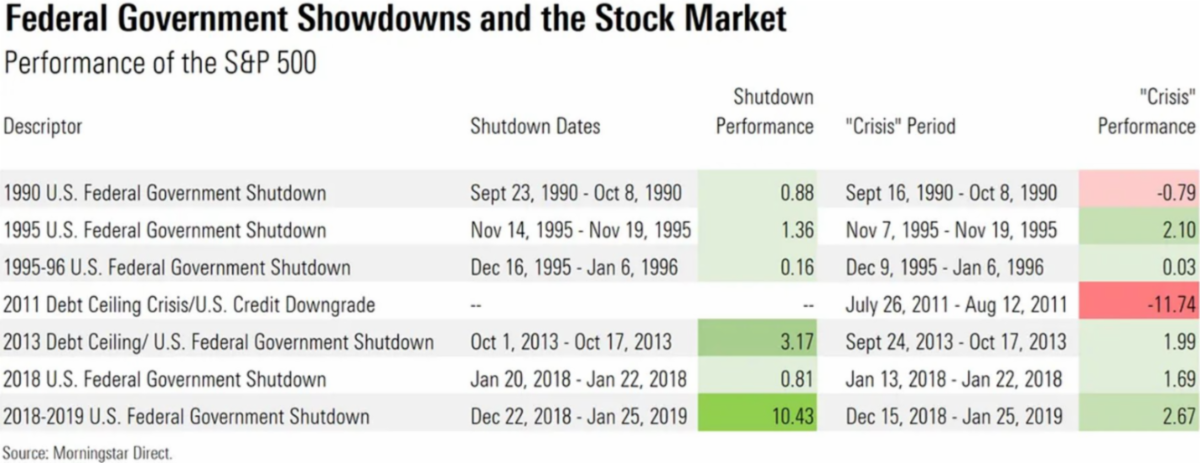
Historically, government shutdowns have not caused a major reaction in the markets. In fact, the S&P 500® has risen during the last five government shutdowns.


But shutdowns can increase market volatility. In the 2018-2019 shutdown, the S&P 500 dropped by 2.7% on the first trading day after the shutdown, rebounded nearly 5% on the next trading day and was up more than 10% by the end of the 35-day shutdown.”

It’s par for the course at this point, but we’re heading towards another federal government spectacle. The debt ceiling fight back in June which resulted in the Fiscal Responsibility Act (FRA) included some caps on discretionary spending for 2024 and 2025 as well as claw back of the expanded IRS budget in the Inflation Reduction Act. However, there are still some entrenched disagreements on spending levels overall and by program.


While shutdowns haven’t typically hindered stock market returns in the past, it’s not an ideal environment. There are ancillary issues like economic data reporting and SEC oversight, and potential economic issues from furloughed federal workers and contractors. 

Nobody Knows Anything, Dot Plot Edition


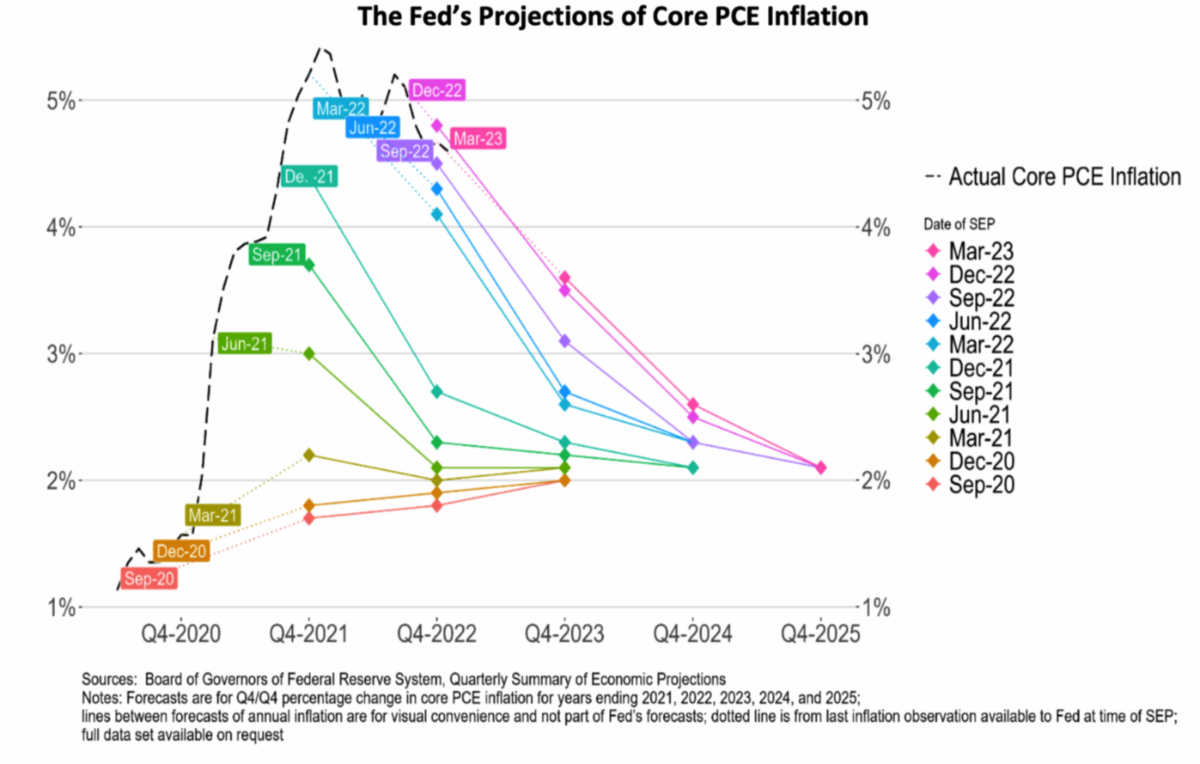
“The September Federal Reserve meeting is behind us we still have November and December ahead of us. Markets are nervous expecting another hike before the year’s over before two cuts in 2024. My advice: ignore those expectations as they have been wildly inaccurate over the past few years; they have been mostly inaccurate over the past decade.


When it comes to forecasting economic outcomes, the Fed is no better or worse than anybody else.


I know of no better authority to cite than Federal Reserve Chairman Jerome Powell, from his June 16, 2021 presser:


‘The dots are not a great forecaster of future rate moves. And that’s not because—it’s just because it’s so highly uncertain. There is no great forecaster of the future—so dots to be taken with a big, big grain of salt.’


What makes them different is that they do so very publicly and maintain an ongoing record of their forecasts about federal funds rates inflation and GDP. They may be terrible economic forecasters but give them credit for not burying bad predictions like so many on Wall Street tend to do. Credit to Powell for admitting what so many other economic prognosticators fail to do: Own up that they do not know what will happen in the future.


To wit: The Dot Plot.


Go to the Fed’s website, and search for “Summary of Economic Projections.” These are the quarterly summations that include the dot plots within them. Randomly grab a few, and scroll to the 4th to 8th page or so where the dot plots are found. Then compare them to what actually occurred, via the FOMC’s target federal funds rate or range, change (basis points) and level. The economic seriousness of this should prevent you from thinking ‘Hilarity ensues.’

The Federal Reserve’s FOMC wrapped another meeting this week without an interest rate increase, but their updated ‘dot plot’ showed that 12 members forecasted raising rates an additional 0.25% before year-end vs. 7 members forecasted remaining at current levels. It also showed rates remaining higher for longer.


Stocks continued their slide, and bond yields continued to rise.


Barry’s sentiment was to take it with a grain of salt. The Federal Reserve’s forecasts have been off during the bulk of the last two years, or at the very least, late to adjust. Some of this is purely hawkish rhetoric / signaling to try to work back closer to their 2% inflation target.

Treasury Market Plays Catch-Up with Higher-For-Longer Risk


“The collective wisdom of the bond market for much of this year has been betting that interest rates would soon peak and fall. But those bets appear to be unwinding in the wake of Wednesday’s Federal Reserve meeting and press conference.


Exhibit A is the rise in the 2- and 10-year Treasury yields, which are widely followed as key maturities for economic and financial markets analytics. On those fronts the crowd is reassessing its recent view that rate cuts are on the near-term horizon.


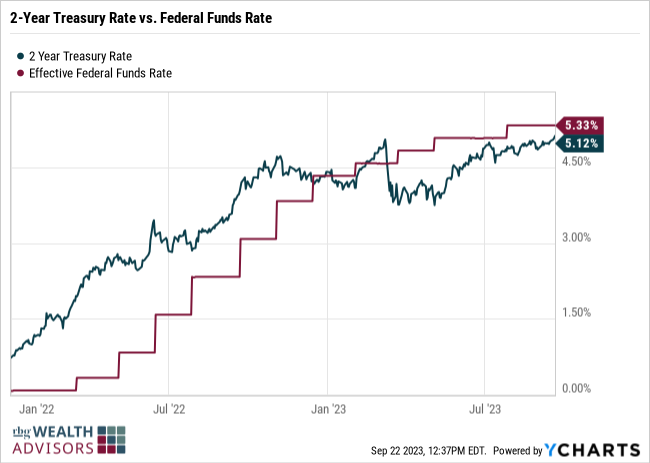
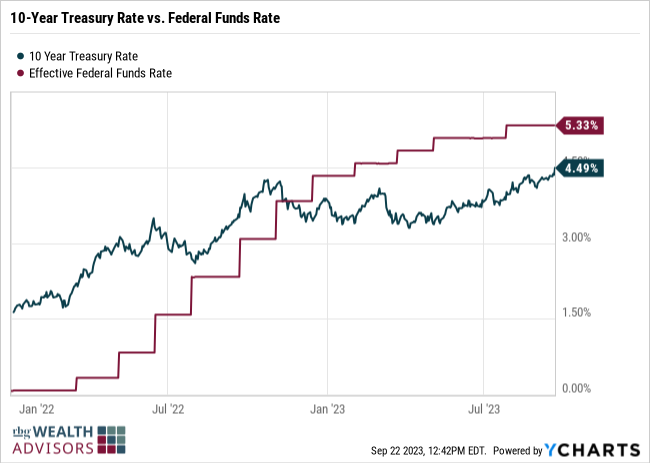
Let’s start with the 2-year Treasury yield, which is considered a proxy for market expectations on Fed policy. For much of this year the 2-year yield has traded below the effective Fed funds rate, which implies that the market expects the central bank’s rate hike will peak and perhaps reverse. But that view appears to be fading as the 2-year yield moves closer to the current 5.25%-to-5.50% Fed funds rate range.

The 10-year yield is pushing higher again too. In yesterday’s trading (Sep. 21), the benchmark rate rose to 4.49%, the highest since 2007.

By some accounts, the Fed appears to be on a path to leave rates higher for longer. Fed rate hikes may be over, or perhaps there’s one more in the pipeline, but rate cuts are expected to come later than recently expected…


The good news for investors is that the highest yields in ~15 years, either real or nominal, can be locked in with a buy-and-hold strategy. No one knows if current rates are at or near a peak, but this much is clear: the case for a relatively higher allocation to Treasuries vs. recent history hasn’t looked this compelling since George W. Bush was walking the floor in the Oval Office.”


Interest rates have now more than recovered from their drop in March during the banking failure turmoil.


There are a couple of positive takeaways here:


  1. Risk free rates are rising, which helps risk-return profiles and conservative investors.
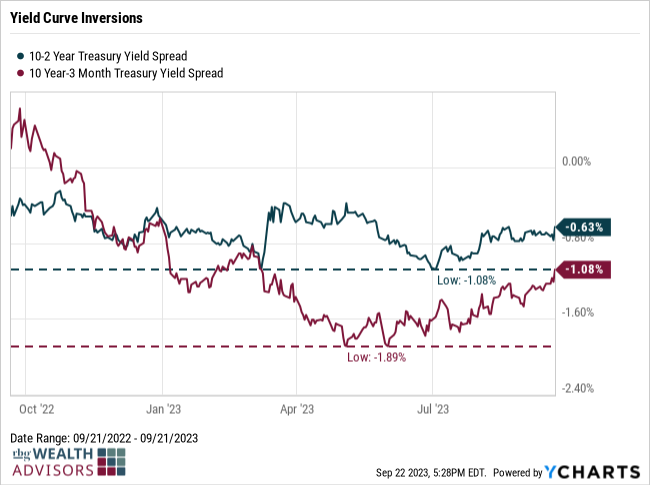
  2. Yield curve inversions are improving. The 10-2 year spread has moved from -1.89% to -1.08%, and the 10 year-3 month spread from -1.08% to -0.63%.
Read More
 

Graph of the Week

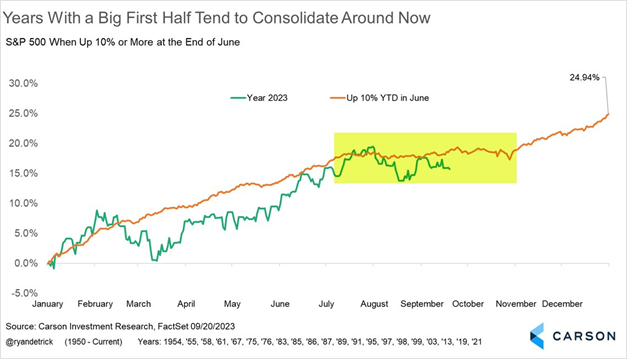
On average when the stock market starts off the year well (up 10%+ through June), there is typically a consolidation period from August through October. Then, the market resumes its climb up to an average of +24.94%. 🤞

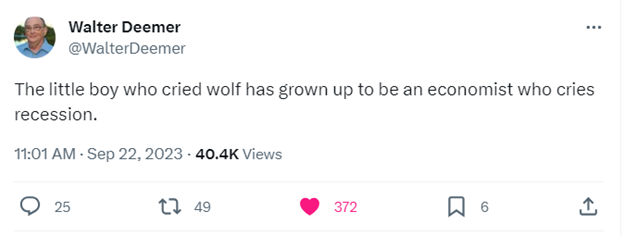
Tweet (or maybe X) of the Week

Thanks for reading. Have a great weekend!


Guidance for today. Growth for tomorrow.


RBGWA - Logo - Full Color.jpg

Tim Ellis, CPA/PFS, CFP®

CIO and Wealth Advisor

RBG Wealth Advisors

O: 901.244.2891 | C: 662.444.1415

E:  tellis@rbgwa.com

A:  5100 Wheelis Dr., Ste. 211, Memphis, TN 38117

W: rbgwa.com

LinkedIn  Twitter  Facebook

RBG Wealth Advisors LLC is a registered investment adviser. Information presented is for educational purposes only and does not intend to make an offer or solicitation for the sale or purchase of any specific securities, investments, or investment strategies. Investments involve risk and, unless otherwise stated, are not guaranteed. Be sure to first consult with a qualified financial adviser and/or tax professional before implementing any strategy discussed herein. Past performance is not indicative of future performance.