Hello!
It's time for your market stats update for the month of February! Below I'll go over the numbers and explain what exactly they mean and what trends to look out for.
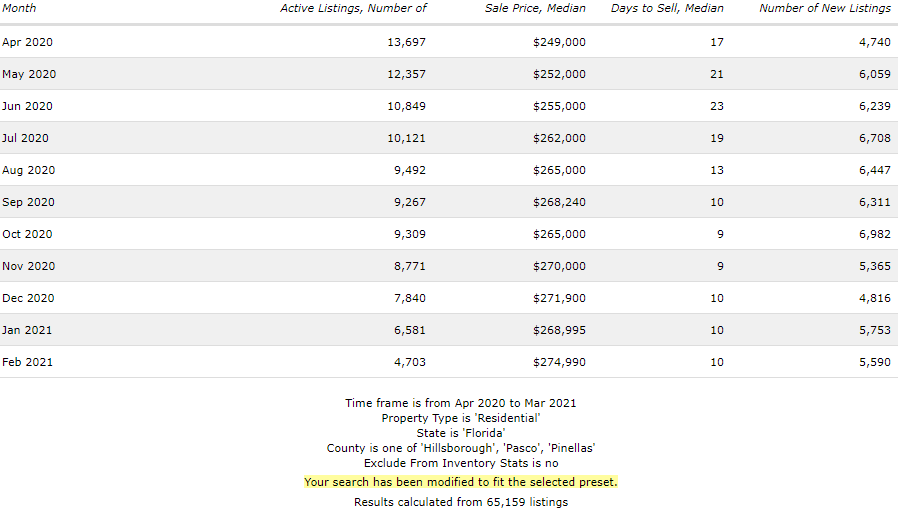
The Numbers- Looking above, as we can see, it seems to be more of the same as we've been seeing.
-
Active Number of Listings - Inventory has once again been SQUEEZED to a record low for the Tampa Bay Area, now only having 4,703 active listings throughout Pinellas, Pasco, and Hillsborough combined!
-
Median Sales Price - This past month we saw a 2.2% increase from month to month in terms of price. As I predicted in the last market update email, that February's price would continue to rise compared to previous months. Don't think a crash is coming just because you see a decrease in price in a single month.
-
Median Days to Sell - As you can see, this has pretty much stayed stale as previous months. Consistently within the last 6 months, the median for residential properties are taking between 9-11 days on the market before going under contract. As always, let me know if you're looking for something specific. I can get you properties before they even populate on Zillow or Realtor.com and with how fast things are moving, it is imperative you see those first.
-
Number of New Listings - Now that the typical winter/holiday slow down has ended, new properties hit the market at a consistent number compared to November/December. I expected them to be slightly more than January however, so I'm shocked to see a slight decrease. However, I'm willing to bet that there's a VERY good chance more properties hit the market in March than in February.