Lantern Wealth Advisors, LLC
35 Pinelawn Road
Suite 101E
Melville, NY 11747
(631) 454-2000
[email protected]
https://lanternwa.com/


Major Indexes For Week Ended 5/17/2019

Index Close Net Change % Change YTD YTD %
DJIA 25,764.00 -178.37 -0.69 +2,436.54 10.44
NASDAQ 7,816.28 -100.66 -1.27 +1,181.00 17.80
S&P500 2,859.53 -21.87 -0.76 +352.68 14.07
Russell 2000 1,535.76 -37.23 -2.37 +187.20 13.88
International 1,865.83 +0.73 0.04 +145.95 8.49
10-year bond 2.39% -0.07% -0.30%
30-year T-bond 2.82% -0.05% -0.20%
International index is MSCI EAFE index. Bond data reflect net change in yield, not price. Indices are unmanaged and you cannot directly invest in an index.


Forget Everything You Know About Inflation

If you grew up in the 1960s, '70s or '80s, you may want to forget everything you know about inflation.

It's very possible that the financial and economic conditions of your youth were an aberration in American history. Of course, this is important to how you manage your portfolio, especially a retirement portfolio.

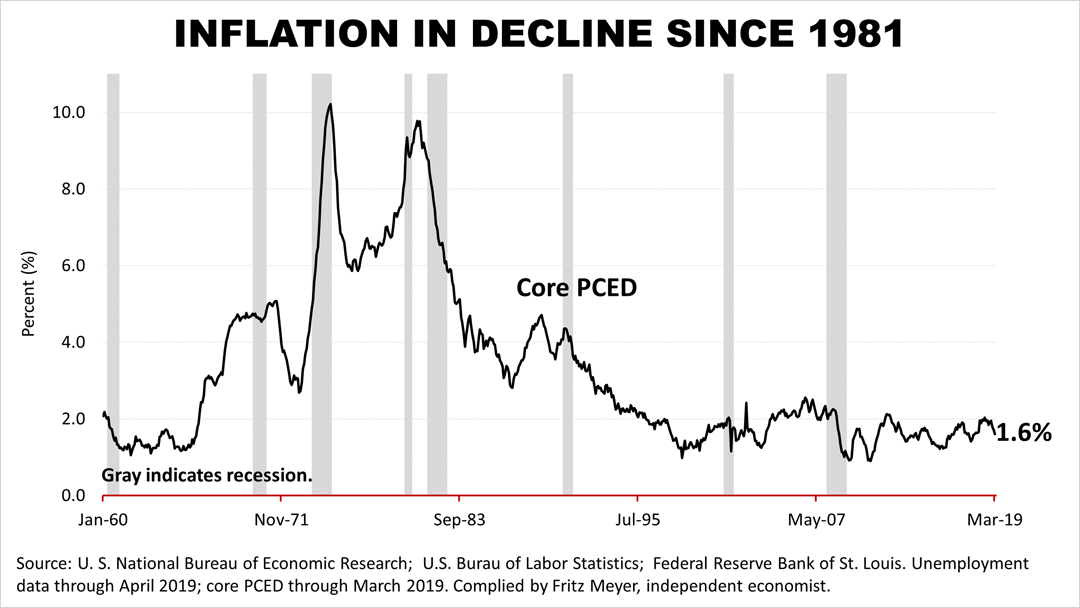
Shown in the black line is the Core Personal Consumption Expenditure Deflator (PCED), the inflation benchmark used by the Federal Reserve in setting interest-rate policy. The PCED is not as well-known as the Consumer Price Index, which is the inflation measure most often quoted in the media.

Core PCED, which excludes from the inflation calculation of volatile monthly household expenses, like energy, peaked in February 1975. It plunged for a couple of years before peaking again in January 1981. Since then, inflation has been in a steady decline.

For many decades before the aberrant period of the 1970s and '80s, the rate of inflation was about the same as today, according to data from independent economist Fritz Meyer, and investors don't think it's going higher.

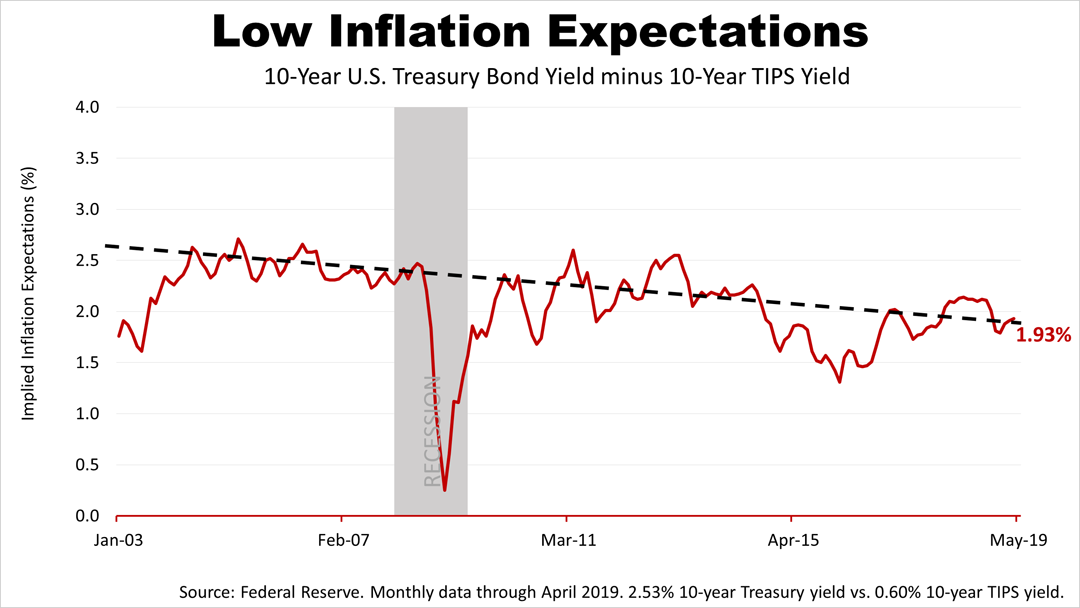
This chart gives you an idea of the dramatic change in the psychology of investors with regard to inflation.

The red line shows the difference in yield between a 10-year Treasury bond and a 10-year TIPS bond (Treasury Inflation Protected Securities). The black dotted line shows the slope of the decline in inflation expectations over the last 15 years.

As recently as March 2013, the yield on the 10-year TIPS was 2.6%, and investors in March 2013 expected an inflation rate of 2.6% over the coming 10 years. Six years later, investors recently expected annual inflation of 1.9%.

The 10-year TIPS yield, at 1.93%, tells us that investors expect inflation to average 1.93% annually for the next 10 years.

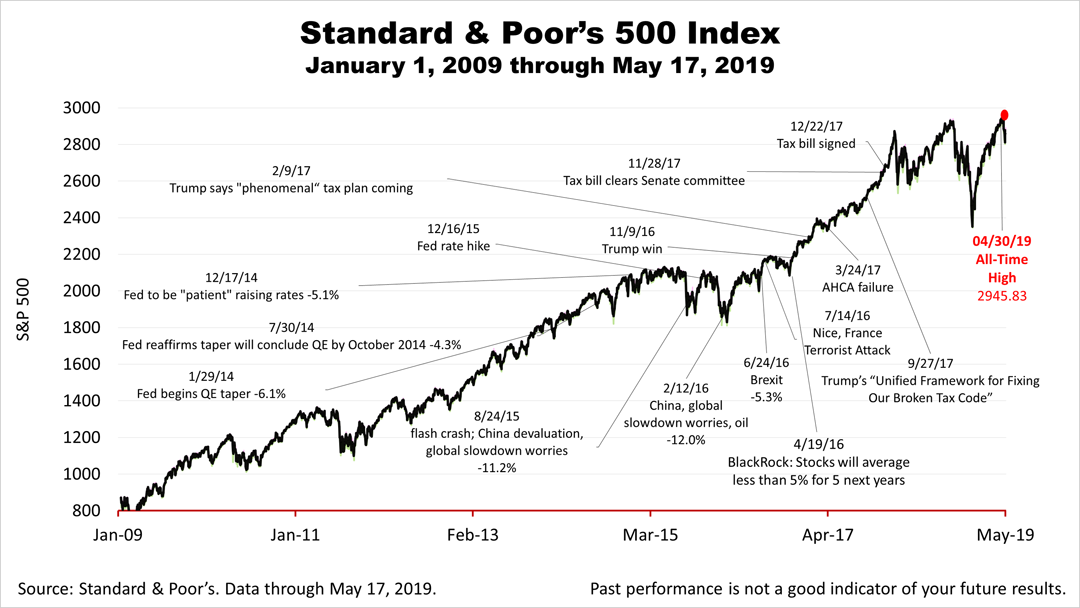
Over the long-run, economic fundamentals, like inflation, are a key underlying factor in corporate earnings, which drives stock prices. In the context of the lowest inflation rate in many decades and low inflation expected by investors for the decade ahead, economic fundamentals were strong recently. Confirmation of the strength came on Friday; the Index of U.S. Leading Economic Indicators, reported by the Conference Board, ticked up from its already historic recent highs.

The Standard & Poor's 500 closed lower for the week. At 2,859.53, the S&P 500 index was 3% from its all-time high on April 30th.

No one can reliably predict the market's next big move and past performance is not indicative of your future results. Stocks are only one asset class in a long-term strategically-designed portfolio and stock prices don't always reflect fundamental economic trends. However, over the long-run, economics and facts matter.


This article was written by a veteran financial journalist based on data compiled and analyzed by independent economist, Fritz Meyer. While these are sources we believe to be reliable, the information is not intended to be used as financial or tax advice without consulting a professional about your personal situation. Tax laws are subject to change. Indices are unmanaged and not available for direct investment. Investments with higher return potential carry greater risk for loss. No one can predict the future of the stock market or any investment, and past performance is never a guarantee of your future results.


How You Can Manage Risk Aversion

During the early part of 2017, the stock market was rolling merrily along, with the Dow Jones Industrial Average (DJIA) breaking through the 20,000-point barrier for the first time. But the "Trump bump" won't last forever and some prognosticators are forecasting eventual doom and gloom. In all likelihood, the stock market will continue to experience ups and downs, just like it has throughout its history.

Regardless of whether the market is going up or down, or staying relatively stable, your portfolio should reflect your personal aversion to risk. Primarily, there are three types of risk to address in this overall philosophy:

1. Risk of loss of principal: This is the risk of losing the money you initially invested. Say you buy a stock for $1,000 that jumps to $1,200 before it falls back to $900. If you sell the stock at that point, you will have lost $100 of principal.

2. Risk of loss of purchasing power: You may be willing to limp along with modest returns, but you're losing money if the inflation rate exceeds your rate of return. For instance, if you acquire a bank CD paying a 2% annual rate and inflation rises to 3.5%, you're losing 1.5% in the purchasing power of that investment.

3. Risk of outliving your savings: Is your investment plan overly conservative? Remember that the stock market historically has outperformed most comparable investments over long periods, although there are no absolute guarantees. Therefore, you're likely to fare better with a well-devised investment plan than you would if you stuffed your money under a mattress. Otherwise, you might outlive your savings, especially given recent increases in life expectancies.

Risk assessment surveys can provide some insights. Typically, an analysis will reveal that you tend to be either a conservative, moderate, or aggressive investor, within certain ranges. Your portfolio should reflect this characterization.

If you indicate a more conservative bent, you may want to fine-tune your investments accordingly, taking into account asset allocation and diversification methods. Again, these strategies do not offer any guarantees, nor do they protect against losses in declining markets, but they remain fundamentally sound.

Other potential ideas are to weight your portfolio more heavily to bonds than you did in your younger days. The technique of "bond laddering," with bonds maturing at different dates, is a variation on this theme. Similarly, conservative investors may emphasize dividend-paying stocks and blue chips, as well as mutual funds and exchange traded funds (ETFs) offering diversification.

Every situation is different. Reach out to us to address your specific concerns.


The above referenced information was obtained from reliable sources, however Lantern Investments, Inc. and Lantern Wealth Advisors, LLC cannot guarantee its accuracy. Opinions expressed herein are subject to change. Past performance is no guarantee of future results. Asset allocation and diversification do not assure a profit or protect against losses in declining markets. Any information given on the site is informational and illustrative but does not recommend actions as the information may not be appropriate to all situations. It is important that you consider your tolerance for risk and investment goals when making investment decisions. Investing in securities does involve risk and the potential of losing money. Links to other sites are provided for your convenience. Lantern Wealth Advisors, LLC and Lantern Investments, Inc. do not endorse, verify or attest to the accuracy of the content of the web sites that are linked and accept no responsibility for their use or content. Lantern Wealth Advisors, LLC and Lantern Investments, Inc. do not provide tax, accounting or legal advice.