Lantern Wealth Advisors, LLC
35 Pinelawn Road
Suite 101E
Melville, NY 11747
(631) 454-2000
[email protected]
https://lanternwa.com/


Major Indexes For Week Ended 6/14/2019

Index Close Net Change % Change YTD YTD %
DJIA 26,089.61 +105.67 0.41 +2,762.15 11.84
NASDAQ 7,796.66 +54.56 0.70 +1,161.38 17.50
S&P500 2,886.98 +13.64 0.47 +380.13 15.16
Russell 2000 1,522.50 +8.11 0.54 +173.94 12.90
International 1,870.17 -5.45 -0.29 +150.29 8.74
10-year bond 2.09% +0.01% -0.60%
30-year T-bond 2.59% +0.02% -0.43%
International index is MSCI EAFE index. Bond data reflect net change in yield, not price. Indices are unmanaged and you cannot directly invest in an index.


The Explosion In Real Retail Sales You Never Hear About

A retail sales boom is being muted by inflation, but it is real and becomes visible only after factoring in inflation.

Since consumers drive 70% of U.S. growth, retail sales are an important fundamental in measuring the strength of the economy relative to history.

The retail sales numbers, when adjusted for inflation, reveal that a retail explosion has been ongoing for years, but the media has missed it. A search of Google for news about "retail sales" returned these top stories on Friday afternoon, hours after the release of the May retail sales figures by the U.S. Census Bureau.

The media gets a press release with the nominal retail sales data, which masks the retail explosion underway for a decade. They're not economists and they don't know that adjusting retail sales data for inflation better reflects the surge in purchasing power underway for a decade.

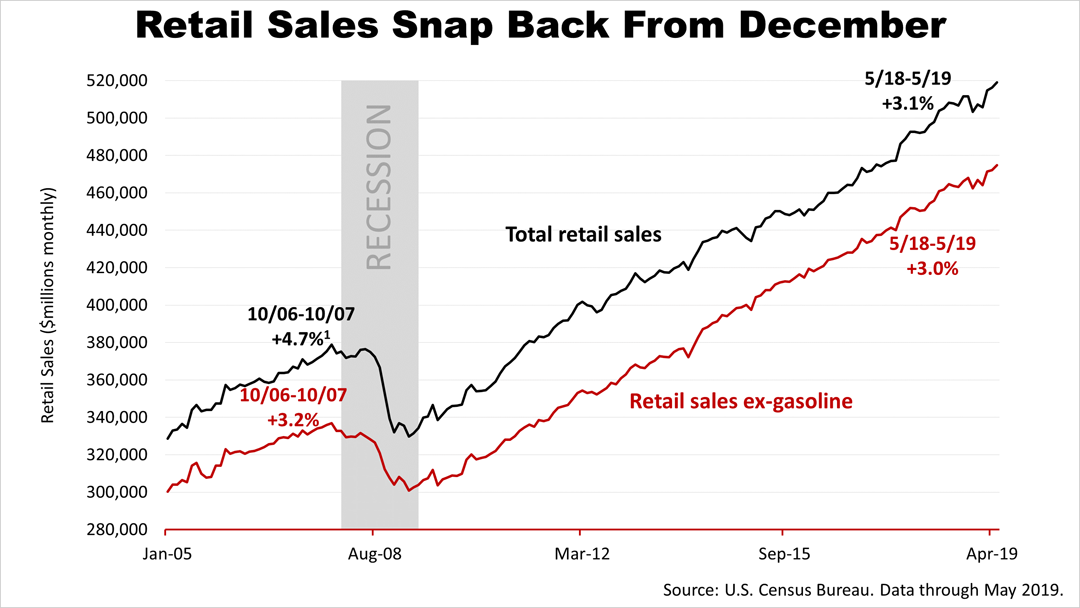
Based on Friday's release, retail sales in the 12-months through May 31st were up 3.1%. Excluding volatile gasoline prices, which can distort the monthly figures, retail sales in this 12-month period through May rose 3%, which is not bad but not a boom.

Compared with the 3.2% peak 12-month period in the last economic boom, in 2006 and 2007, the 3% improvement in retail sales in the most recent 12 months is not impressive.

After adjusting for inflation, however, the boom is clear and loud.

"Real" after-inflation retail sales, excluding gasoline, were up 2% in the 12 months through May, but what's more important is the longer-term. Compared with the 2006-2007 economic expansion, retail sales of the last 12 months were booming.

Real retail sales were flat throughout the peak years of the last economic expansion. This 10-year expansion, which is only days away from officially becoming the longest expansion in modern U.S. history, is largely fueled by the steep growth trajectory in real retail sales for the last decade, and it gets no coverage in the media!

The Standard & Poor's 500 index was up fractionally from a week ago, closing on Friday at 2,886.98, just 3% from its April 30th all-time high.


This article was written by a veteran financial journalist based on data compiled and analyzed by independent economist, Fritz Meyer. While these are sources we believe to be reliable, the information is not intended to be used as financial or tax advice without consulting a professional about your personal situation. Tax laws are subject to change. Indices are unmanaged and not available for direct investment. Investments with higher return potential carry greater risk for loss. No one can predict the future of the stock market or any investment, and past performance is never a guarantee of your future results.


How You Can Manage Risk Aversion

During the early part of 2017, the stock market was rolling merrily along, with the Dow Jones Industrial Average (DJIA) breaking through the 20,000-point barrier for the first time. But the "Trump bump" won't last forever and some prognosticators are forecasting eventual doom and gloom. In all likelihood, the stock market will continue to experience ups and downs, just like it has throughout its history.

Regardless of whether the market is going up or down, or staying relatively stable, your portfolio should reflect your personal aversion to risk. Primarily, there are three types of risk to address in this overall philosophy:

1. Risk of loss of principal: This is the risk of losing the money you initially invested. Say you buy a stock for $1,000 that jumps to $1,200 before it falls back to $900. If you sell the stock at that point, you will have lost $100 of principal.

2. Risk of loss of purchasing power: You may be willing to limp along with modest returns, but you're losing money if the inflation rate exceeds your rate of return. For instance, if you acquire a bank CD paying a 2% annual rate and inflation rises to 3.5%, you're losing 1.5% in the purchasing power of that investment.

3. Risk of outliving your savings: Is your investment plan overly conservative? Remember that the stock market historically has outperformed most comparable investments over long periods, although there are no absolute guarantees. Therefore, you're likely to fare better with a well-devised investment plan than you would if you stuffed your money under a mattress. Otherwise, you might outlive your savings, especially given recent increases in life expectancies.

Risk assessment surveys can provide some insights. Typically, an analysis will reveal that you tend to be either a conservative, moderate, or aggressive investor, within certain ranges. Your portfolio should reflect this characterization.

If you indicate a more conservative bent, you may want to fine-tune your investments accordingly, taking into account asset allocation and diversification methods. Again, these strategies do not offer any guarantees, nor do they protect against losses in declining markets, but they remain fundamentally sound.

Other potential ideas are to weight your portfolio more heavily to bonds than you did in your younger days. The technique of "bond laddering," with bonds maturing at different dates, is a variation on this theme. Similarly, conservative investors may emphasize dividend-paying stocks and blue chips, as well as mutual funds and exchange traded funds (ETFs) offering diversification.

Every situation is different. Reach out to us to address your specific concerns.


The above referenced information was obtained from reliable sources, however Lantern Investments, Inc. and Lantern Wealth Advisors, LLC cannot guarantee its accuracy. Opinions expressed herein are subject to change. Past performance is no guarantee of future results. Asset allocation and diversification do not assure a profit or protect against losses in declining markets. Any information given on the site is informational and illustrative but does not recommend actions as the information may not be appropriate to all situations. It is important that you consider your tolerance for risk and investment goals when making investment decisions. Investing in securities does involve risk and the potential of losing money. Links to other sites are provided for your convenience. Lantern Wealth Advisors, LLC and Lantern Investments, Inc. do not endorse, verify or attest to the accuracy of the content of the web sites that are linked and accept no responsibility for their use or content. Lantern Wealth Advisors, LLC and Lantern Investments, Inc. do not provide tax, accounting or legal advice.