Lantern Wealth Advisors, LLC
35 Pinelawn Road
Suite 101E
Melville, NY 11747
(631) 454-2000
[email protected]
https://lanternwa.com/

During these stressful times, it’s important to keep perspective. If you have concerns, please reach out to your financial professional. We wish you all good health and we will all come through this together.


Major Indexes For Week Ended 4/3/2020

Index Close Net Change % Change YTD YTD %
DJIA 21,052.53 -584.25 -2.70 -7,485.91 -26.23
NASDAQ 7,373.08 -129.30 -1.72 -1,599.52 -17.83
S&P500 2,488.65 -52.82 -2.08 -742.13 -22.97
Russell 2000 1,052.05 -79.94 -7.06 -616.42 -36.95
International 1,487.08 -62.41 -4.03 -549.86 -26.99
10-year bond 0.58% -0.16% -1.34%
30-year T-bond 1.21% -0.12% -1.15%
International index is MSCI EAFE index. Bond data reflect net change in yield, not price. Indices are unmanaged and you cannot directly invest in an index.


What Investors Should Expect And A Business Owner Alert

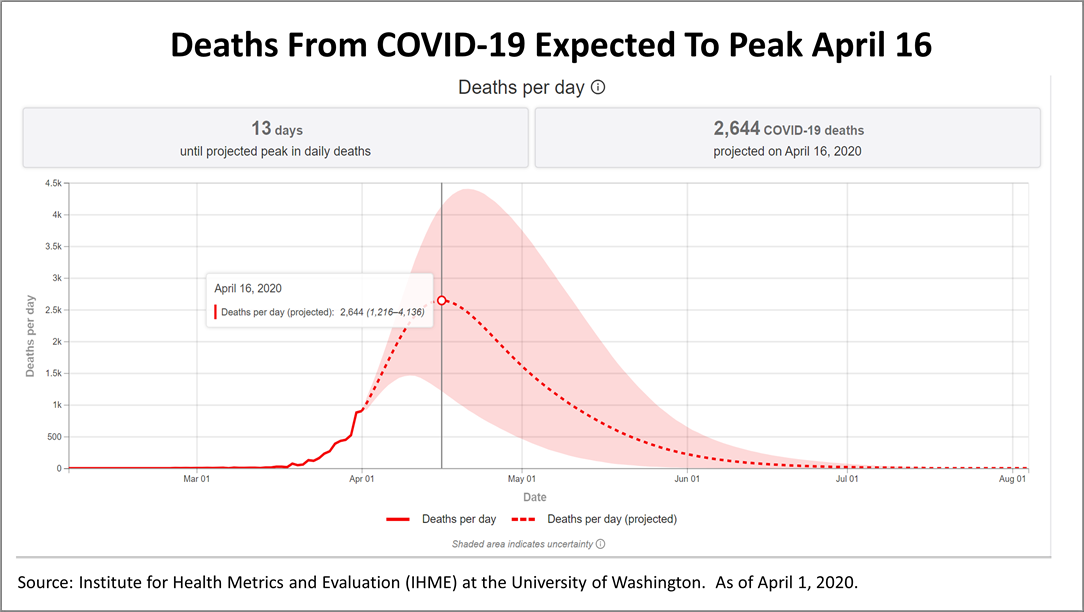
(April 3, 2020, 7 p.m. EST) - The latest forecasts indicate deaths nationwide from COVID-19 could peak April 15. Precisely when the worst will pass depends on adherence to social distancing, hospital utilization and other variables. Other models say the worst may not come for six or eight weeks.

The April 1 forecast from the Institute for Health Metrics and Evaluation (IHME) at the University of Washington, which is reportedly relied upon by the White House Coronavirus Task Force, indicates deaths in the U.S. from COVID-19 will peak April 16, assuming adherence to social distancing measures promulgated by states. The IHME receives funding from The Bill and Melinda Gates Foundation and the State of Washington.

Financial uncertainty may subside after the worst of the crisis passes.

Note- Uncertaintyis the range of values that is likely to include the correct projected estimate for a given data category. Larger uncertainty intervals can result from limited data availability, small studies, and conflicting data, while smaller uncertainty intervals can result from extensive data availability, large studies, and data that are consistent across sources. The model presented in this tool has a95% uncertainty intervaland is represented by the shaded area.

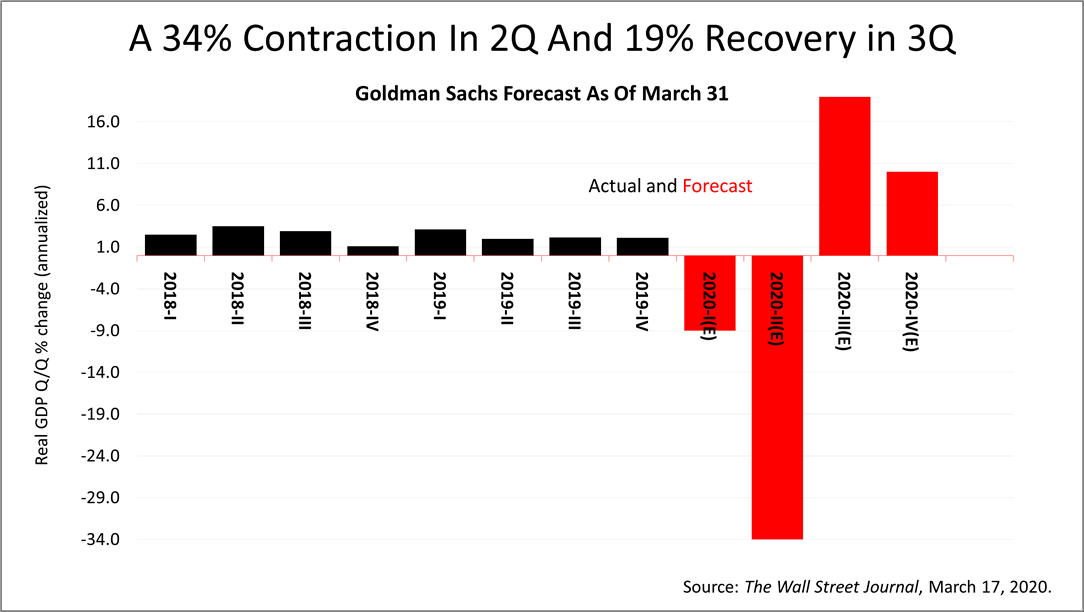
Wall Street's forecast for this second quarter of 2020, which began April 1, is exemplified in this prediction from Goldman Sachs Group. Goldman lowered its second-quarter forecast for U.S. economic growth from a week earlier, lowering its grim prediction for a 24% contraction to an even grimmer 34% drop in U.S. economic activity. Such a plunge is without precedent.

Almost as stunning is the recovery. Annualized, the growth rate in the third quarter is expected to be 19%! Goldman's forecast is more extreme than JP Morgan's, but they are in alignment directionally.

The bar chart shows the economic whiplash to expect, but the change will occur over weeks and not all in a day. The deadliest days will not flick a switch and the return to normalcy will take many months.

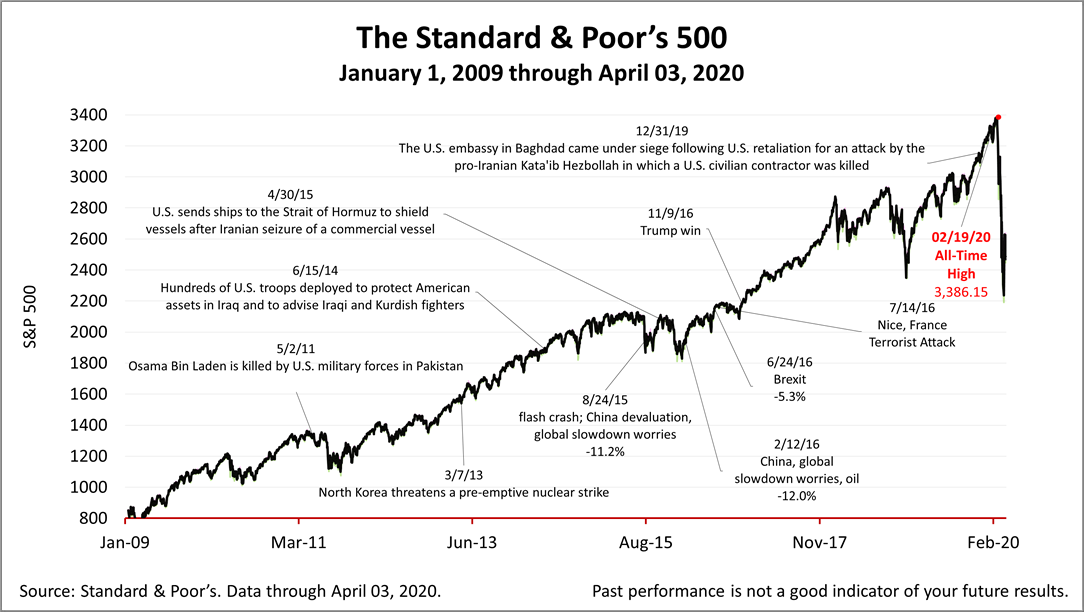
The Standard & Poor's 500 index, a benchmark of the value of America's largest 500 publicly traded companies, free markets, and a proxy for world progress, closed Friday at 2,488.65, down from 2541.46 a week ago.

While financial effects of the crisis are unfolding, the U.S. Government's response is massive. If you own a business and have questions about the Paycheck Protection Program or the CARESAct, please contact our office as soon as possible. Financial aid from the U.S. Government Small Business Administration is on a first-come, first-served basis.


The Standard & Poor's 500 (S&P 500) is an unmanaged group of securities considered to be representative of the stock market in general. It is a market-value weighted index with each stock's weight proportionate to its market value. Index returns do not include fees or expenses. Investing involves risk, including the loss of principal, and past performance is no guarantee of future results. The investment return and principal value of an investment will fluctuate so that an investor's shares, when redeemed, may be worth more or less than their original cost. Current performance may be lower or higher than the performance quoted.

Nothing contained herein is to be considered a solicitation, research material, an investment recommendation, or advice of any kind, and it is subject to change without notice. It does not take into account your investment objectives, financial situation, or particular needs. Product suitability must be independently determined for each individual investor.

This material represents an assessment of the market and economic environment at a specific point in time and is not intended to be a forecast of future events or a guarantee of future results. Forward-looking statements are subject to certain risks and uncertainties. Actual results, performance, or achievements may differ materially from those expressed or implied. Information is based on data gathered from what we believe are reliable sources. It is not guaranteed as to accuracy, does not purport to be complete, and is not intended to be used as a primary basis for investment decisions.


Boomers Working Past Age 65 Are A Surprise Boost

Americans over age 65 are staying in the labor force more often than expected, brightening the U.S. economic forecast and the outlook for U.S. stocks.

Turns out, the offspring of The Greatest Generation, those who served in World War II, deserve some respect, too. Baby boomers are characterized by a strong work ethic, and they are electing to work longer than government experts expected. Boomers are a key reason the economy continues to grow even as the labor market has tightened.

The Congressional Budget Office's long-term growth forecast did not count on so many boomers working past age 65. With new jobs continuing to be filled by a larger than expected number of workers in the 65-plus age group, U.S. GDP (gross domestic product) is benefitting from an unexpected boost, and it's no small thing.

Labor force growth is a key fundamental in math economics: total growth of the U.S. economy is the product of the labor force growth rate and productivity growth. The unexpected addition of workers in the labor force improves forecasts for economic growth in the years ahead.

Historically, the economy is unable to continue to create new jobs because we run out of people to fill them. Newly-created positions drive wages higher, increasing inflation, and then the Federal Reserve makes a monetary policy mistake, which results in two consecutive quarters of shrinkage in economic activity, aka, a recession. But these times are different.

This chart captures a snapshot of Americans choosing to continue working past age 65 more often than expected by forecasters. The Congressional Budget Office, a federal agency widely recognized as an authoritative non-partisan source, in January 2017 forecasted a decline in the labor force along the lines in red. The stair-step decline in the labor force that the CBO expected is not happening! The labor force participation rate has continued to grow since 2017, when it was expected to flatten and start a long decline, and no one is certain how long the trend will continue.

The labor force participation rate is reflecting the improved longevity of Americans, which the CBO economists did not figure on in their estimates of the future. If the trend since 2017 were to continue, the U.S. labor force could contribute a totally unexpected boost of growth in consumer spending in the years ahead, and consumers account for 70% of GDP. Higher consumer spending boosts earnings of corporate America and that's good for stocks.

Let us know if you would like a special report on how U.S. demographics are affecting strategic portfolio asset allocation decisions.


This article was written by a veteran financial journalist. While these are sources we believe to be reliable, the information is not intended to be used as financial or tax advice without consulting a professional about your personal situation. Tax laws are subject to change. Indices are unmanaged and not available for direct investment. Investments with higher return potential carry greater risk for loss. No one can predict the future of the stock market or any investment, and past performance is never a guarantee of your future results.


The above referenced information was obtained from reliable sources, however Lantern Investments, Inc. and Lantern Wealth Advisors, LLC cannot guarantee its accuracy. Opinions expressed herein are subject to change. Past performance is no guarantee of future results. Asset allocation and diversification do not assure a profit or protect against losses in declining markets. Any information given on the site is informational and illustrative but does not recommend actions as the information may not be appropriate to all situations. It is important that you consider your tolerance for risk and investment goals when making investment decisions. Investing in securities does involve risk and the potential of losing money. Links to other sites are provided for your convenience. Lantern Wealth Advisors, LLC and Lantern Investments, Inc. do not endorse, verify or attest to the accuracy of the content of the web sites that are linked and accept no responsibility for their use or content. Lantern Wealth Advisors, LLC and Lantern Investments, Inc. do not provide tax, accounting or legal advice.