| |
Stay Informed
Follow us on Social Media for more frequent updates
| |
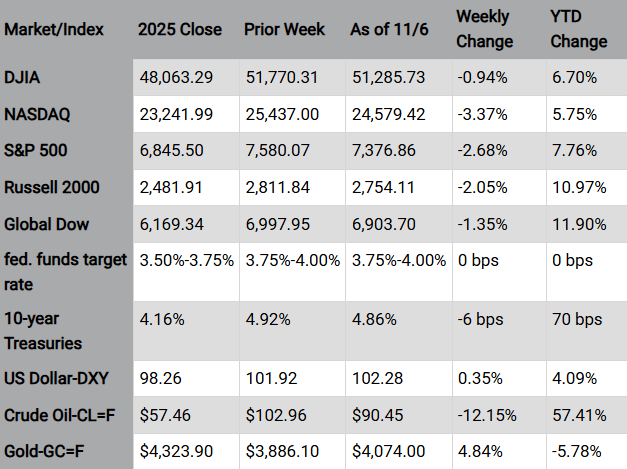
The Markets (as of market close November 6, 2026)
Wall Street experienced a volatile week, with investors shunning risk following the November midterm elections. Concerns about the political impact on the technology sector, particularly AI, triggered a notable sell-off last Thursday. A partial rebound at the end of the week's trading, likely buoyed by an unexpectedly strong jobs report (see below), wasn't enough to reverse prior market losses. Each of the benchmark indexes listed here declined as deteriorating investor sentiment permeated most sectors. Consumer discretionary shares showed resilience, as did communication services and real estate. Energy and information technology sustained notable losses. Long-term bond yields remained steady compared to the prior few weeks. Crude oil prices declined, although the risk of renewed U.S.-Iran military escalation could threaten Middle East oil supplies.
| |
Chart reflects price changes, not total return. Because it does not include dividends or splits, it should not be used to benchmark performance of specific investments. | | |
11/10: Consumer Price Index
11/12: Existing home sales, Treasury monthly statement
11/13: Producer Price Index
| | | | |  |
Meet with a Independent Financial Advisor, with over 20 years of Experience | | | Last Week's Economic News | |
- Job gains exceeded expectations in October after employment rose by 165,000, well above the average monthly gain of 48,000 over the prior 12 months. The change in employment for August was revised up by 53,000, from +133,000 to +186,000, and the change for September was revised up by 31,000, from +29,000 to +60,000. With these revisions, employment in August and September combined was 84,000 higher than previously reported. In October, both the unemployment rate, at 4.1%, and the number of unemployed people, at 7.1 million, changed little. The unemployment rate has remained in a narrow range of 4.1% to 4.3% since March. The number of long-term unemployed (those jobless for 27 weeks or more), at 2.0 million, changed little over the month. The long-term unemployed accounted for 27.6% of all unemployed people. Both the labor force participation rate (61.9%) and the employment-population ratio (59.3%) ticked up 0.1 percentage point. In October, average hourly earnings increased by $0.14, or 0.4%, to $38.00. Over the past 12 months, average hourly earnings have increased by 3.1%. The average workweek remained at 34.4 hours in October.
- According to the latest report from S&P Global, the manufacturing sector continued to expand in October but at a slower pace than in the previous month. The S&P Global US Manufacturing Purchasing Managers' Index™ registered 54.9 in October, down from 55.9 in September. Production and new orders increased, albeit at slower growth rates than in September. Price inflation for input costs surged, reaching its highest level since May. Manufacturers widely reported that energy, fuel, tariffs, and transportation expenses had risen since September and were key in driving up wider vendor prices.
- The services sector also experienced a strong month of October. The S&P Global US Services PMI® registered 56.1 last month, well above the 50.0 no-change mark but marginally below the September reading of 58.8. Incoming new business rose sharply amid reports of positive market demand, prompting companies to take on additional staff. However, growth rates in October for activity and new business were below September's recent highs, reflecting elevated inflation and heightened uncertainty in the outlook. Operating expenses rose sharply due to elevated fuel prices, while service providers raised their own output prices to compensate for the increased input costs.
- The number of job openings, at 7.5 million, rose 333,000 in September, according to the latest Job Openings and Labor Turnover Summary. The number of hires ticked up 131,000 to 5.4 million, while the number of separations increased 144,000 to 5.3 million. Within separations, the number of quits increased by 321,000 in September, while the number of layoffs and discharges fell by 127,000.
- According to the latest report from the Bureau of Economic Analysis, released November 4, the goods and services trade deficit was $105.00 billion in September, down $0.7 billion, or 0.7%, from the previous month's estimate. September exports were $321.5 billion, $5.8 billion, or 1.9%, more than August exports. September imports were $426.6 billion, $5.2 billion, or 1.2%, more than August imports. So far this year, the goods and services deficit decreased $92.4 billion, or 12.2%, from the same period in 2025. Exports increased $297.3 billion, or 11.6%. Imports increased $204.9 billion, or 6.2%.
- For the week ended October 31, there were 189,000 new claims for unemployment insurance, a decrease of 6,000 from the previous week's level, which was revised up by 1,000. According to the Department of Labor, the advance rate for insured unemployment claims for the week ended October 24 was 1.1%, unchanged from the prior week's rate. The advance number of those receiving unemployment insurance benefits during the week ended October 24 was 1,718,000, an increase of 23,000 from the previous week's level, which was revised down by 6,000. States and territories with the highest insured unemployment rates for the week ended October 17 were New Jersey (2.0%), Washington (1.8%), California (1.7%), Massachusetts (1.7%), Puerto Rico (1.6%), Nevada (1.5%), Oregon (1.5%), Rhode Island (1.5%), New York (1.4%), and Illinois (1.3%). The largest increases in initial claims for unemployment insurance for the week ended October 24 were in New York (+2,609), Texas (+1,564), California (+1,043), Pennsylvania (+818), and Ohio (+784), while the largest decreases were in Michigan (-1,813), Tennessee (-977), South Carolina (-763), Kentucky (-496), and Oklahoma (-227).
- The national average retail price for regular gasoline was $4.153 per gallon on November 2, $0.116 per gallon below the prior week's price but $1.134 per gallon higher than a year ago. Also, as of November 2, the East Coast price decreased $0.086 to $3.936 per gallon; the Midwest price fell $0.167 to $4.102 per gallon; the Gulf Coast price decreased $0.066 to $3.636 per gallon; the Rocky Mountain price declined $0.245 to $4.213 per gallon; and the West Coast price fell $0.121 to $5.296 per gallon.
| | The latest inflation data is available this week with the release of the Consumer Price Index and the Producer Price Index, both for October. Each index showed prices rose in September on a monthly and annual basis. | |
Data sources: Economic: Based on data from U.S. Bureau of Labor Statistics (unemployment, inflation); U.S. Department of Commerce (GDP, corporate profits, retail sales, housing); S&P/Case-Shiller 20-City Composite Index (home prices); Institute for Supply Management (manufacturing/services). Performance: Based on data reported in WSJ Market Data Center (indexes); U.S. Treasury (Treasury yields); U.S. Energy Information Administration/Bloomberg.com Market Data (oil spot price, WTI, Cushing, OK); www.goldprice.org (spot gold/silver); Oanda/FX Street (currency exchange rates). News items are based on reports from multiple commonly available international news sources (i.e. wire services) and are independently verified when necessary with secondary sources such as government agencies, corporate press releases, or trade organizations. All information is based on sources deemed reliable, but no warranty or guarantee is made as to its accuracy or completeness. Neither the information nor any opinion expressed herein constitutes a solicitation for the purchase or sale of any securities, and should not be relied on as financial advice. Past performance is no guarantee of future results. All investing involves risk, including the potential loss of principal, and there can be no guarantee that any investing strategy will be successful.
The Dow Jones Industrial Average (DJIA) is a price-weighted index composed of 30 widely traded blue-chip U.S. common stocks. The S&P 500 is a market-cap weighted index composed of the common stocks of 500 leading companies in leading industries of the U.S. economy. The NASDAQ Composite Index is a market-value weighted index of all common stocks listed on the NASDAQ stock exchange. The Russell 2000 is a market-cap weighted index composed of 2,000 U.S. small-cap common stocks. The Global Dow is an equally weighted index of 150 widely traded blue-chip common stocks worldwide. The U.S. Dollar Index is a geometrically weighted index of the value of the U.S. dollar relative to six foreign currencies. Market indices listed are unmanaged and are not available for direct investment.
| |
You have Questions, we have Answers | | | | |
David S. Nilsen
President & Wealth Consultant
Sarah N. Santana
Investment Consultant
Annie Shanks
Wealth Consultant
| | |
David Nilsen, CA Insurance Lic #0B50436 is a registered representative and investment advisor representative with and offers securities and advisory services through LPL Financial , member FINRA/SIPC, a registered investment advisor. "This email is an advertisement and you may opt out of receiving further e-mails. To opt out, please respond to this email with "Opt Out" in the subject field"
Sarah Santana, CA Insurance Lic #0H06804 is a registered representative and investment advisor representative with and offers securities and advisory services through LPL Financial , member FINRA/SIPC, a registered investment advisor. "This email is an advertisement and you may opt out of receiving further e-mails. To opt out, please respond to this email with "Opt Out" in the subject field"
Annie Shanks, CA Insurance Lic #0778885 is a registered representative and investment advisor representative with and offers securities and advisory services through LPL Financial , member FINRA/SIPC, a registered investment advisor. "This email is an advertisement and you may opt out of receiving further e-mails. To opt out, please respond to this email with "Opt Out" in the subject field"
Fixed insurance products and services offered by Obispo Wealth Management are separate and unrelated to LPL.
This communication is strictly intended for individuals residing in the state(s) of AZ, CA, DC, ID, MI, MO, MT, NM, NV, OR, TN, TX, WA. No offers may be made or accepted from any resident outside the specific states referenced. Prepared by Broadridge Investor Communication Solutions, Inc. Copyright 2026.
|
Data sources: News items are based on reports from multiple commonly available international news sources (i.e. wire services) and are independently verified when necessary with secondary sources such as government agencies, corporate press releases, or trade organizations. Market data: Based on data reported in WSJ Market Data Center (indexes); U.S. Treasury (Treasury yields); U.S. Energy Information Administration/Bloomberg.com Market Data (oil spot price, WTI Cushing, OK); www.goldprice.org (spot gold/silver); Oanda/FX Street (currency exchange rates). All information is based on sources deemed reliable, but no warranty or guarantee is made as to its accuracy or completeness. Neither the information nor any opinion expressed herein constitutes a solicitation for the purchase or sale of any securities, and should not be relied on as financial advice. Past performance is no guarantee of future results. All investing involves risk, including the potential loss of principal, and there can be no guarantee that any investing strategy will be successful.
The Dow Jones Industrial Average (DJIA) is a price-weighted index composed of 30 widely traded blue-chip U.S. common stocks. The S&P 500 is a market-cap weighted index composed of the common stocks of 500 leading companies in leading industries of the U.S. economy. The NASDAQ Composite Index is a market-value weighted index of all common stocks listed on the NASDAQ stock exchange. The Russell 2000 is a market-cap weighted index composed of 2,000 U.S. small-cap common stocks. The Global Dow is an equally weighted index of 150 widely traded blue-chip common stocks worldwide. Market indices listed are unmanaged and are not available for direct investment.
| | | | |