| Weekly Market Update - Week Ending 11/10/2017 |
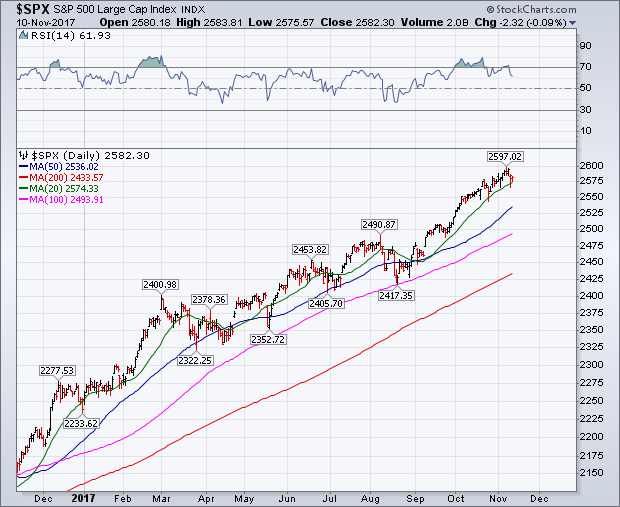
The S&P 500 declined -0.21% this week with Friday's close at 2,582.30. The index's 8-week winning streak is now behind us. We traded as high as 2,597,02 on Tuesday, only to then decline -1.18% into Thursday's low at 2,566.33. Thursday's low was within pennies of our 20-day simple moving average (20MA), which seemed to provide a bit of support to the marketplace given Friday's trade back above 2,580.
While this week closed negatively, it still became the 9th consecutive week with a higher high than the week prior. The definition of any downtrend over any time frame begins as a sequence of lower highs and lower lows, and this is yet to change. The S&P 500's weekly high hasn't been below the prior week's high since September. Should the index not hurdle 2,597.02 over the week ahead, it's likely that it trades below 2,566.33. It's in this scenario where we envision the long-awaited, healthy, pullback toward the 50-day simple moving average, which is currently 2,536.02 and ascending. A trade down toward ~2,540 would likely create "oversold" conditions across shorter-term time frames, reset daily momentum back to early October, and help refuel the S&P 500's gas tank for a strong sprint across 2017's finish line. This remains our most preferred scenario.
|
| S&P 500 Primary Trend - Up |
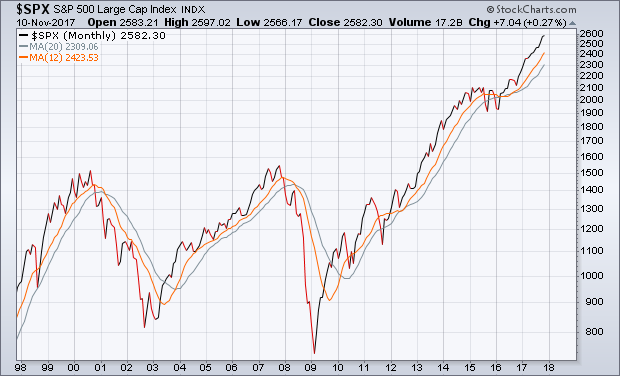
The S&P 500's price remains comfortably above both its 12- and 20-month simple moving averages (12MA, 20MA). The index has closed above its 12MA and 20MA for 20 consecutive months. We continue to label the primary trend as up or "bullish". During uptrends, long-term investors remain best served maintaining an equity overweight across their portfolio's asset allocation and relying on mostly passive investment methodologies. The old saying goes "the trend is your friend".
However, we all know the trend will one day end. History teaches us all that bull markets precede bear markets and vice versa. However, history also teaches us that we can't predict, or circle the date, of when the trend changes from up to down (i.e. the market cycle goes from "bullish" to "bearish").
What we can do, however, is have a system in place to identify trend changes shortly after their arrival. First, a long-term downtrend always begins as nothing more than a calendar month whose high is below the prior month's high, whose low is below the prior month's low, and whose close is below the prior month's close (i.e. a negative month). We haven't even had one month like this is in all of 2017 thus far. Before this happens, any speculation re: a stock market top is pure conjecture. After it happens, investors must ensure they have a prudent risk management plan in place.
A prudent risk management plan will include a sell discipline, or a trigger to rebalance your portfolio's asset allocation, that balances the need to be patient and tolerable to short pullbacks and temporary corrections that only interrupt primary uptrends, while also having a plan in place to drastically rebalance your portfolio when it appears price action has definitively ended the primary uptrend (i.e. a downtrend is established).
Small and moderate losses are the necessary evils to invest for success over the long term, and these are the losses that investors must endure in order to identify a primary downtrend shortly after its arrival. However, large losses are an entirely different story, and they're often the derivative of having no risk management plan or doing absolutely nothing to your asset allocation during and throughout primary downtrends. These large losses can be devastating to a long-term investor's well-being, and generally take years to recover. They say those who fail to plan, plan to fail. There's no better time to ensure you have a prudent risk management plan than right now, i.e. before you actually need it.
|
| An ATH In November - A Good Omen For S&P 500 |
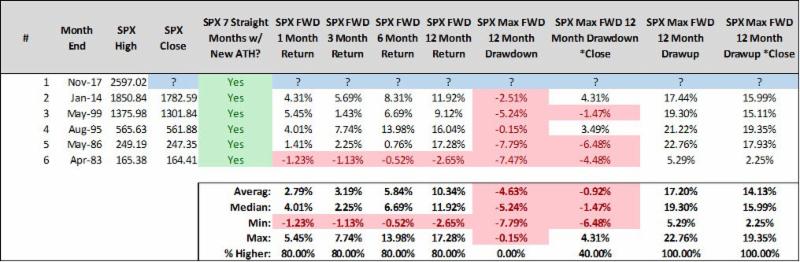
The S&P 500 has traded up to a new all-time high in November. Therefore, we identified all Novembers since 1970 where the S&P 500 reached a new all-time high and calculated its price-only returns over the forward 1-, 3-, 6-, and 12 months. Since 1970, we've made a new all-time high in November 13 times (2017 is #14). The first glaring observation is the S&P 500's forward 6-month returns have been higher 12 consecutive samples, and 12 of 14 overall. Median returns over the forward 6-month period are 9.69%. You have to go back to 1980 and 1972 to find two samples where a new all-time high in November wasn't a marker of strength to come. Additionally, those are the only two samples that included a -10% correction from November's close.
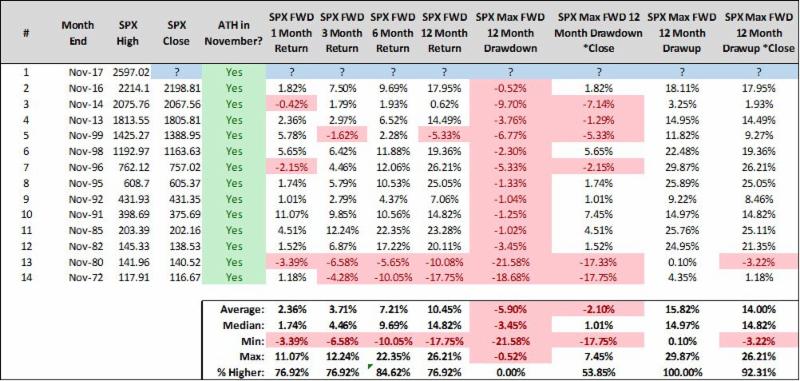
We also have a streak of 7 consecutive calendar months with a new all-time high. This has occurred only 5 times since 1970 (2017 is #6) and the last 4 samples were all incredibly strong markets over the forward 1 year, with all trading up at least 17.44% from month-end signal date.
While these samples aren't predictive, they do set a precedent for the manner in which market participants behaved following signs of strength. And since "strength begets strength" history would suggest the path of least resistance remains to the upside. We continue to encourage long-term investors to not let the fear of striking out keep them from playing the game. Ironically, a prudent risk management plan will keep you from striking out, but also help you identify when you shouldn't even be playing the game!
|
| Random Warnings - Cracks Beneath The Surface |
There are a few obvious warnings unfolding across asset categories that may support the idea of a temporary pullback over the coming weeks. Here are just a few that we're tracking:
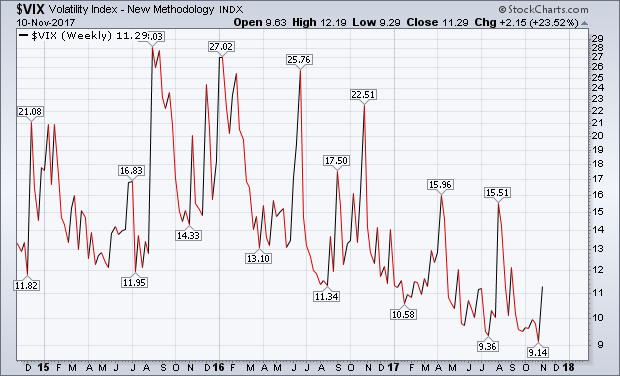
VIX Springs To Back to Life
The VIX gained 23.52% this week with Friday's close at 11.29. The VIX increases as nervousness across market participants increases. There was demand for options contracts this past week, which suggests perhaps participants are leaving full-blown complacency and heading toward slight nervousness.
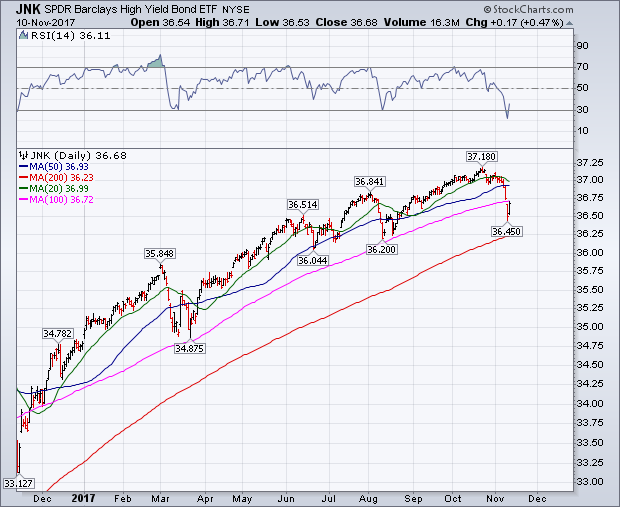
High Yield Struggling
The SPDR's Barclays High Yield Index Fund (ticker symbol JNK) declined -0.86% this week and closed below its 20-, 50-, and 100-day simple moving averages. Weakness in high yield fixed income is often viewed as a canary in the coal mine. When pairing weakness in JNK with all-time high prices for the S&P 500, we have a meaningful divergences that historically has suggested turbulence over the short term.
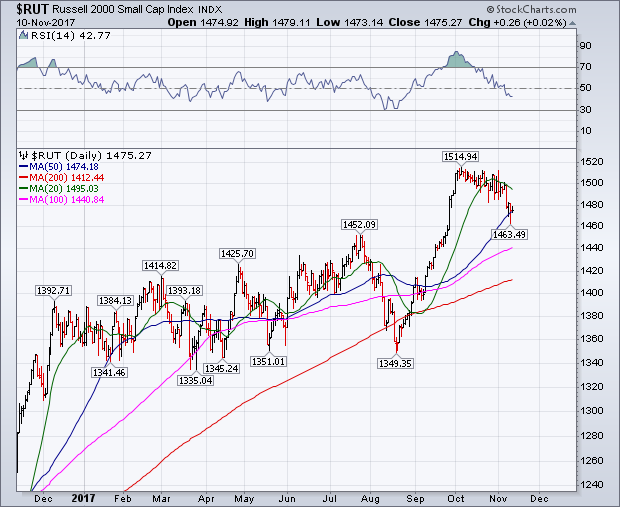
Small Caps Struggling
The Russell 2000 declined -1.31% this week with Friday's close at 1,475.27. The RUT is now on a 3-week losing streak and has obviously ignored the S&P 500's persistent strength. RUT has failed to make a new all-time high in November while also trading below October's low. It's clear participants are in a bit of a buyer's strike with small market capitalization stocks, something that's a sign of weakening risk appetite and generally precedes turbulence for the S&P 500 over the short term. The good news is 4-week losing streaks are fairly rare, so perhaps the RUT finds some buying interest over the week ahead.
Happy Sunday!
Steve & Rick
|
|
Nerad + Deppe Wealth Management |
http://www.nd-wm.com
8910 University Center Lane
Suite 645
San Diego, CA 92122
Investments involve risk and do not guarantee that investments will appreciate. Past performance is not indicative of future results.
|
|
|
|
|
Copyright © 2013. All Rights Reserved.
|
|
|
|