SHARE:  
Greetings!

The supply of westside detached homes in October was 681, down from 742 in September and up 18% compared to 579 last year in October 2020. 
 
Westside detached home sales this October increased 30% from September (104 vs 80) and were 4% lower than pandemic October 2020. This is also 9% lower than the October 10 year average of 114 sales.
Months of Supply, (MOS) in October is down 29% from last month to 6.5 from 9.3 in September and up 22% from October 2020. (A balanced market keeping prices relatively flat now appears to be 7 to 10 MOS). The October average price was up 4% from September to $3.77M and the median detached home price increased 1.5% to $3.22M. Current prices are down 17% on average & 16% on median from the peaks in Oct 2017 and Jul 2017. 

The highest sale price for a Westside detached home in October was $16.25M. It was on the market for 227 days before it sold. The lowest price was $1.77M. It was on the market for 88 days. Of the 104 sales, 33 received the asking price or more and 71 sold below the asking price.
Westside apartment supply decreased 5% in October to 1500 from 1579 in September and decreased 23% from the 1948 listings we had in October 2020. At the same time, demand remained unchanged at 418 sales and this is up 15% from 365 sales in October 2020. Apartment sales are up 16% from the 10 year average of 360 sales.

MOS in October decreased 5% to 3.6 from 3.8 in September and this is down 33% from October 2020.
 
The average price in October increased 3% ($983 v $955K) from September 2021 and was relatively unchanged from October 2020. The median price was up 5% from September ($830 v $792) and is up 9% from last October. Average and median prices are still down by 18% & 6% from the peak of $1.199M and $880K in January 2018.
Westside townhouse supply increased 4% in October from September (214 vs 206), and was down 22% from October 2020 (214 v 275). Demand in October is up 3% from September (67 vs 65 sales) and down 3% from last October 2020 (67 v 69). Attached home sales are up 16% from the 10 year average of 58 sales.
 
With supply and demand up, current MOS remained relatively unchanged at 3.2. That is down 20% from 4 in October 2020.
 
Townhouse average prices in October were down 2% from September at $1.66M and were up 16% from $1.44M last October 2020. Median prices were up 3% in October
(1.5M v 1.45M) and are up 12% from October 2020. The average price is down 8% from the peak of $1.8M. The median price is down 3% from the peak of $1.519M in January 2018.
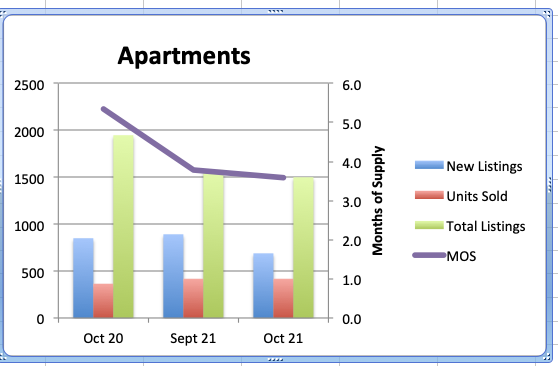
West side detached home listing supply in October was down 6% from the 10 year average for detached homes, up 6% from the 10 year average for apartments and down 8% for townhomes.

Demand in October was down from the 10 year average by 9% for detached homes, up 16% for apartments and up 16% for townhomes.

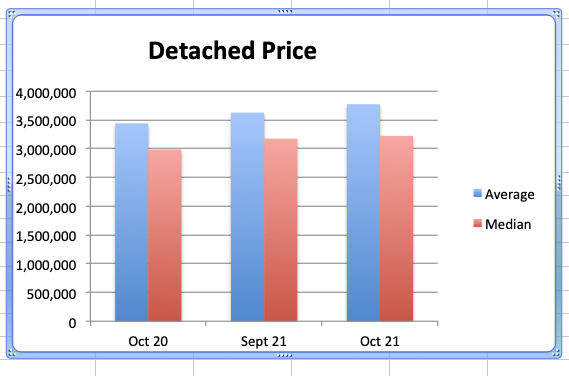
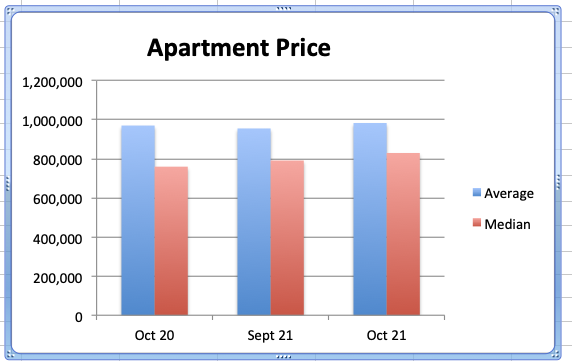
Median home prices in October are off from the peak, by 17% for detached homes, 6% for apartments and 3% for attached homes so they are all selling below peak prices and are still good value for Buyers, particularly detached homes. 

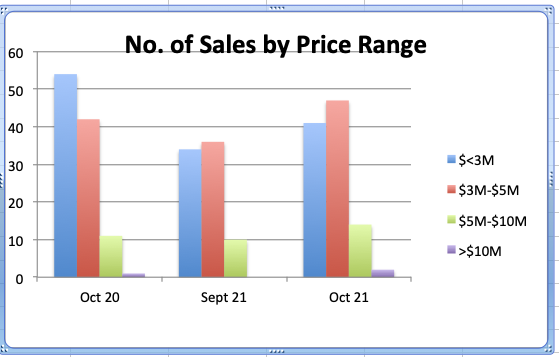
The Real Estate Board of Greater Vancouver (REBGV) METRO report says that residential property sales in the region decreased 5.2% to 3,494 this Oct. from 3,687 sales in Oct. 2020. This is a 11% increase from the 3149 homes sold in Sept. 2021.

Oct. 2021 sales were 22.4% above the 10-year Oct. sales average.

The total number of properties currently offered on the MLS® system in Metro Vancouver is 8,034 down 35.3% from 12,416 in Oct. 2020 and down 13% from 9,236 last month.

For all property types, the sales-to-active listings ratio for Oct. 2021 is 43.5%.
Downward pressure on home prices occurs when the ratio dips below the 12% mark for a sustained period, while upward pressure occurs when it surpasses 20% over several months.

Westside supply peaked in June and demand is down since the peak March so prices have been softening, however Oct. demand is up and supply is down so unique & sharply priced homes are still receiving multiple offers with prices over the ask.

The westside remains under supplied and current prices are good value but it will be a surprise if Nov. sales volumes are higher than Oct. and Dec. & Jan. are usually the slowest months of the year. 

Be kind and be careful 💝🍬🍫 ! 

Take a moment on November 11th to give thanks to all our brave service men and women, past and present. We will not forget 🌺

Best regards,

Stuart