From May 2021 to May 2022...
Highlights from the recent report include:

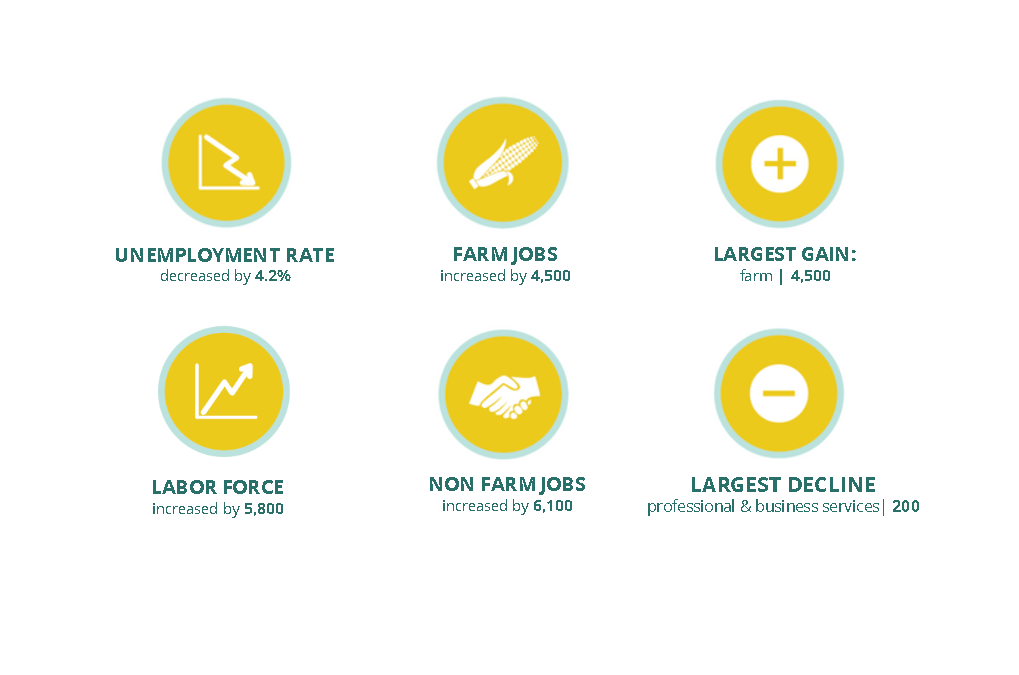
  • From May 2021 to May 2022, the unemployment rate in Tulare County decreased by 4.2 percent, and jobs increased by 6.3 percent
  • The 6.5 percent unemployment rate represents the lowest ever unemployment rate for Tulare County since 1990, as far back as data is available
  • From May 2021 to May 2022, employment increased by 14,000, and the labor force increased by 5,800
  • In May 2022, Tulare County saw record high employment for all Nonfarm jobs, and the highest employment numbers for the following sectors since 1990, as far back as data is available: Accommodation, Food Services & Drinking Places, and Other Services
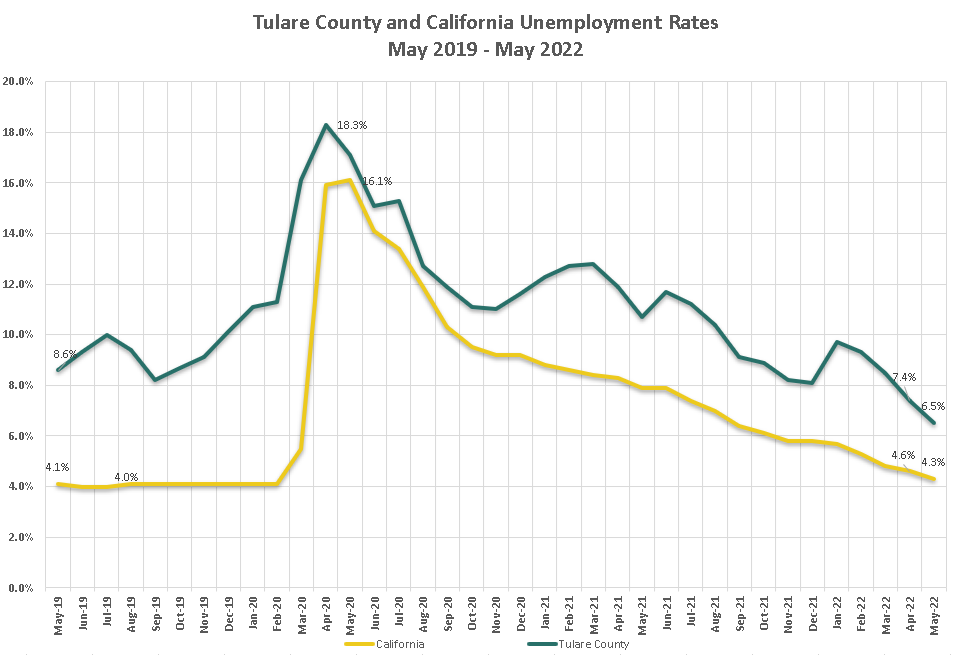
Employment in Tulare County vs. California  
HOW DOES TULARE COUNTY'S UNEMPLOYMENT RATE CHANGE OVER TIME?
The California Employment Development Department (EDD) reported a 4.2 percent decrease in Tulare County's unemployment rate, from a revised 10.7 percent in May 2021 to 6.5 percent in May 2022. 

From April to May of 2022, the month-over-month unemployment rate decreased by 0.9 percent, lower than the average month-over decrease of 1.2 percent.

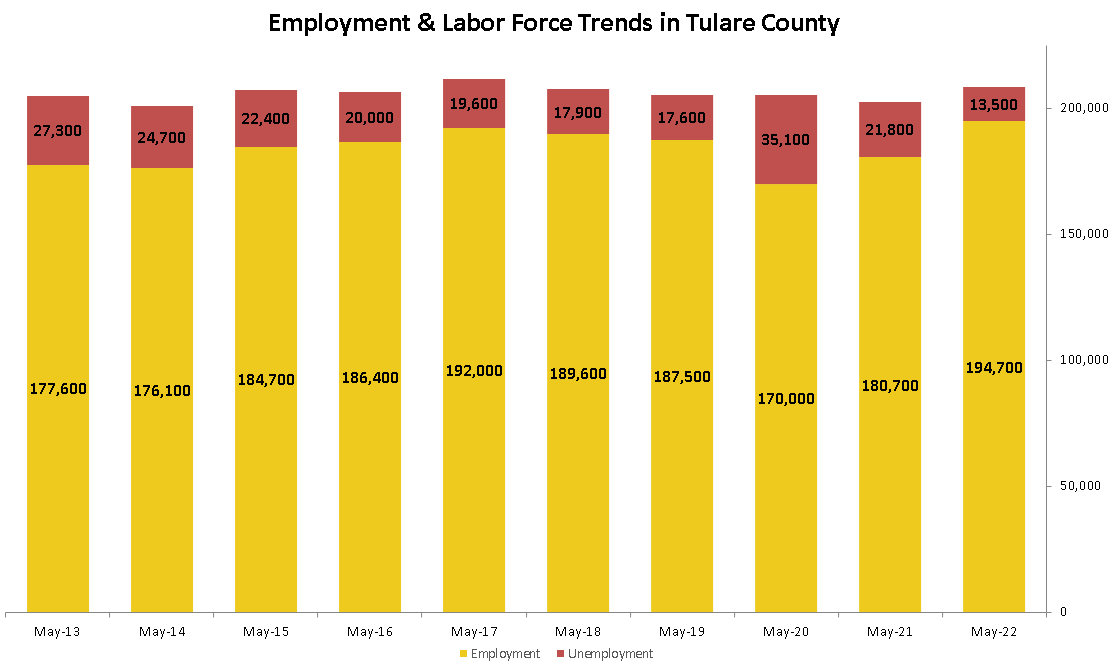
The graph below shows the trends in May employment and unemployment over the last 10 years. In May of 2022, there were 194,700 people employed, more than ever before in Tulare County since 1990, as far back as data is available.
Gains + Losses | The Number of Jobs in Tulare County
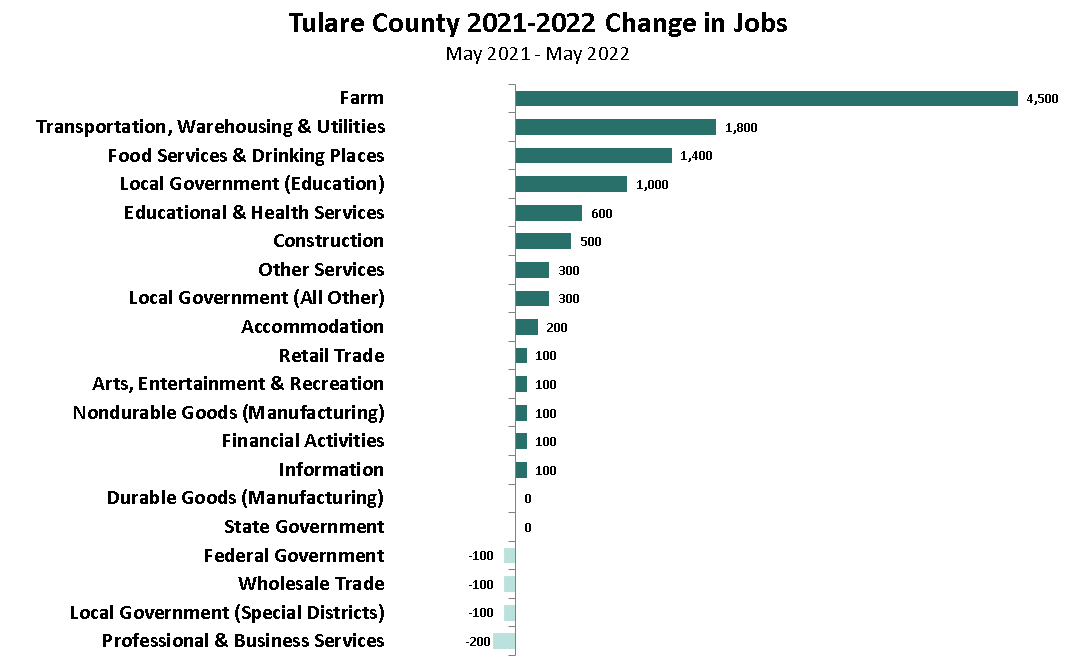
HOW MANY JOBS HAVE COME AND GONE IN THE LAST YEAR & THE LAST MONTH?
YEAR OVER YEAR | A COMPARISON
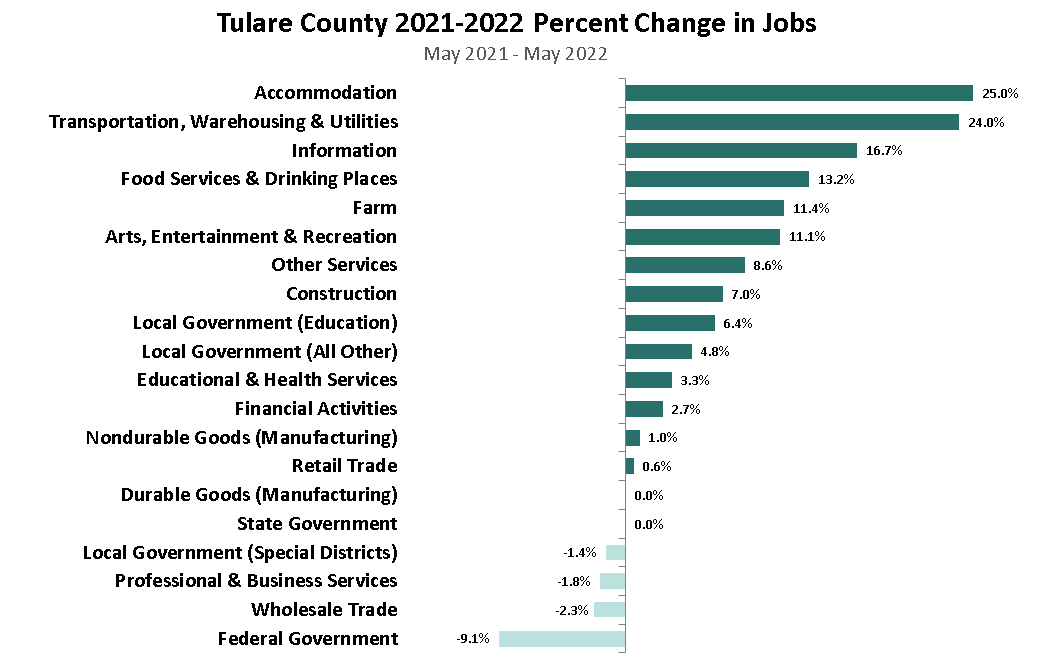
From May 2021 to May 2022, Farm showed the greatest year-over numerical gain with an increase of 4,500 jobs, while Accommodation showed the greatest percent gains with job growth of 25.0 percent. Professional & Business Services showed the greatest year-over numerical decline with a loss of 200 jobs, while Federal Government showed the greatest percent decline with a job loss of 9.1 percent.
MONTH OVER MONTH | A COMPARISON
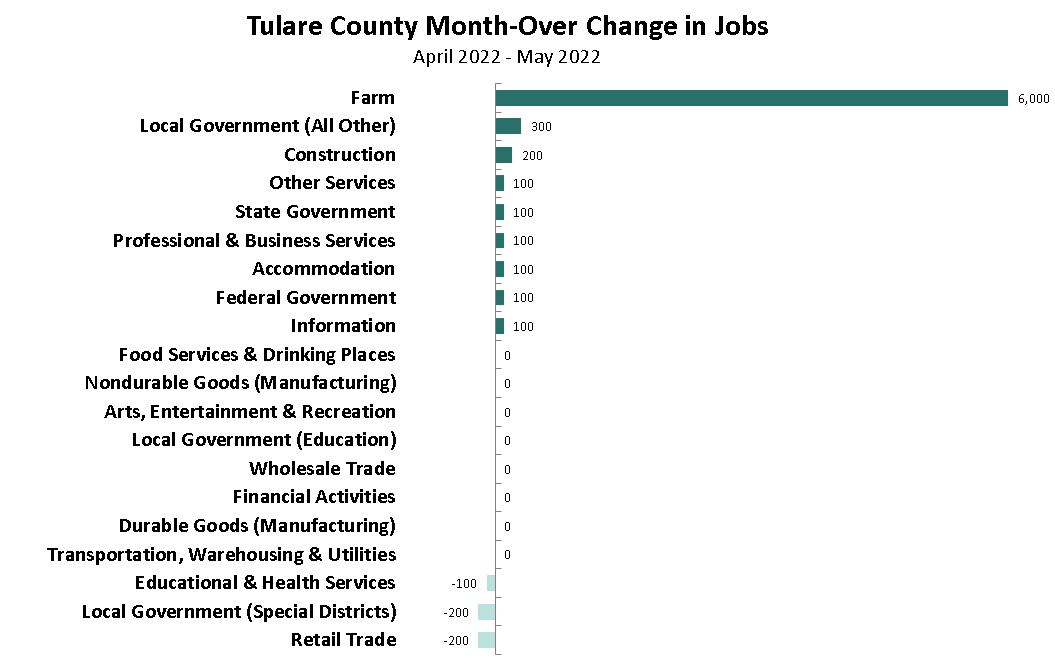
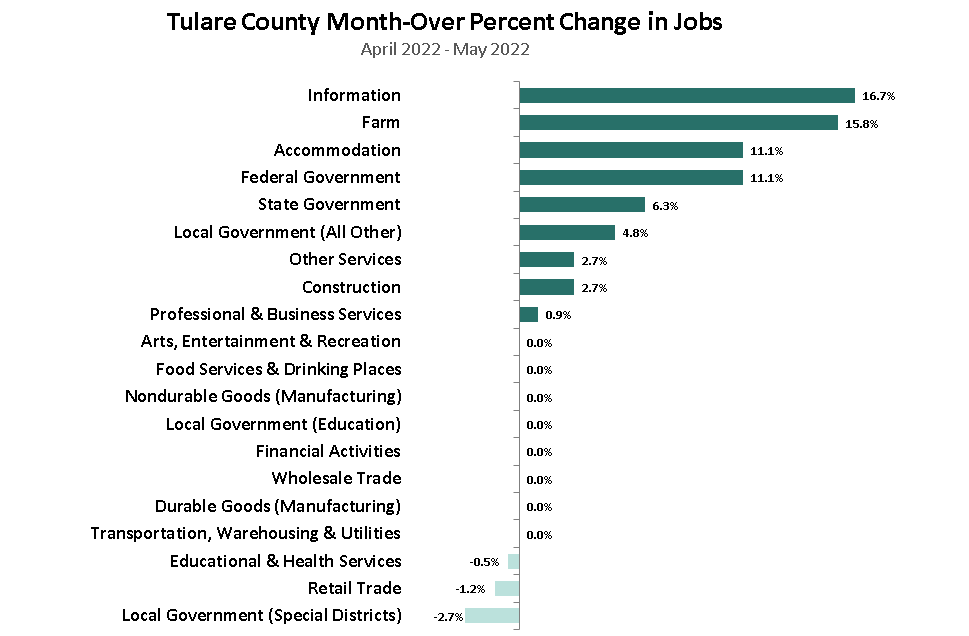
From April to May 2022, Farm showed the greatest numerical gain with an increase of 6,000 jobs, while Information showed the greatest percent gain, with job growth of 16.7 percent. Retail Trade and Local Government (Special Districts) shared the greatest month-over numerical decline with a loss of 200 jobs, while Local Government (Special Districts) showed the greatest percent decline with a loss of 2.7 percent of jobs.   
The employment data referenced in this newsletter is provided by the Employment Development Department of California.  
Please visit www.tularewib.org to learn more about our initiatives in Tulare County.

 Let's Connect! 
LIKE US | TWEET US