|
Dear Bernard,,
Do you feel correlations can be a predictor? In case you are unfamiliar, a correlation is how 2 facts may go together to determine and outcome. Think of where there is smoke there may be fire, or if you see storm clouds may mean it will rain.
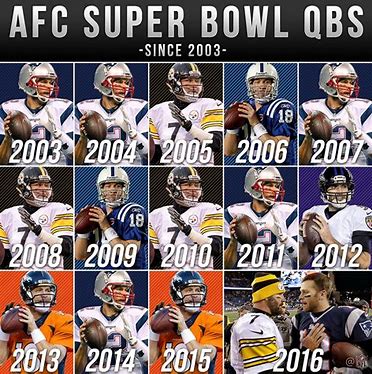
Since this is Superbowl Week, one of the more common correlations that I have heard of is the Super Bowl winner predicting the stock market for the balance of the year. The premise is that a Super Bowl win for an NFL team from the American Football Conference predicts a stock market decline (a bear market) in the coming year. On the other hand, a win for a team from the National Football Conference foretells a rise in the market or a bull run in the upcoming year. (Investopedia.com)
This correlation worked... until it didn't.
It would be nice if we could predict the stock market for the year based on a game played in late January or early February. Just think of how easy my job might be.
Other weird (and slightly dangerous) stock market predictors have included these which I found at www.moneymorning.com:
The "Buttered Popcorn Index"
The concept with this predictor is that during difficult time people try to escape reality. One way to find a distraction would be to attend movies, whether it is a good movie or not. The premise is that while attending the movie the patron would order popcorn. The correlation is increased popcorn sales (and who would eat popcorn without butter) while attending a movie is a way to avoid a bad economy.
The "Butter in Bangladesh" Theory
This indicator, from what is disclosed in the article link below is purely random. The authors, analysts David Leinweber and Dave Krider at investment management firm First Quadrant Corp, looked at various data that had little or no reason to be correlated. The result of a guess showed how these data point tended to move in the same direction leading to this theory.
The "Women's Hemline Theory"
This market indicator was devised by economist George Taylor in the 1920s and was designed to predict the markets based on the length of women's skirts and dresses. In my opinion, similar to the "Buttered Popcorn Theory" this has the opposite effect. The theory is that when you feel good you dress better, when you feel better you don't. My attaching this idea to skirt length was to show that god economies revealed more leg and bad economies showed less leg.
While this theory was created in the 1920's, the turbulence of the late 1960's showed this to be false (according to Women's Wear Daily, the term mini-skirt was officially name in 1958).
The "Lipstick Theory"
Similar to the "Hemline Theory", this is based on how people spend. After the Sept. 11 attacks in 2001, and as the U.S. economy deflated, Leonard Lauder - the chair of Estee Lauder Co. Inc. (NYSE: EL) - noticed that his company was selling more lipstick than usual.
His theory was that lipstick purchases were a way to measure the economy: In a weak economy sales should increase as women boost their mood with economical lipstick purchases in lieu of $200 clutches.
You could also use refreshment (snacks and drinks) sales at gas stations. Beverage companies noted the drop in single-serve sales when the economy has been bad or gas prices have climbed.
If you would like to read more details on these "predictors", I have included the link below:
Stock Market Theories
While we have no guarantees that an acceptable market predictor may be discovered in the future, we feel that at present, having a portfolio designed to fit your objectives, using tactical allocation to try to help mitigate losses, and regular reviews seem to be the best strategy.
If you have any questions, have investments that you feel need to be reviewed, or just want to talk, please feel free to give us a call.
As always, thanks for reading.
|