The-Lead-Left-logo-with-PC_Newsletter image

PDF | Research | Week of Oct 28 2024

Quote of the Week

“The market really got ahead of itself with pricing in rate cuts.”

– Victoria Fernandez, chief market strategist, Crossmark Global Investments. 


Survey-animated-gif image

2024 Private Debt Survey


Institutional investors, RIAs, and financial advisors: We want to hear from you! We invite you to share your views on private debt and today’s environment by completing a brief 2-minute survey. We look forward to sharing the results with you in an upcoming Lead Left issue.

Take survey
 

Lead Left Vodcast

Everything Happens So Much (Part One)

🔔 Subscribe to our YouTube channel: click here

Watch Now

Private Equity Now: The Distribution Dilemma

juan-carlos-ramirez-KxzpYpn-xng-unsplash-scaled image

Having focused this year mostly on the effects of rates and the economy on private credit, it’s time to turn our attention to private equity. One of the more surprising aspects of conversations around this topic is how PE has taken a back seat to PC, particularly regarding growth and performance of the asset class. Yet to understand the dynamics of fundraising and deployment of one you need to understand them for the other.


It's no secret that the past few years have been marked by a sharp drop-off, some say a cessation, in private equity distributions. From 2021 to 2023, the median hold period for a private equity portfolio company grew over 20% to nearly 6.5 years. Sparked by the dramatic rise in interest rates, macroeconomic shocks such as COVID and inflation, and the corresponding slowdown in M&A, the so-called flywheel of private equity investing has been disrupted...

Read More

Chart of the Week

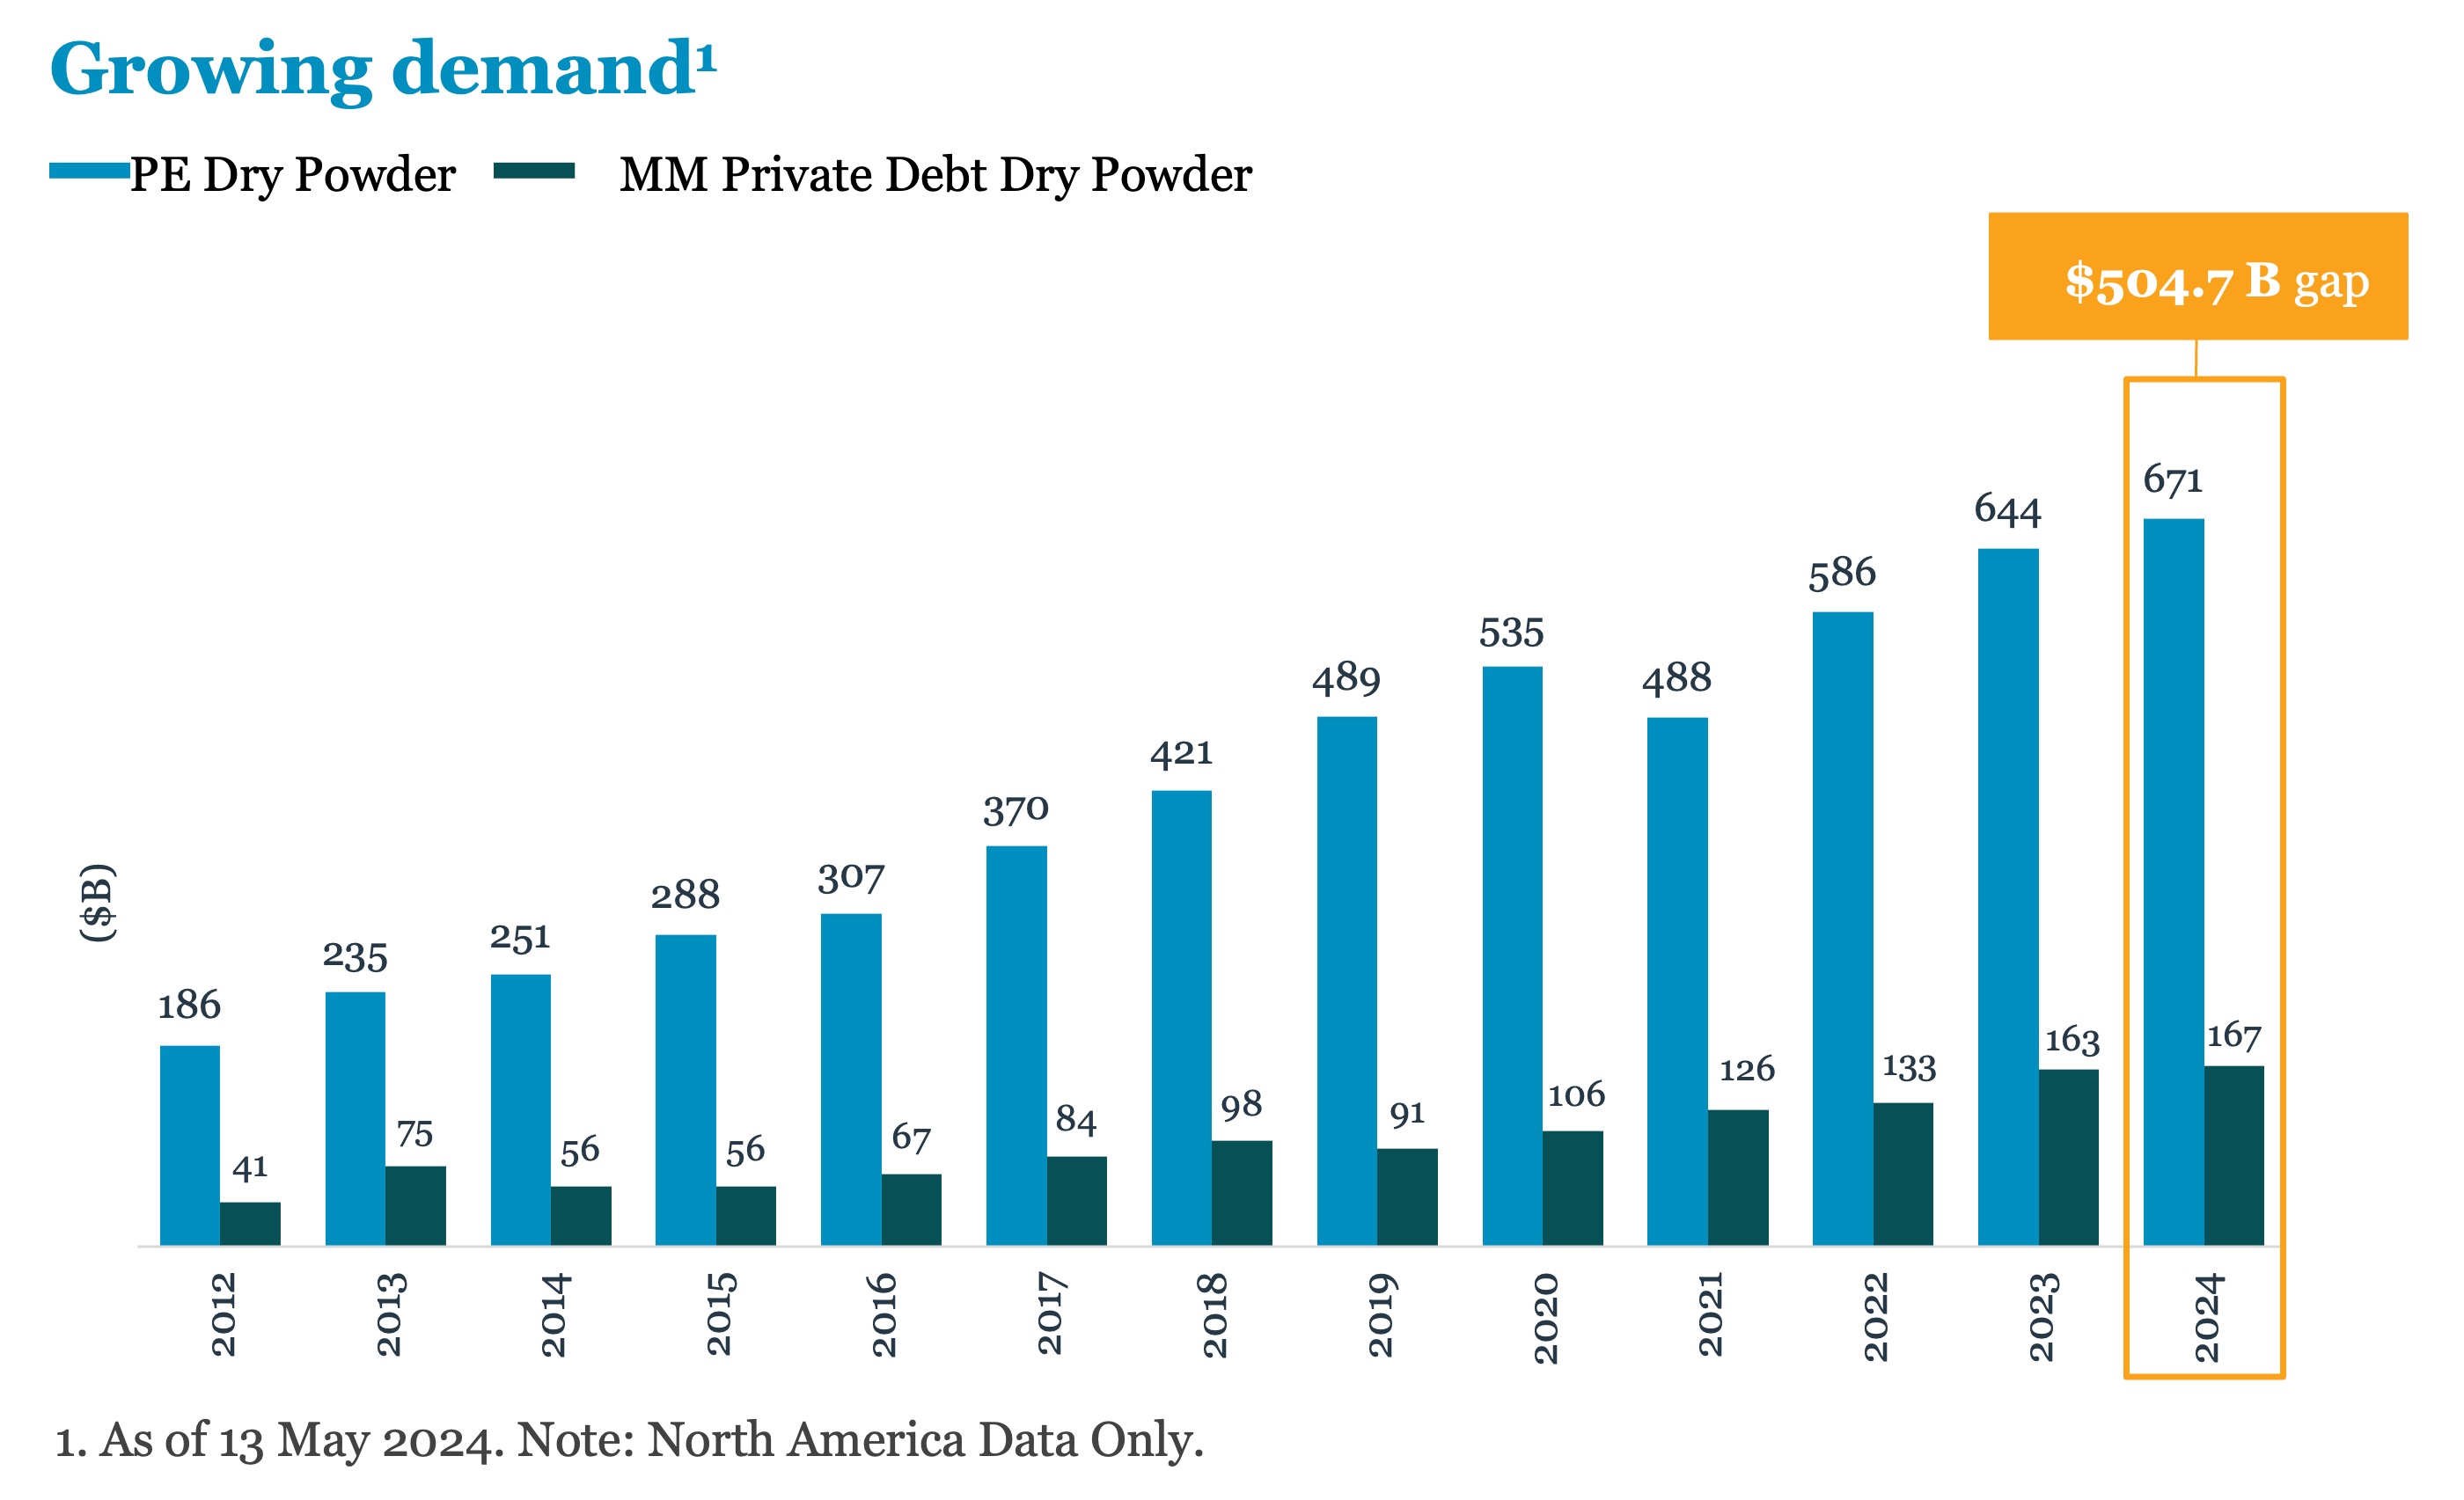
Who’s The Driest?

Despite claims of a “too crowded” private debt market, PE dry powder is four times greater.

CTW1028-1 image

Source: Preqin


(Past performance is no guarantee of future results.)

Lead with Your Left

 
30-DAY FREE MEMBERSHIP


Join the leading voice of the middle market. Try us free for 30 days.
Learn More
 

PDI Picks

Investors keen to plug the gap

PDI-1029 image

Read PDI's Report: LP Perspectives 2024 report


Capital allocations can be expected to increase as many LPs seek to back up their faith in private markets with greater commitments.

After a fallow couple of years for fundraising (as well as exits and distributions) in private markets, optimism is returning among LPs, according to Schroders’ latest global investor insight survey...

Read More

Contact: Andy Thomson / Private Debt Investor

Leveraged Loan Insight & Analysis

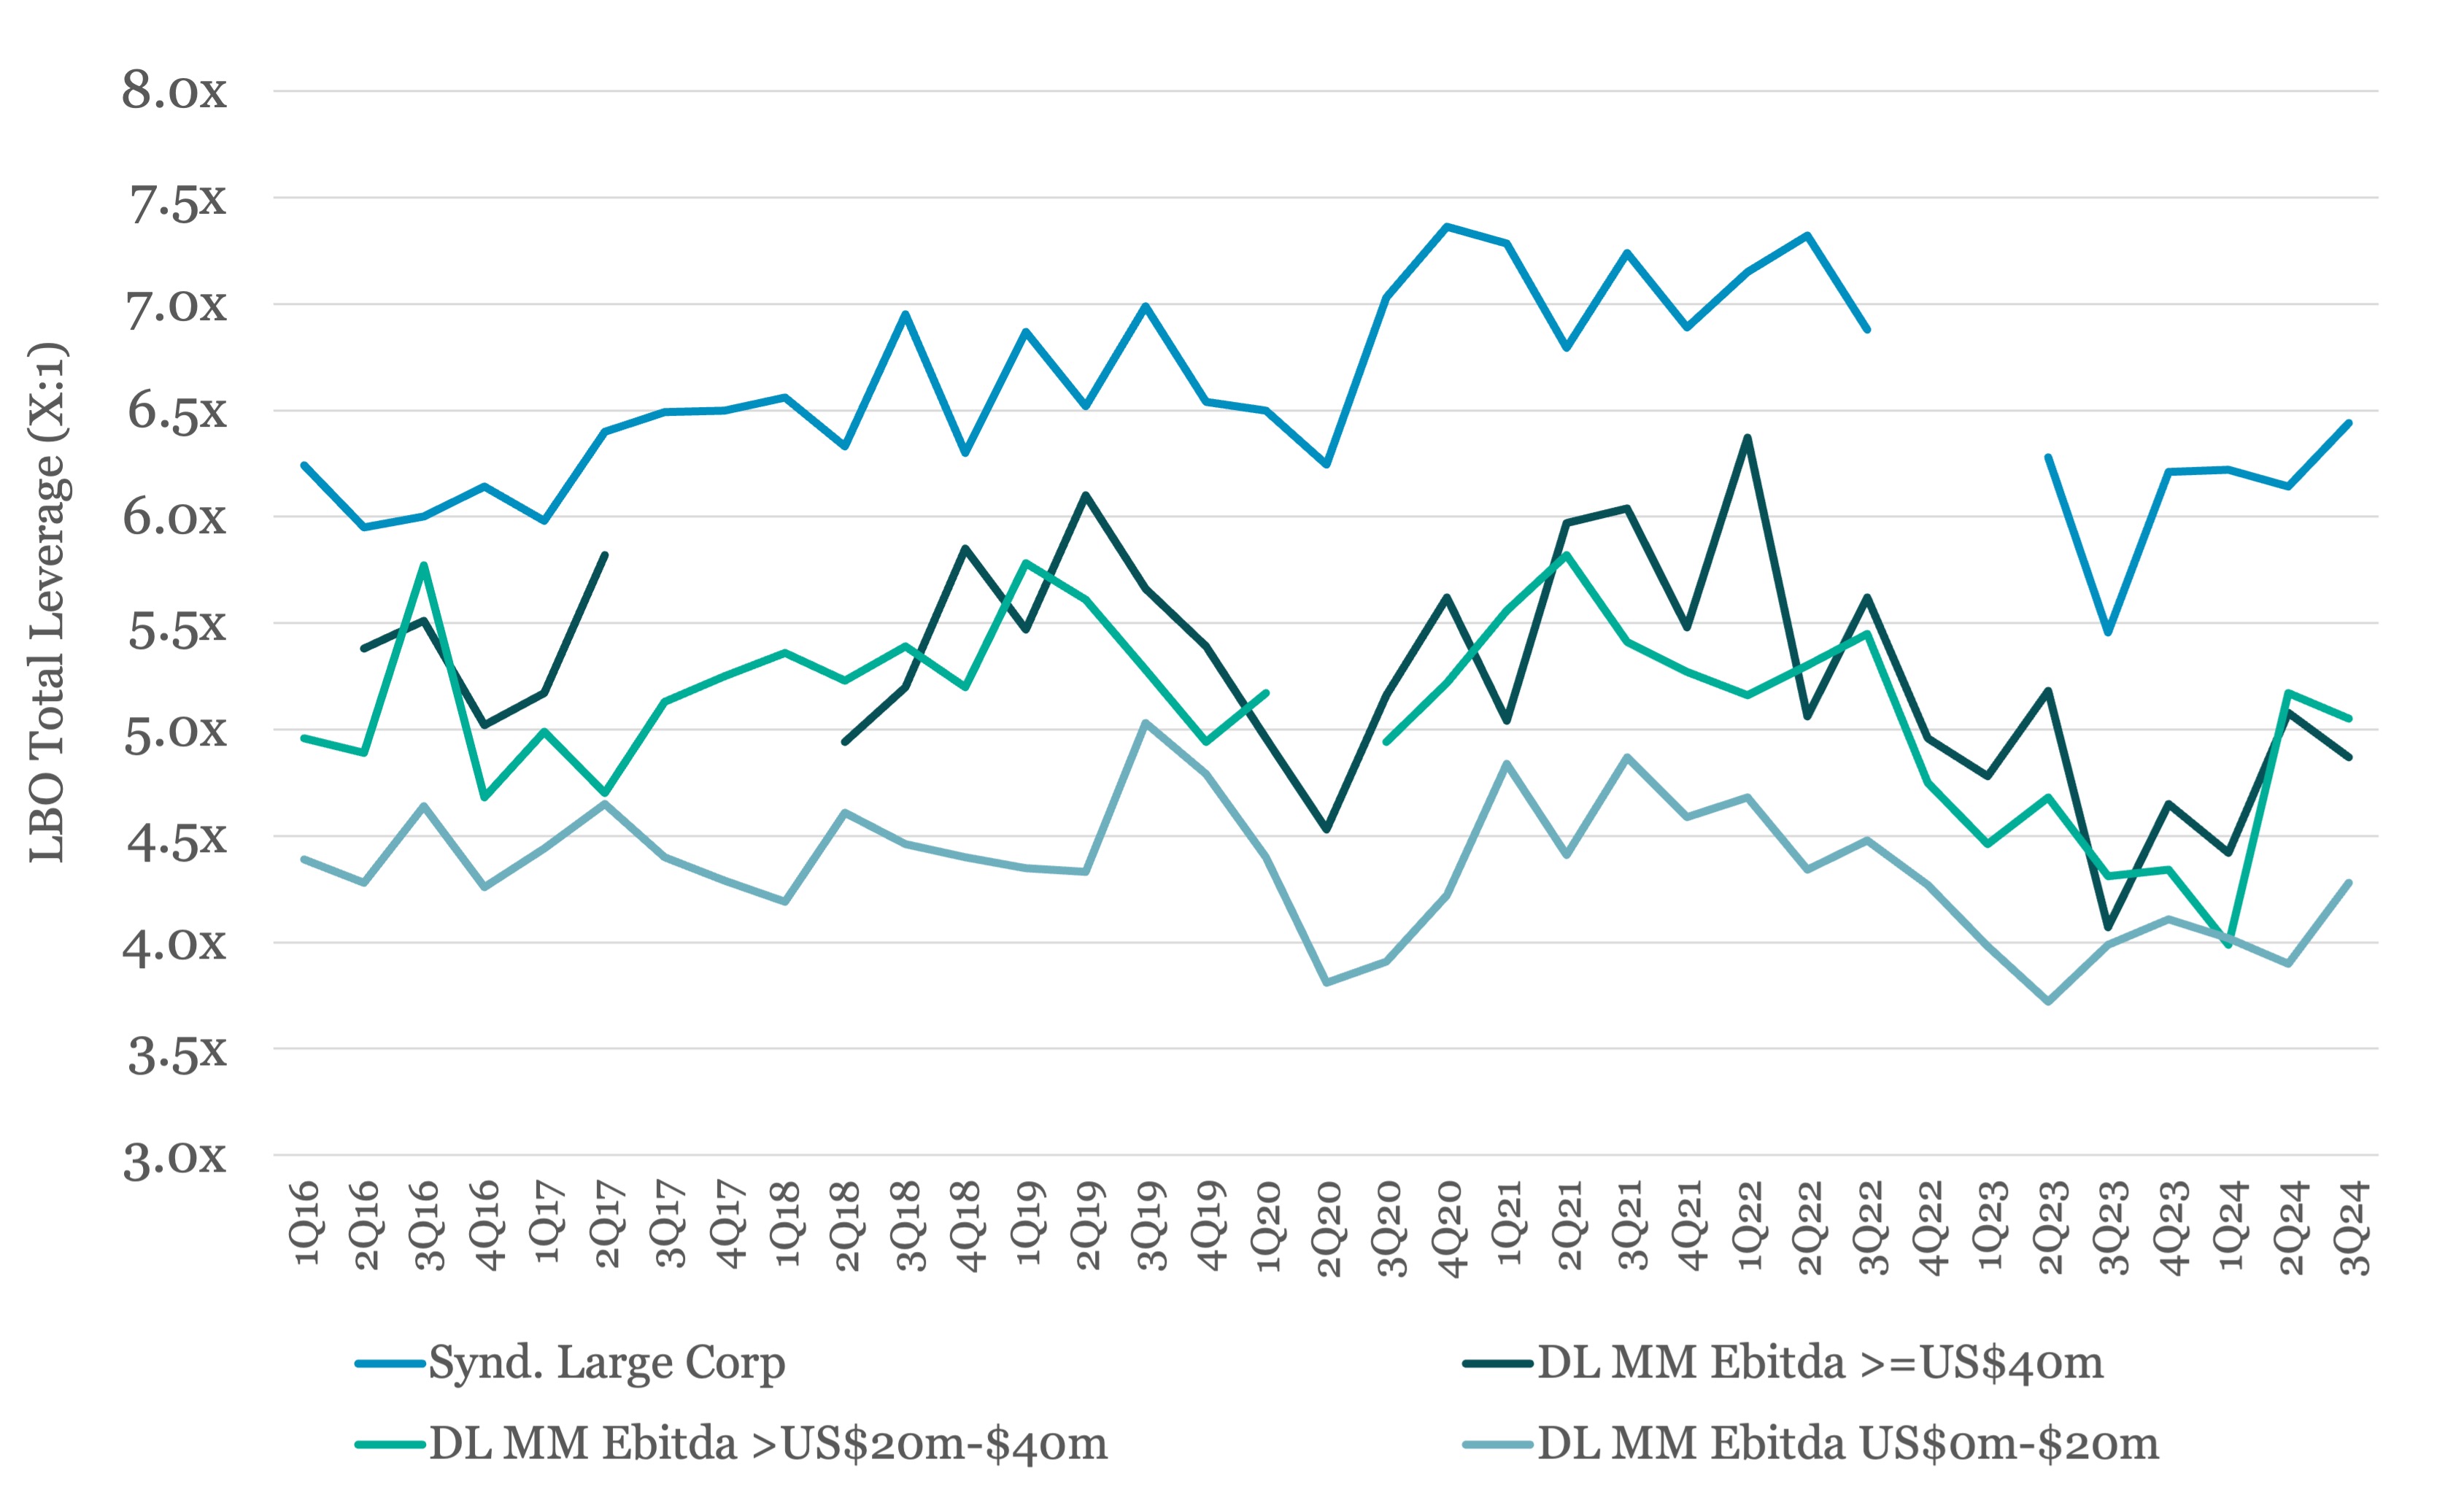
Total leverage on US LBO deals exhibited hints of bifurcation across EBITDA ranges

LSEG-1028 image

In 3Q24, total leverage on US LBO deals exhibited hints of bifurcation across different EBITDA ranges. For syndicated large corporate LBOs, total leverage averaged 6.44x in 3Q24, up from 6.14x in the previous quarter...

Read More

Contact: David Miao / LSEG

The Pulse of Private Equity

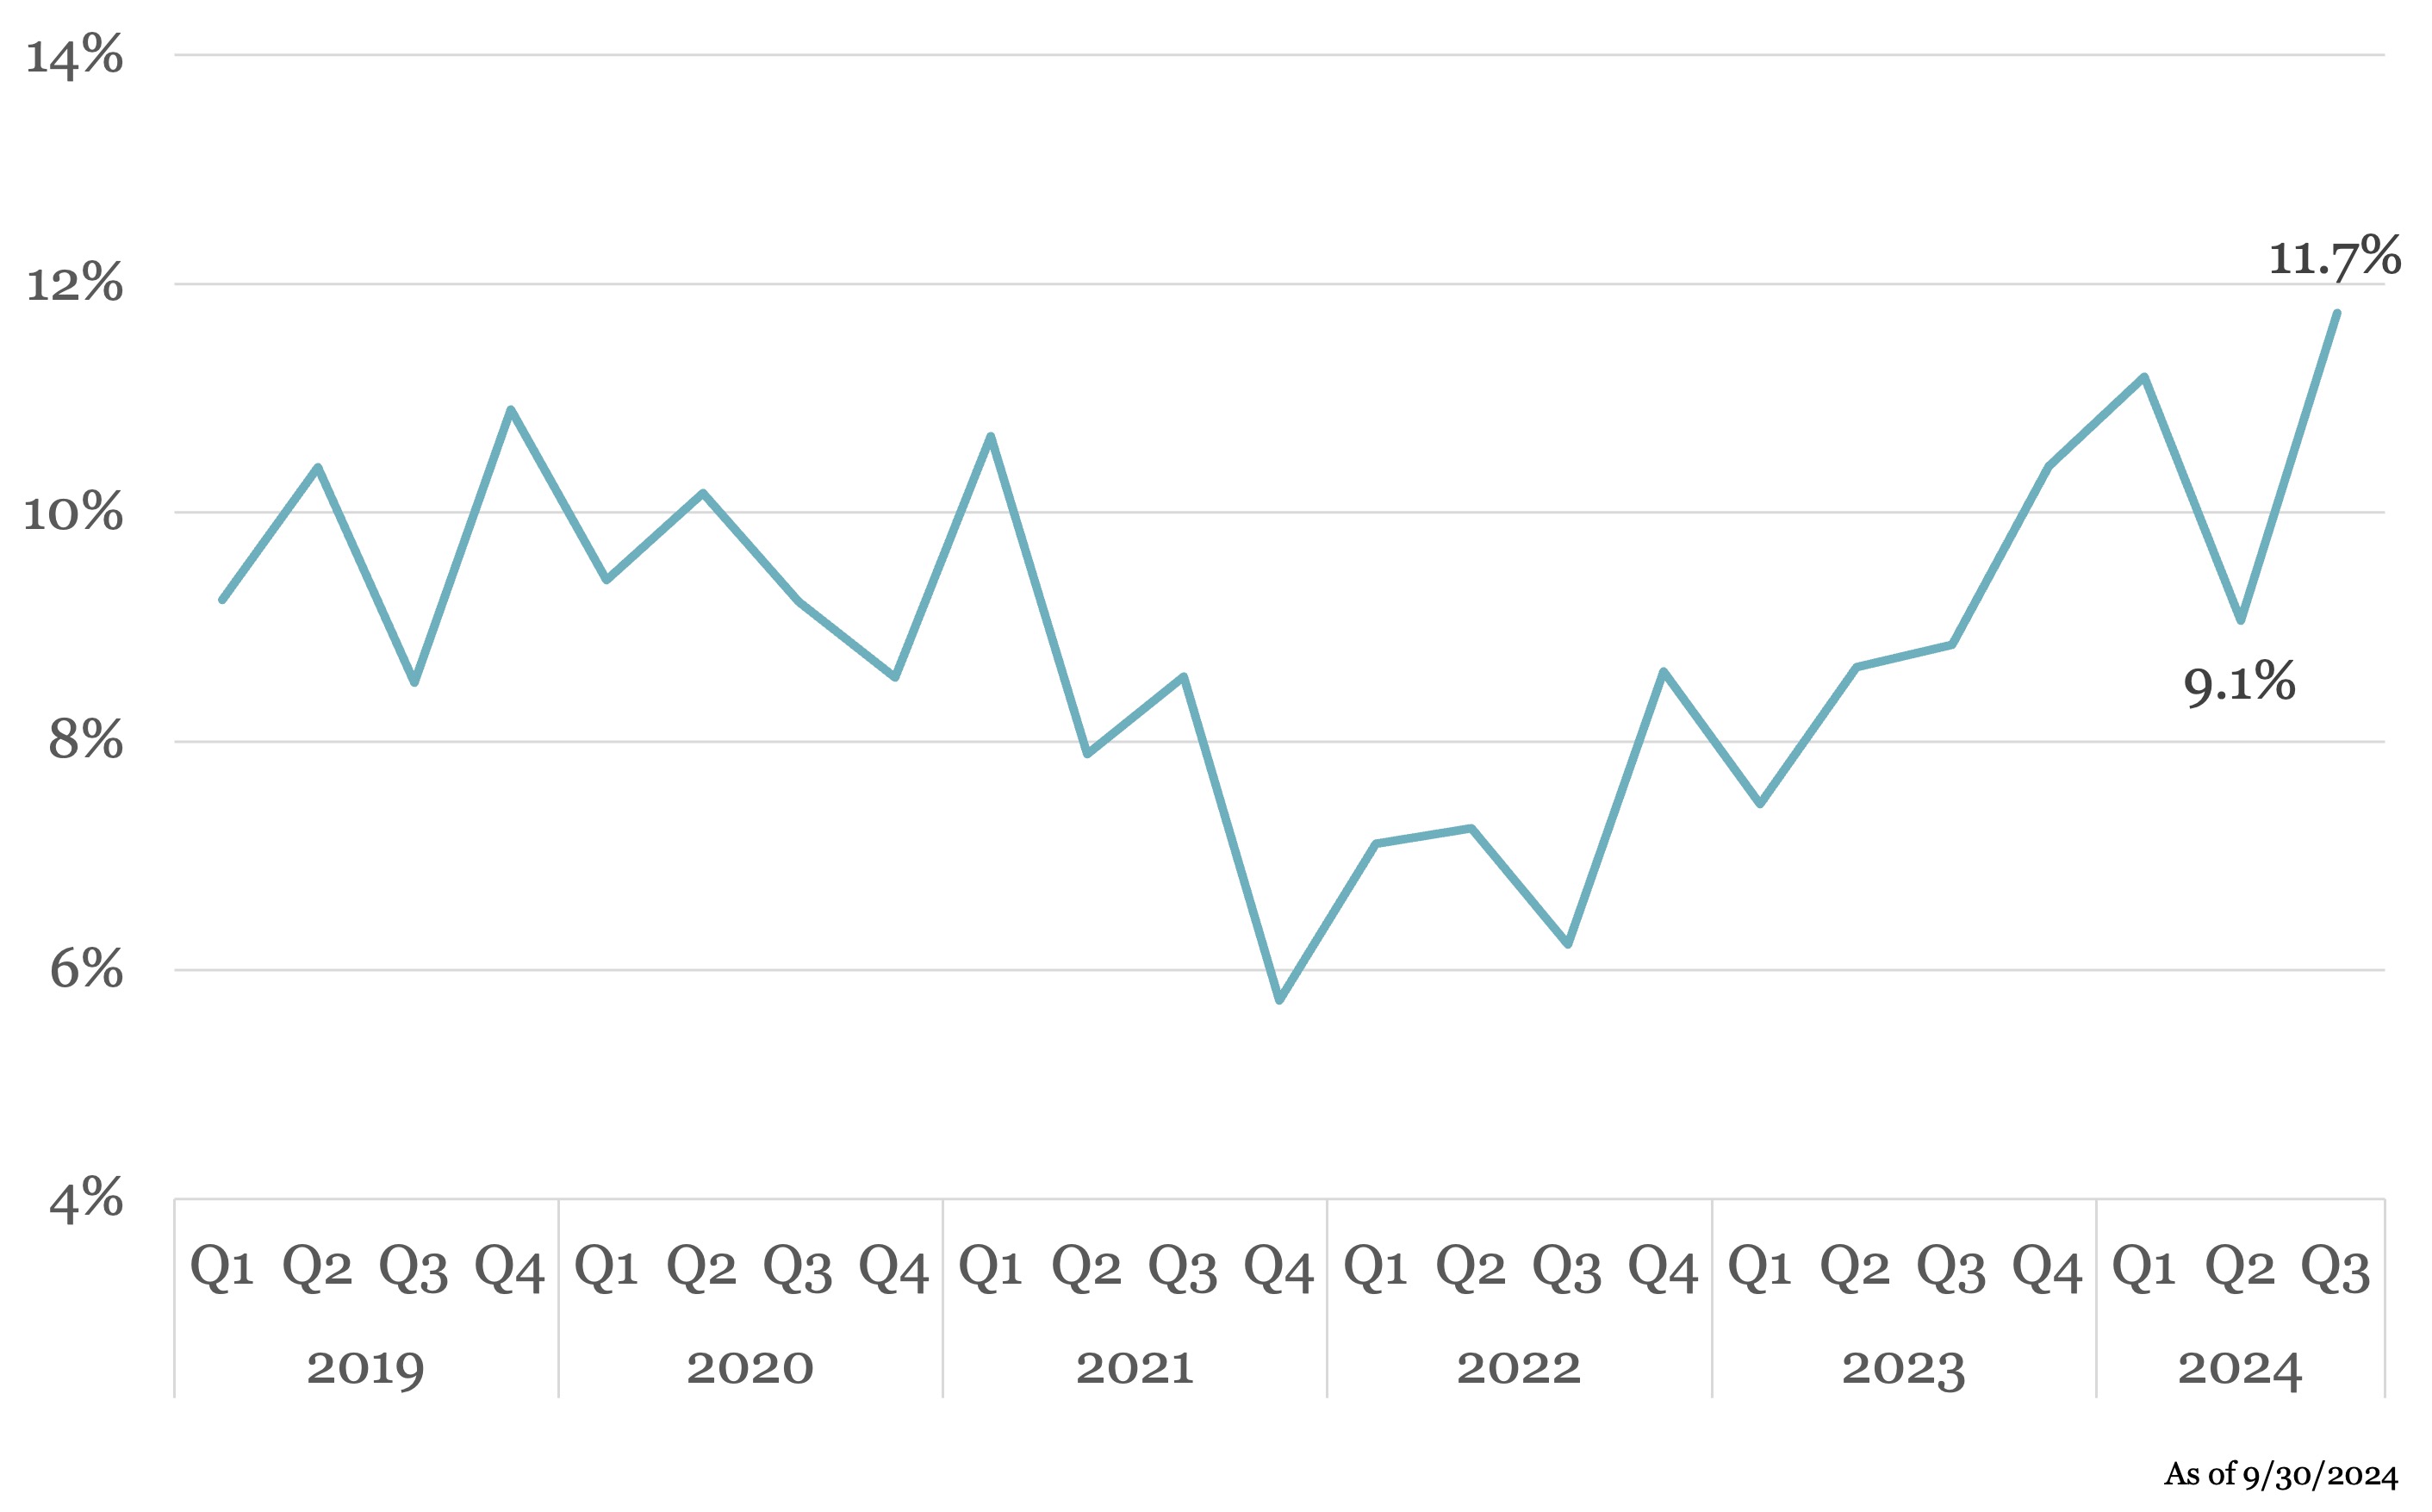
Carveouts/divestitures as a share of all US PE buyouts by quarter

PB-1028 image

Carveouts accounted for 11.7% of all US PE buyouts in Q3 2024, a rebound from the decline to 9.1% in Q2...

Read More & Download Report

Contact: Garrett Black / PitchBook

KBRA Direct Lending Deals: News & Analysis

DLD-Logo image

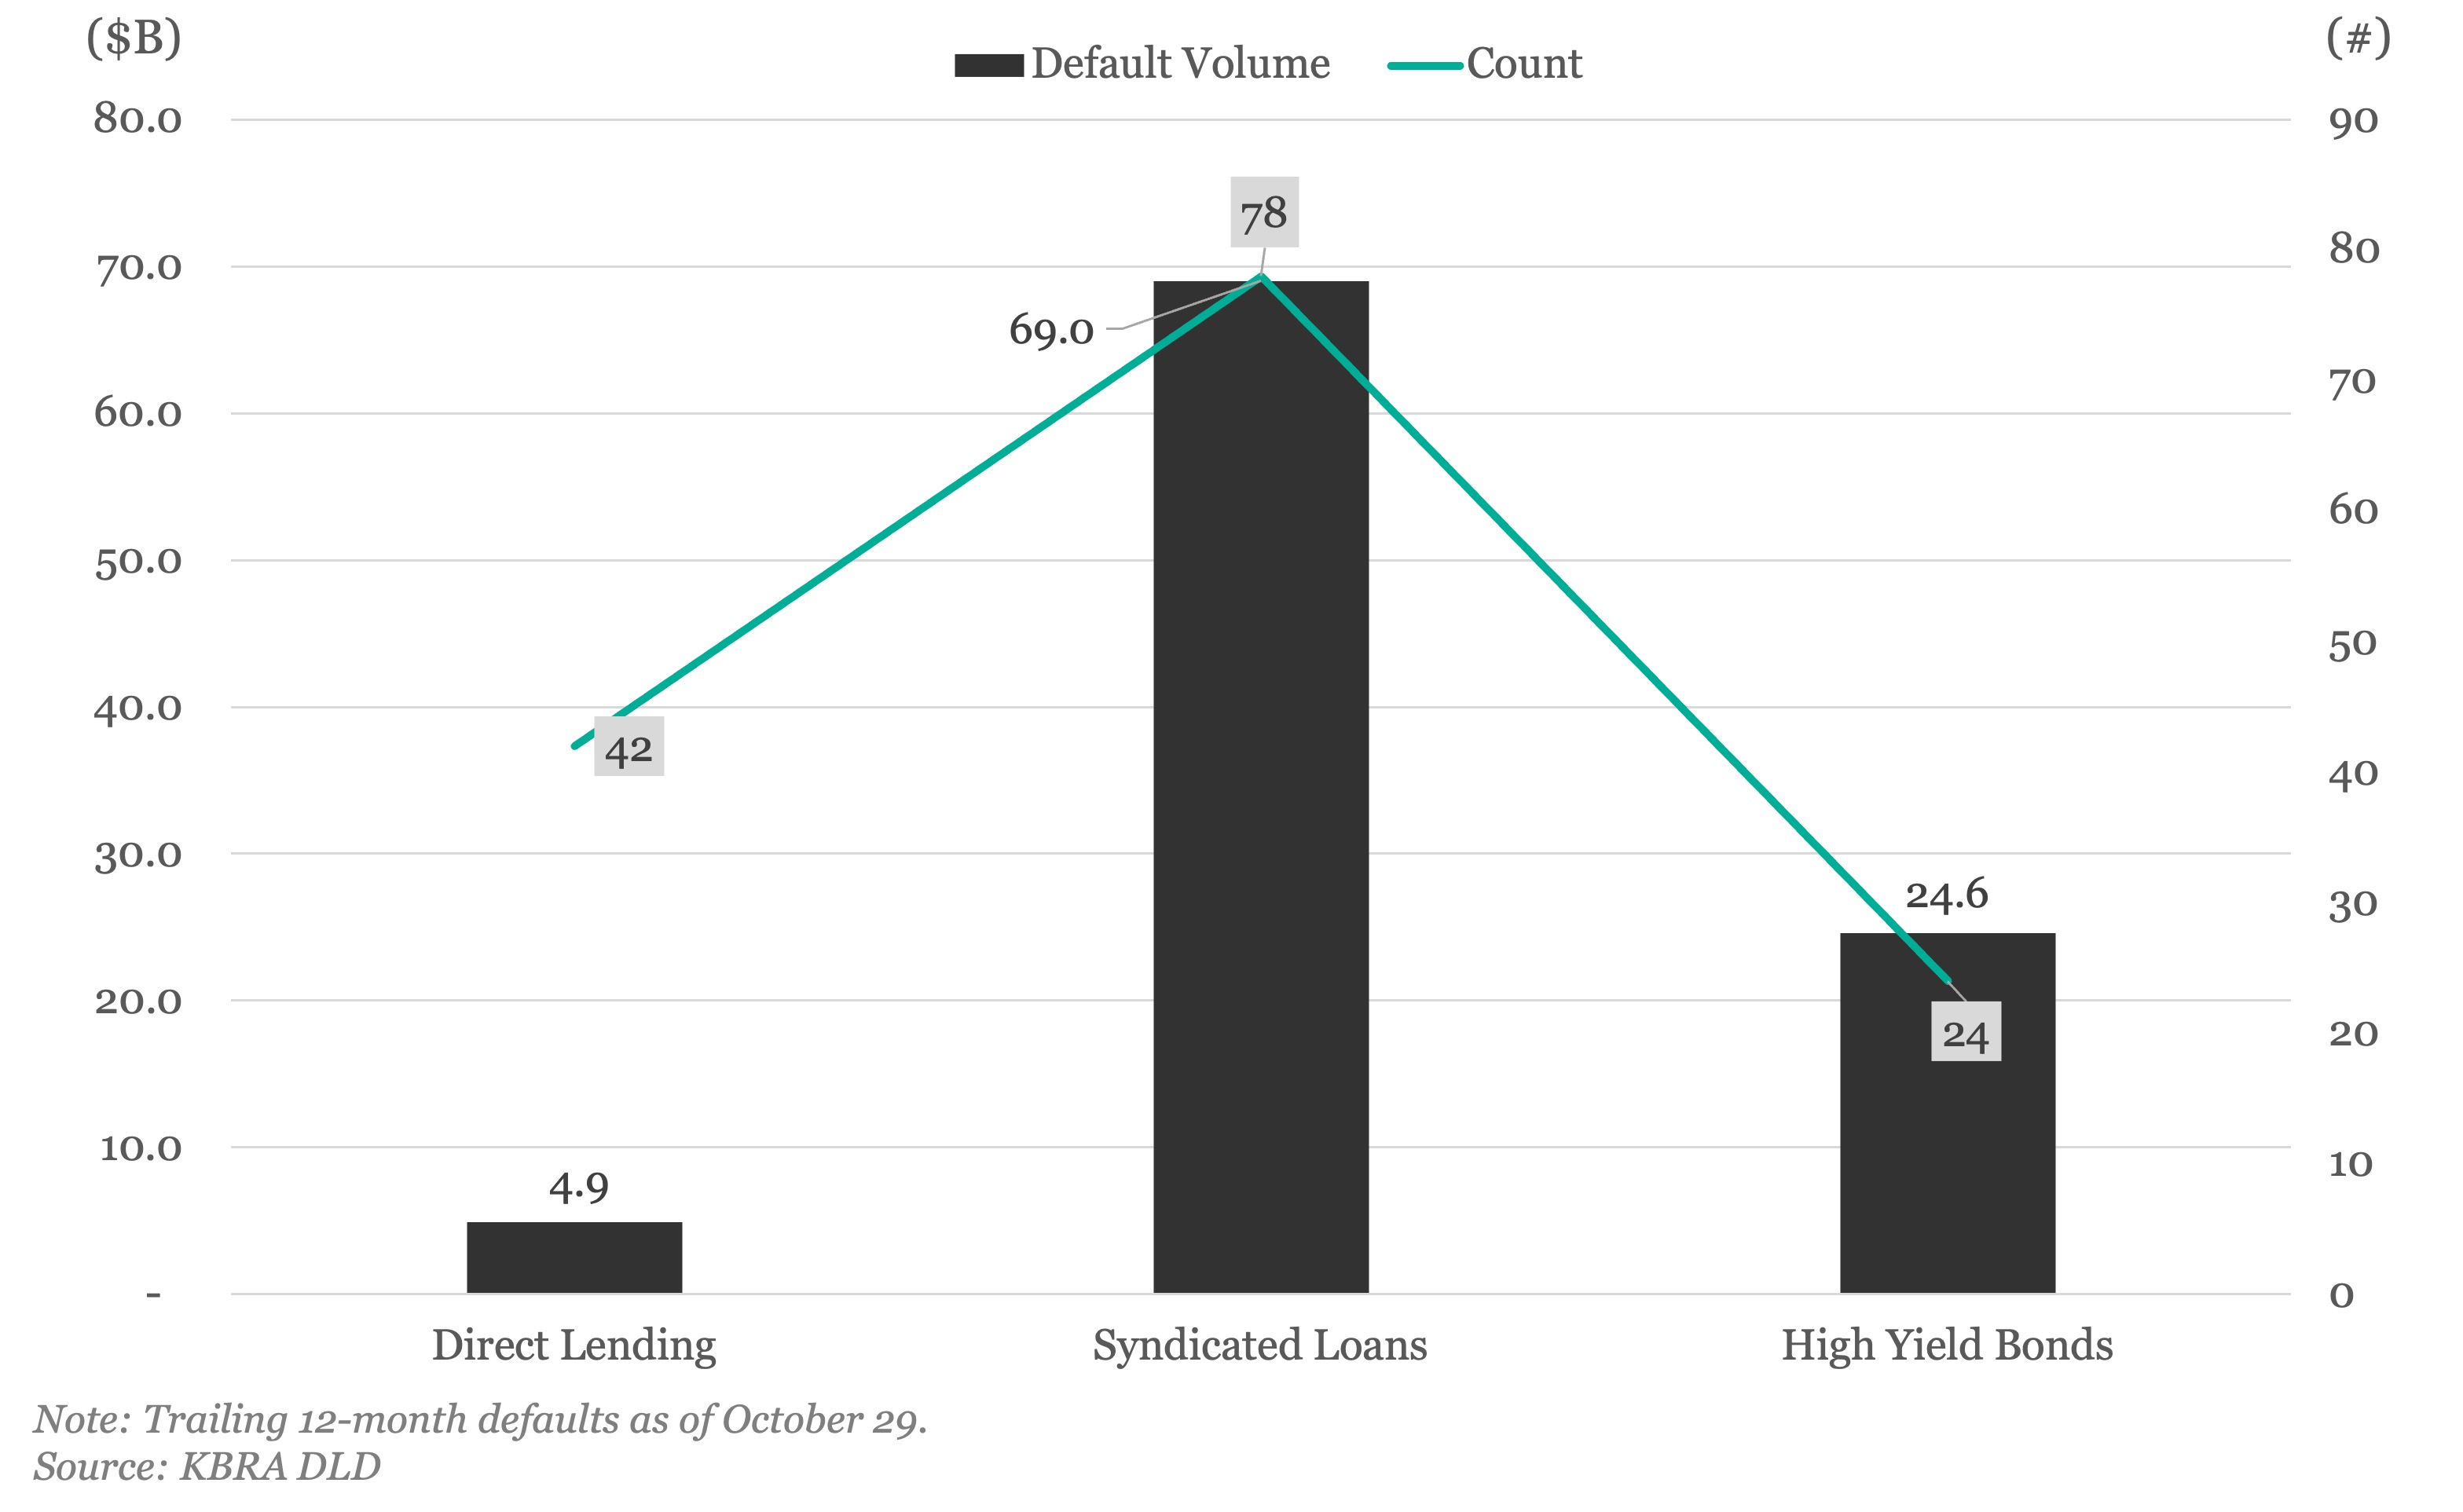
TTM Default Volume, Count

KBRA-1028 image

Contact: Eric Rosenthal / KBRA DLD

Middle Market & Private Credit

Fitchratings-for-newsletters image

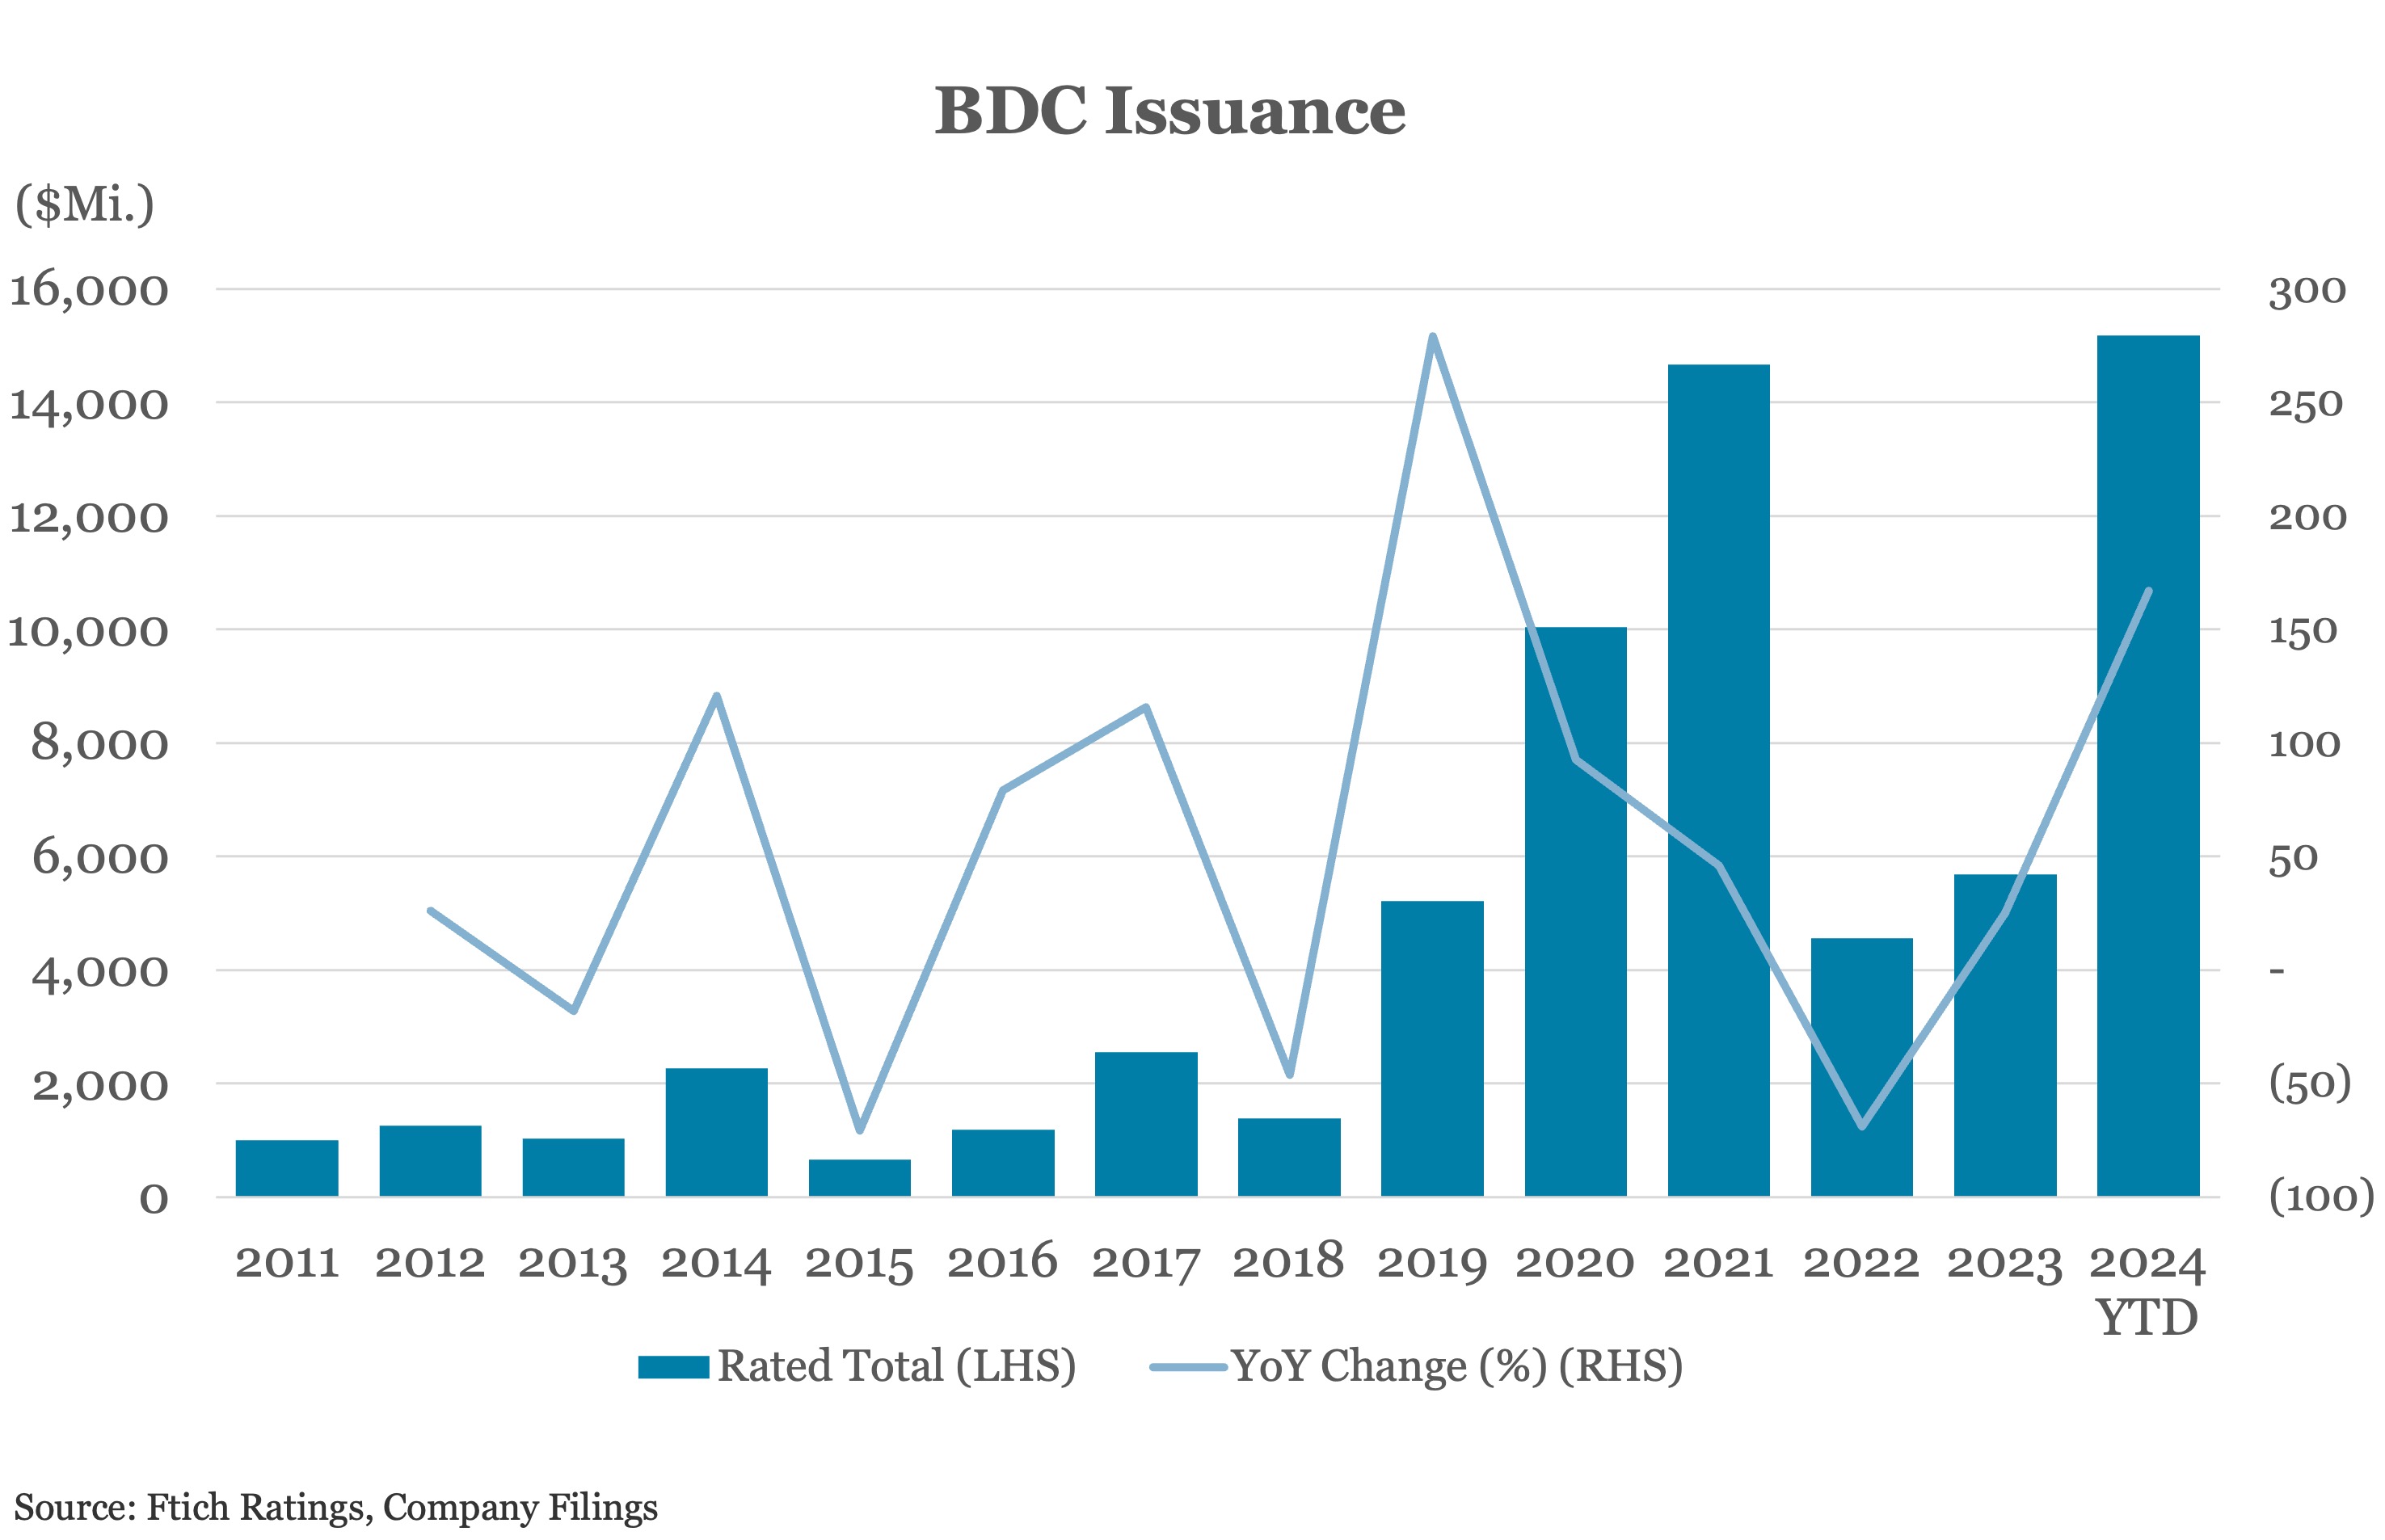
Record U.S. BDC Unsecured Debt Issuance Helps Address Refinance Needs (Part 2)

FR1028 image


Download Report


Since the beginning of September, rated BDCs have collectively issued $4 billion in unsecured debt. Blue Owl Credit Income Corp. accounts for $1.3 billion of this, including a recent AUD450 million Australia dollar-denominated offering...

Read More

Contact: Brad Hamner / FitchRatings

Covenant Trends 

Distribution of Accordion F&C Tranche EBITDA Grower Caps (Q2 2024)

CR-1029 image
Download Data

Contact: Steven Miller / Covenant Review

High-Yield Bond Statistics

Launched Volume

LFI-1029-1 image

New-issue Yields

LFI-1029-2 image

Weekly Fund Flows

LFI-1029-3 image

Weekly fund flows source: Lipper

Download Data

Contact: Robert Polenberg / LevFin Insights

Debtwire Middle-Market

DW-1028 image

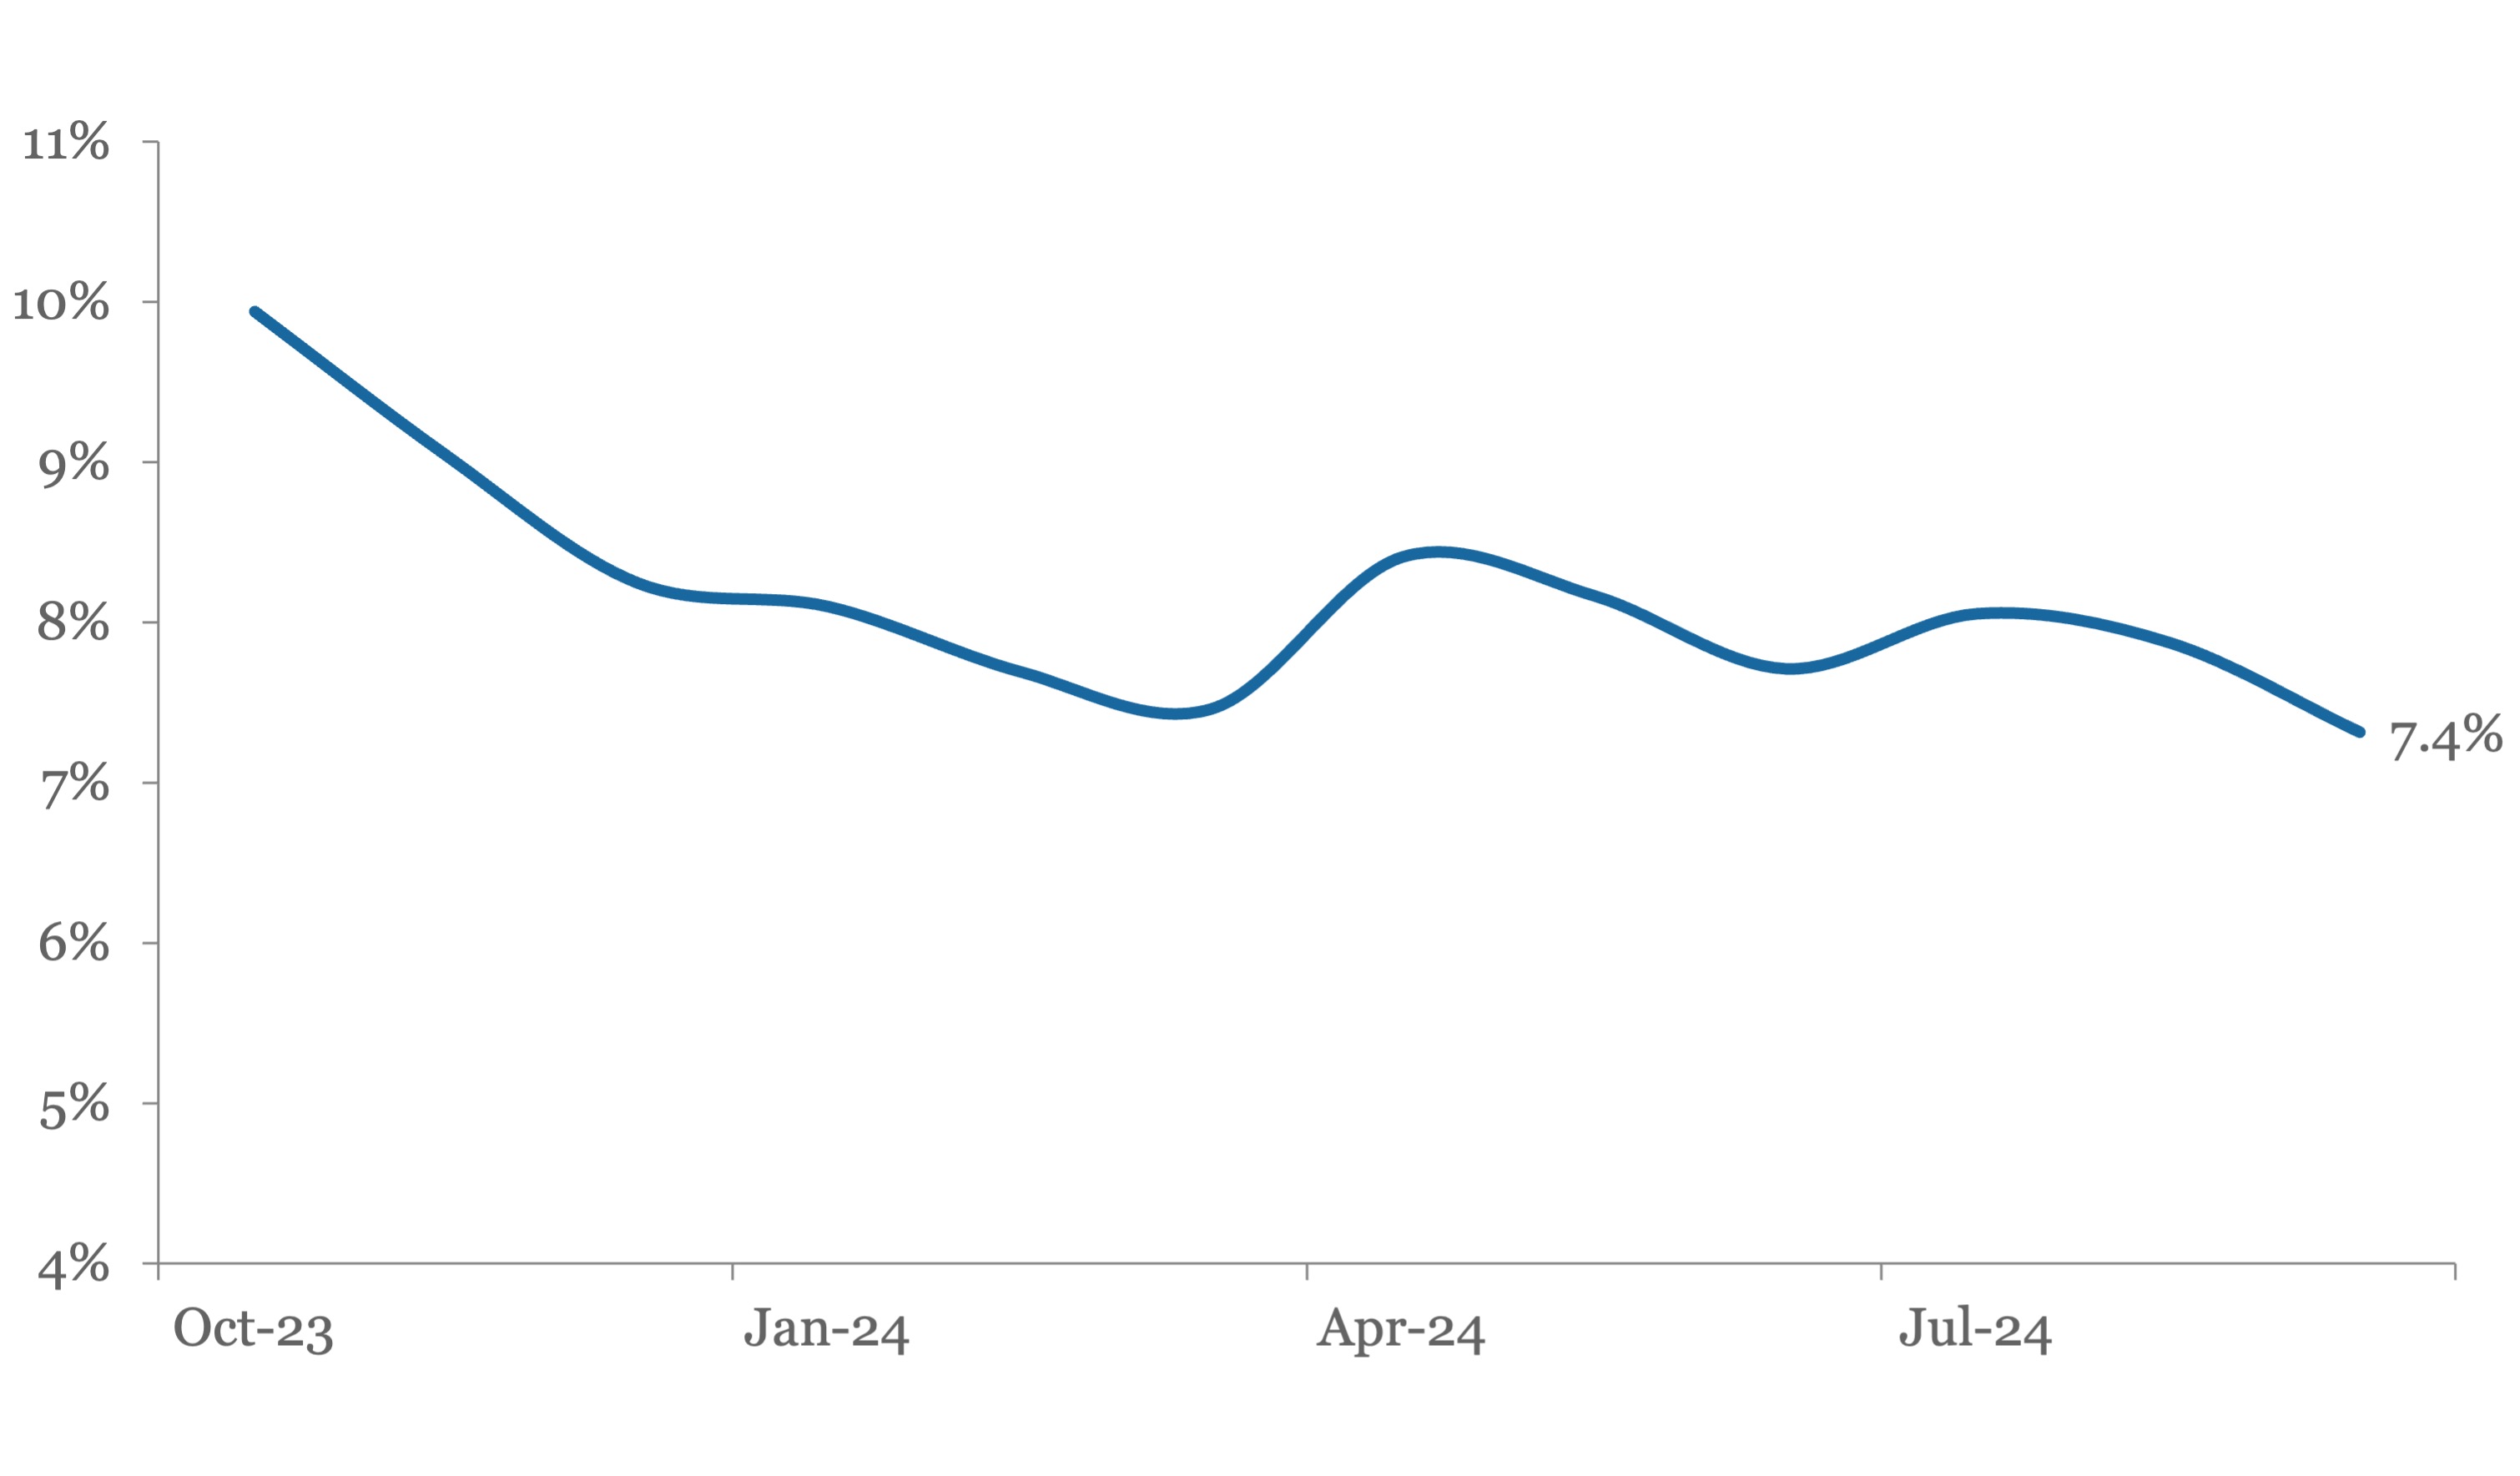
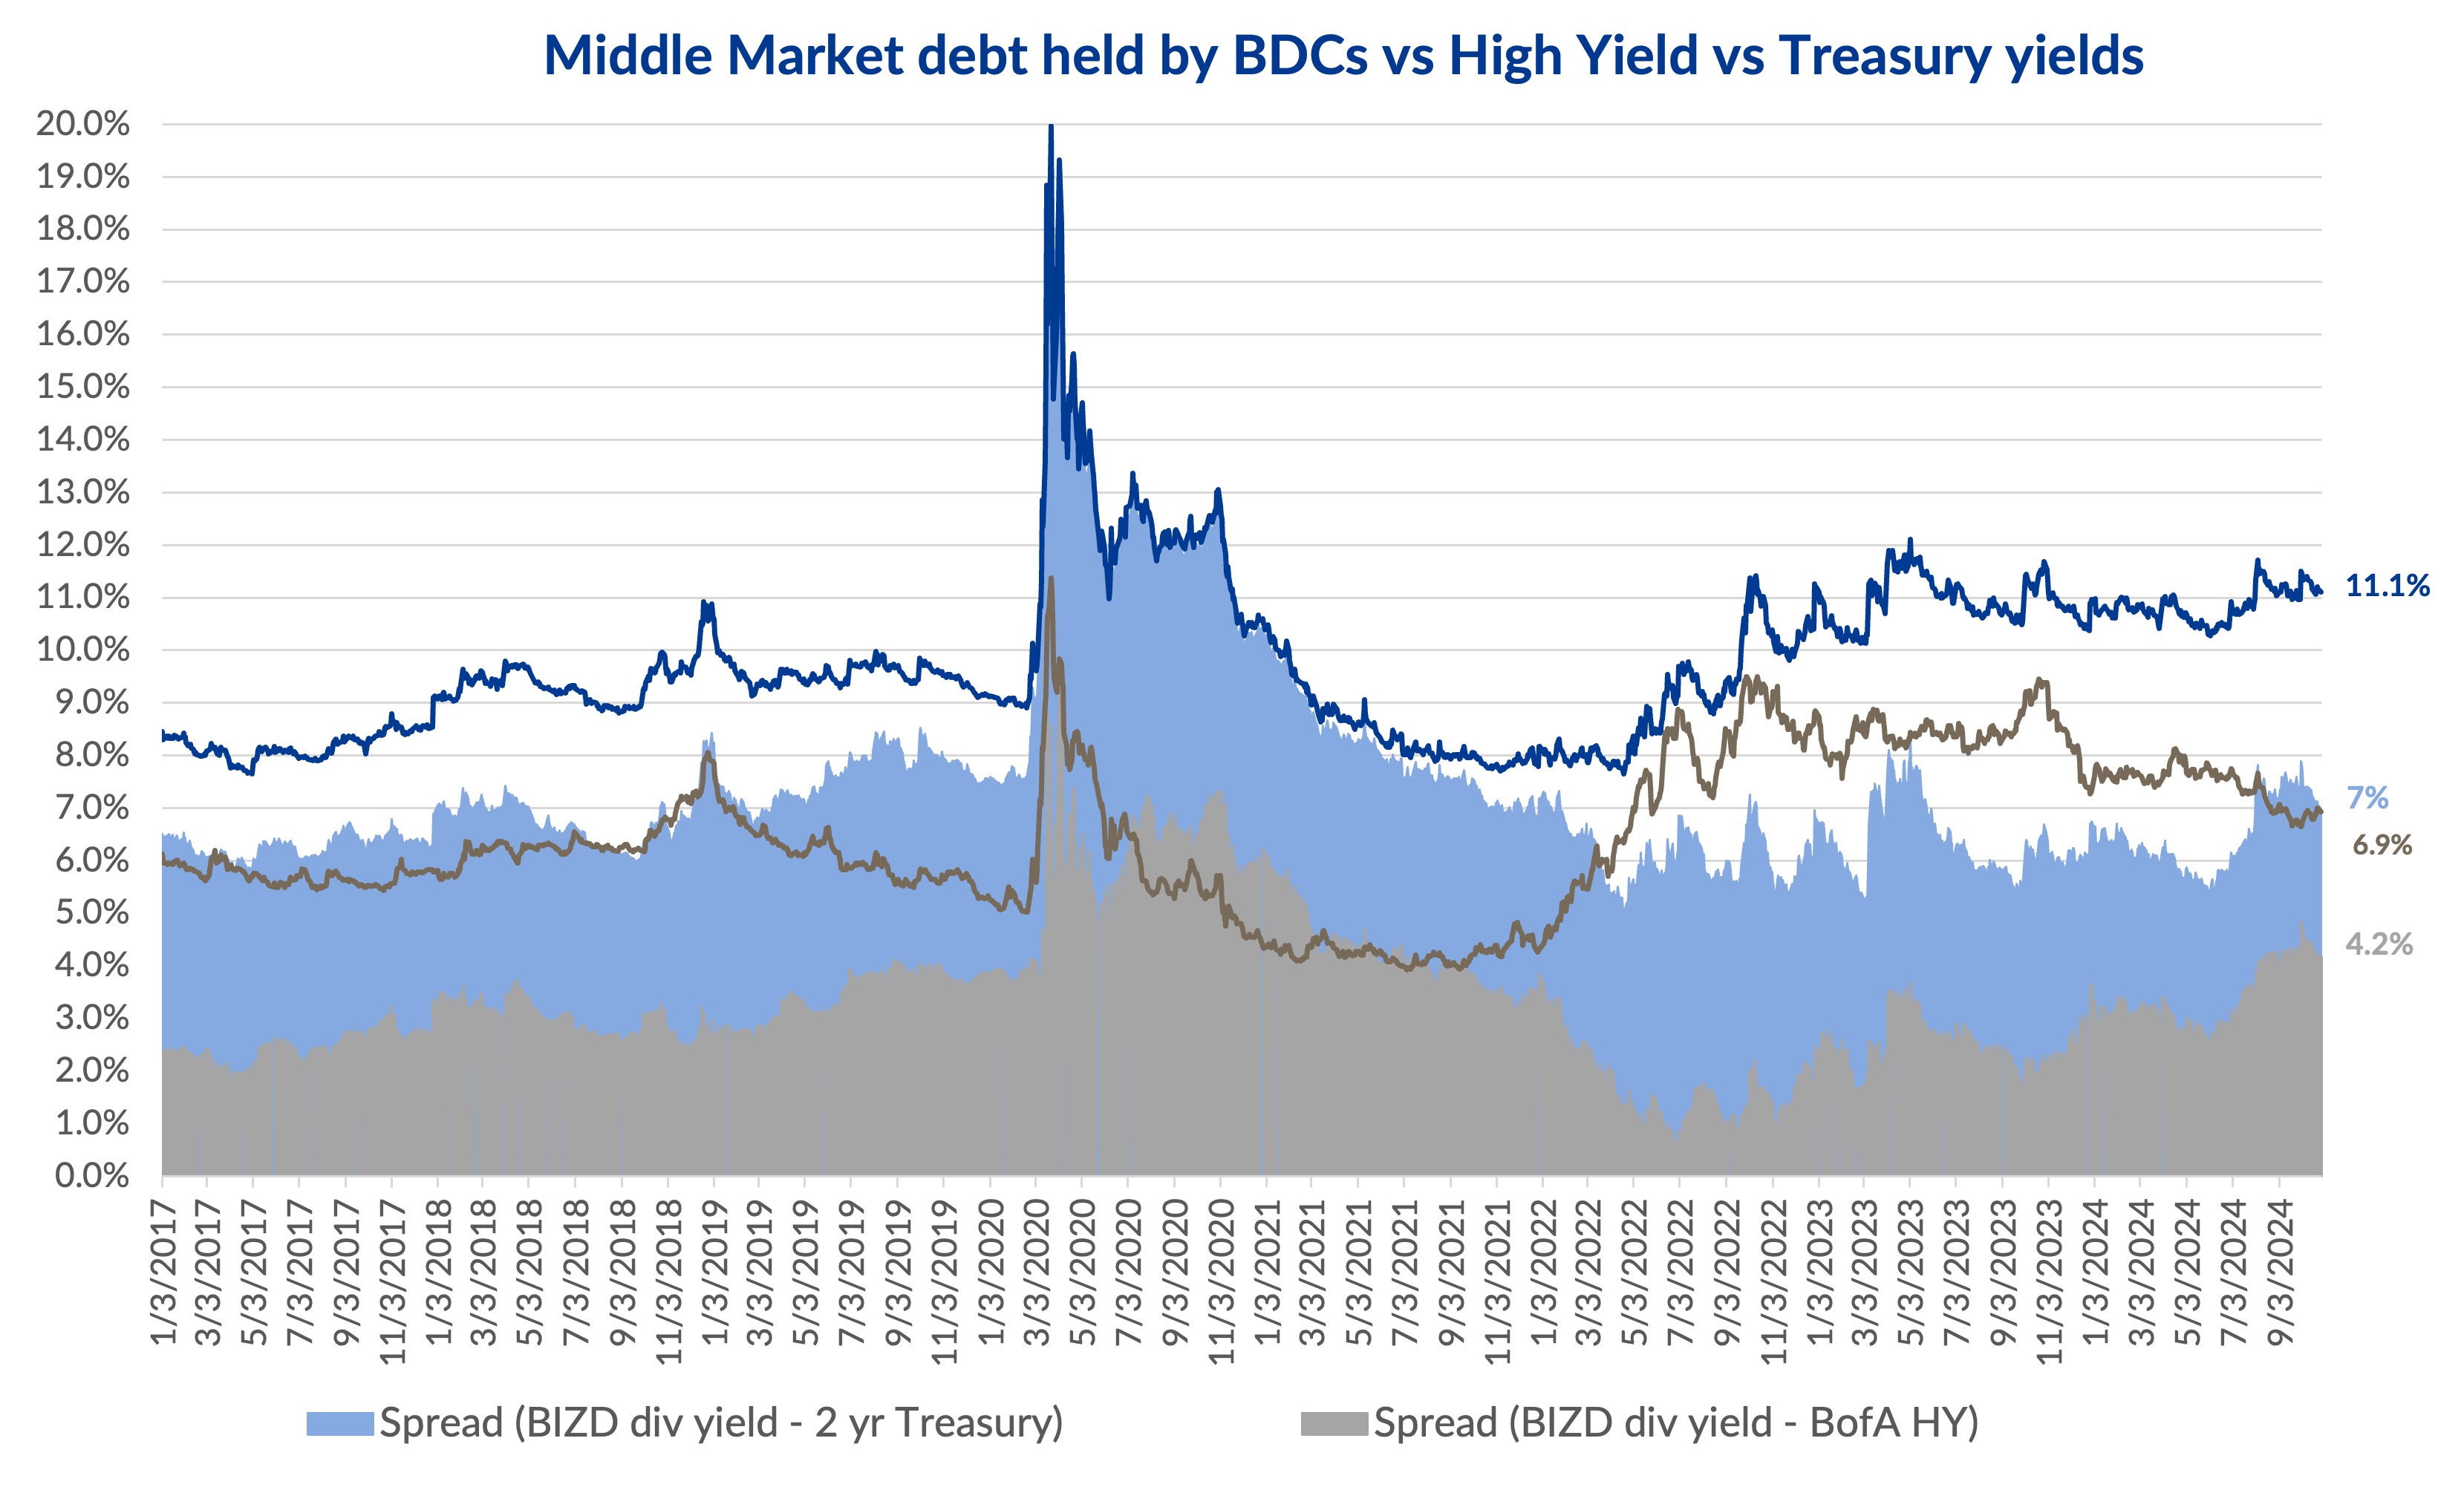
The blue line in the chart is the current dividend yield of the *VanEck BDC Income ETF (currently at 11.1% as of 28 October) that tracks the overall performance of publicly traded business development companies (BDCs, are lenders to privately held middle-market businesses that tend to be below investment grade or not rated, with most lending comprising of senior secured loans)...

Read More & Download Data

Contact: Suneet Chandvani/ Debtwire 

Private Debt Intelligence

Preqin-vF image

Management fees for private debt second lowest

 in private markets

PQ-1021 image

Read more in Preqin’s Private Capital Fund Terms Advisor 2024 report 


Although private debt has been the hot ticket for investors for the past few years, fund managers are now finding it harder to raise funds. The average size of the final close compared to the target size fell from a high of 121% in 2021 to 100% in 2023, while the average time in market has been rising since 2022. This is translating into downward pressure on fees...

Read More & Download Data

Contact: William Bennett-Lynch/ Preqin

Middle Market Deal Terms at a Glance

SPP-2410 image

Contact: Stefan Shaffer / SPP Capital Partners

Churchill-2020-logo-white-for-event-invite image
STAY CONNECTED
Twitter  Linkedin  Youtube  

This publication is a service to our clients and friends. It is designed only to give general information on the market developments actually covered. It is not intended to be a comprehensive summary of recent developments or to suggest parameters for any prospective financing opportunity.