|
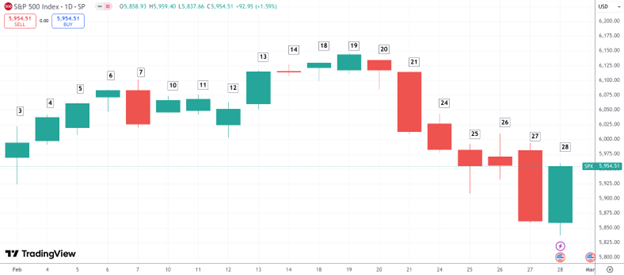
S&P 500 Index - Daily Chart - Feb 3 - 28, 2025 (Source: Tradingview)
February 3
The major stock indexes opened much lower from the previous week’s close (despite notching gains for the day) in response to potential tariffs threatened by President Donald Trump. The Dow fell 122 points, the S&P 500 lost 0.76%, and the Nasdaq closed 0.08% lower. Market stress was largely driven by Apple, Nvidia, and Tesla—tech companies with significant exposure to China.
February 4
The tariff concerns subsided, allowing the market to recover. The Dow gained 134 points, the S&P 500 rose 0.72%, and the Nasdaq closed up 0.14%. Palantir surged 24%, lifting the tech sector along with it.
February 5
As the market approached record highs, it managed to climb despite weakness in major tech stocks. The Dow jumped 317 points, the S&P 500 edged up 0.39%, and the Nasdaq gained 0.87%. Alphabet declined on AI-related concerns, while Tesla, Amazon, and Uber also posted losses.
February 6
The major indexes lost momentum, though tech stocks provided some support. The Dow dropped 217 points, while the S&P 500 and Nasdaq posted gains of 0.36% and 0.34%, respectively. The Nasdaq's strength was buoyed by an 11% rally in Philip Morris on strong ZYN nicotine pouch sales.
February 7
Tariff fears returned to Wall Street, sending the market lower. The Dow fell 444 points, the S&P 500 lost 0.95%, and the Nasdaq declined 1.24%. A consumer sentiment survey reflected growing inflation concerns, while Trump proposed imposing tariffs on any country that levies import duties on U.S. goods.
February 10
The broader market rebounded from its slump, once again approaching record highs. The Dow rose 167 points, the S&P 500 gained 0.67%, and the Nasdaq climbed 1.21%. Tech stocks advanced across the board, while steel stocks rallied in response to import duties imposed by President Trump.
February 11
The market remained mostly stable, with the Dow receiving a boost from a strong earnings report by Coca-Cola. The Dow gained 123 points, while the S&P 500 was nearly unchanged with a 0.03% increase, and the Nasdaq slipped 0.20%. Large-cap tech stocks declined, while the consumer discretionary sector took the lead.
February 12
Stocks initially dropped following a hotter-than-expected inflation report but managed to recover by the end of the session. The Dow fell 225 points, the S&P 500 declined 0.27%, while the Nasdaq edged up 0.32%. The January Consumer Price Index (CPI) rose 0.5%, exceeding expectations by 0.2%.
February 13
Wall Street surged toward record highs, though political uncertainty capped further gains. The Dow climbed 342 points, while the S&P 500 and Nasdaq advanced 1.04% and 0.98%, respectively. President Trump signed a memorandum to explore reciprocal foreign tariffs but stopped short of immediate implementation.
February 14
Wall Street saw a turbulent session, with gains and losses creating a chaotic trading day. The Dow dropped 165 points, the S&P 500 remained nearly flat with a 0.01% decline, while the Nasdaq gained 0.58%. Tech company Mehta extended its winning streak, reaching new highs with a 1.1% gain.
February 18
The S&P 500 reached record highs with a 0.24% increase, while the Dow inched up 10 points and the Nasdaq gained 0.09%. Cyclical sectors led the advance, with energy and material stocks such as Halliburton and Schlumberger rising more than 2%. Steel stocks continued to benefit from tariffs.
February 19
The major indexes mostly stayed in positive territory as the S&P 500 remained at record highs. The Dow gained 71 points, the S&P added 0.24%, while the Nasdaq dipped 0.01%. Microsoft climbed 1.3% after unveiling a new quantum computing chip, while President Trump proposed a 25% tariff on imported autos, chips, and pharmaceuticals.
February 20
Tariff concerns resurfaced, sending stocks into the red. The Dow plunged 450 points, the S&P 500 fell 0.43%, and the Nasdaq declined 0.39%. Investors worried about tariffs' potential impact on corporate earnings, with White House policies further fueling market uncertainty.
February 21
Markets tumbled in a volatile session as the S&P 500 fell further from its highs. The Dow plunged 748 points, the S&P declined 1.71%, and the Nasdaq dropped 2.15%. Concerns over inflation, tariffs, and evolving policies weighed heavily on investor sentiment.
February 24
Still reeling from last week’s steep losses, stocks traded cautiously with slight declines. The Dow eked out a 33-point gain, while the S&P 500 fell 0.50% and the Nasdaq dropped 1.07%. Tech stocks struggled, with Microsoft sliding 1% after an analyst report cited spending cuts in data centers.
February 25
The S&P 500 extended its losing streak to four days as weakness in tech stocks persisted. The Dow was the lone gainer, rising 159 points, while the S&P 500 fell 0.47% and the Nasdaq dropped 1.08%. Investor concerns over tariffs lingered, with Tesla dragging the tech sector lower after its automated driving system failed to meet expectations.
February 26
The market remained indecisive, fluctuating between gains and losses throughout the session. The S&P 500 ended nearly flat, up just 0.01%, while the Dow fell 188 points and the Nasdaq gained 0.36%. After the closing bell, Nvidia reported earnings that exceeded investor expectations.
February 27
Markets stumbled again as tech sector weakness pushed the S&P 500 into negative territory for the year. The Dow dropped 193 points, the S&P 500 slid 1.59%, and the Nasdaq plunged 3.01%. Despite Nvidia’s strong earnings, investors remained cautious about the future of its Blackwell chip.
February 28
Stocks rebounded to close the week and month on a strong note, entering March in positive territory. The Dow surged 601 points, the S&P 500 gained 1.59%, and the Nasdaq climbed 1.34%. Tech stocks contributed to the rally, but the biggest market disruptor was the heated meeting between President Donald Trump and Ukrainian President Volodymyr Zelenskyy.
|