August 2026 - Investment Newsletter

KEY TAKEAWAYS


>>  August presented a mixed economic backdrop, as inflation remained above the Federal Reserve's target, labor market conditions softened, and consumer confidence weakened, while underlying private-sector demand and corporate earnings remained resilient.

>>  Inflation showed mixed progress. July CPI eased to 3.4% year over year, while the Federal Reserve's preferred PCE measure remained elevated at 3.7%, reinforcing an uneven path toward price stability.

>> Labor market conditions softened as nonfarm payrolls declined by 23,000 in July and labor-force participation fell to 61.4%. Wage growth slowed to its weakest pace of 2026 and remained slightly below inflation.

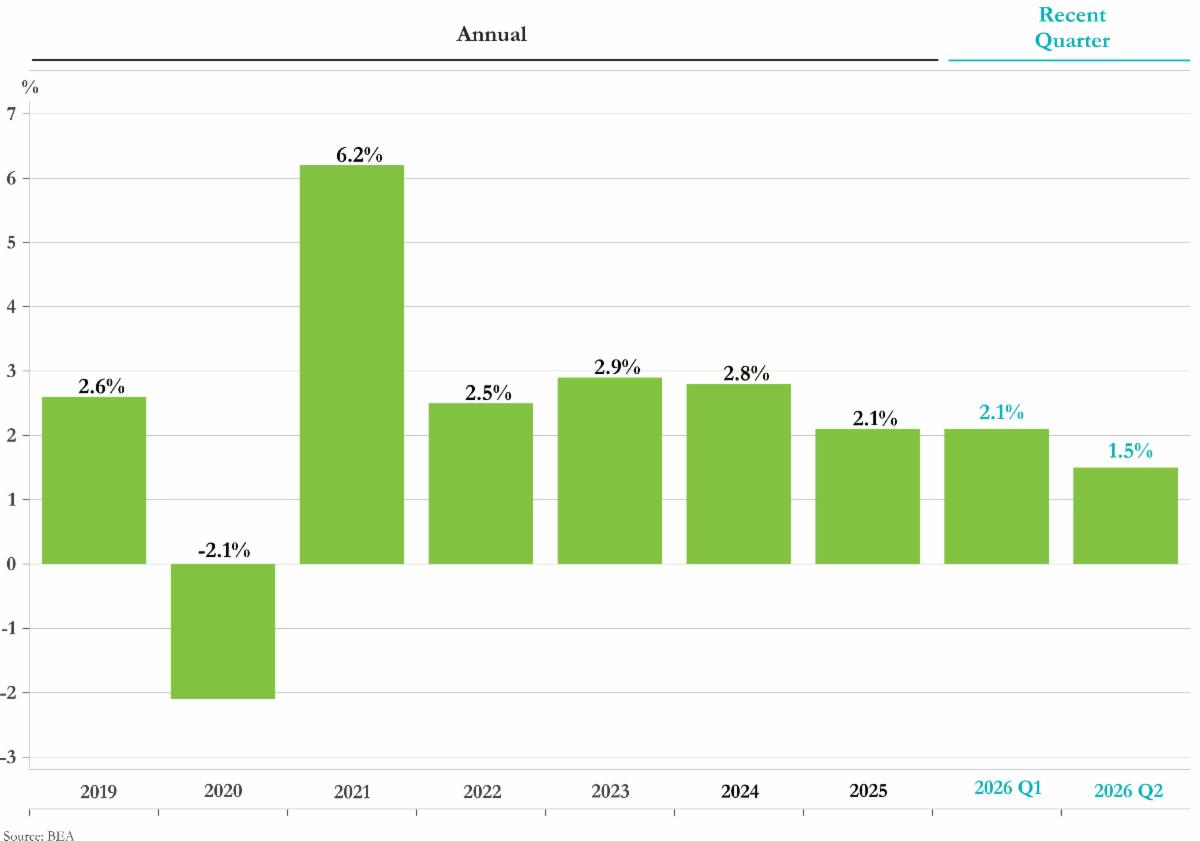
>> Real GDP grew at a 1.5% annualized rate in Q2, down from 2.1% in Q1, although real final sales to private domestic purchasers increased 4.2%, suggesting underlying consumer and business demand remained stronger than the headline figure implied.

  • Consumer confidence weakened in August, with the University of Michigan sentiment index falling to 51.7 and the Conference Board index declining to 89.4 as households remained concerned about inflation, affordability, and the economic outlook.


  • With no scheduled policy meeting in August, Chair Kevin Warsh's hawkish Jackson Hole remarks became the month's most important Federal Reserve signal, prompting markets to price a September rate increase as more likely than not.


  • Treasury yields were highly volatile during August. Yields initially declined following weak employment data and expanded Treasury buyback plans but reversed sharply higher after Jackson Hole and renewed U.S.-Iran tensions. The 10-year Treasury yield ended August near 4.75%, while the 30-year briefly reached 5.34%, its highest level since 2007.


  • The U.S. national debt surpassed $40 trillion during August, reinforcing concerns surrounding federal deficits, Treasury issuance, and long-term borrowing costs.


  • U.S.-Canada trade tensions escalated after negotiations collapsed, with both countries announcing significant new tariff measures. While additional negotiations could still alter the outcome, the dispute has increased concerns about inflation, supply chains, and broader North American trade relations.


  • U.S. equities advanced as strong corporate earnings and renewed enthusiasm surrounding artificial intelligence offset pressure from rising interest rates. Technology and software companies led the late-month rally after several prominent firms reported strong results and guidance.


  • International equity performance was positive but uneven, with emerging markets and Japan outperforming while European and Hong Kong markets were more subdued, reflecting diverging growth, currency, and policy trends.


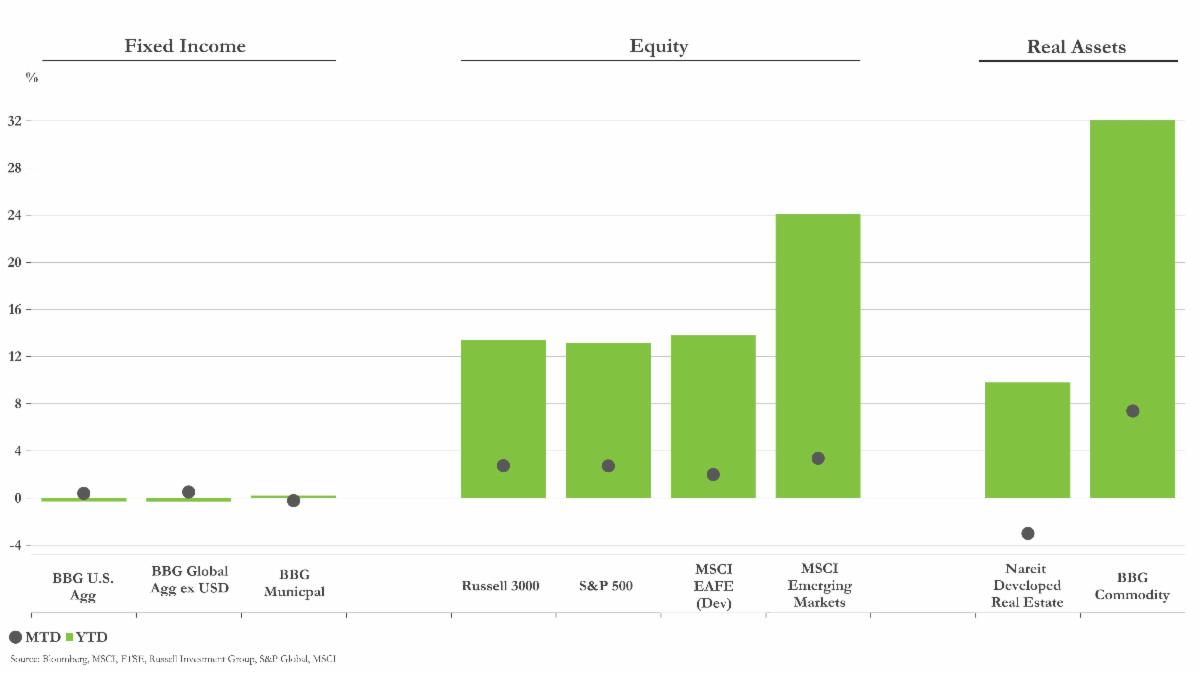
  • Commodities strengthened amid geopolitical uncertainty, inflation concerns, and supply constraints. Gold gained approximately 9.7%, copper rose about 3.7%, and oil prices experienced substantial intramonth volatility as investors monitored developments involving Iran and the Strait of Hormuz.


  • Overall, August demonstrated that markets remain supported by resilient private-sector demand and strong corporate earnings but increasingly sensitive to elevated inflation, higher long-term interest rates, fiscal concerns, trade tensions, and geopolitical risk. Maintaining a disciplined and diversified approach remains particularly important as investors assess whether economic resilience can continue to offset a more restrictive policy environment. 


Asset Class Performance as of 8/31/2026


ECONOMY


Growth Moderates, Confidence Weakens


  • U.S. real GDP grew at a 1.5% annualized rate in Q2, down from 2.1% in Q1, reflecting a moderation in growth rather than a significant deterioration in economic activity.


  • Consumer confidence weakened in August as households remained concerned about inflation, affordability, and the economic outlook. Consumer spending growth slowed during the month, suggesting greater selectivity across discretionary purchases.


  • Wage growth continued to decelerate and remained below the pace of inflation, limiting improvements in purchasing power and creating a more challenging backdrop for consumer spending heading into the second half of the year.


U.S. GDP Growth


Inflation Remains Stubborn


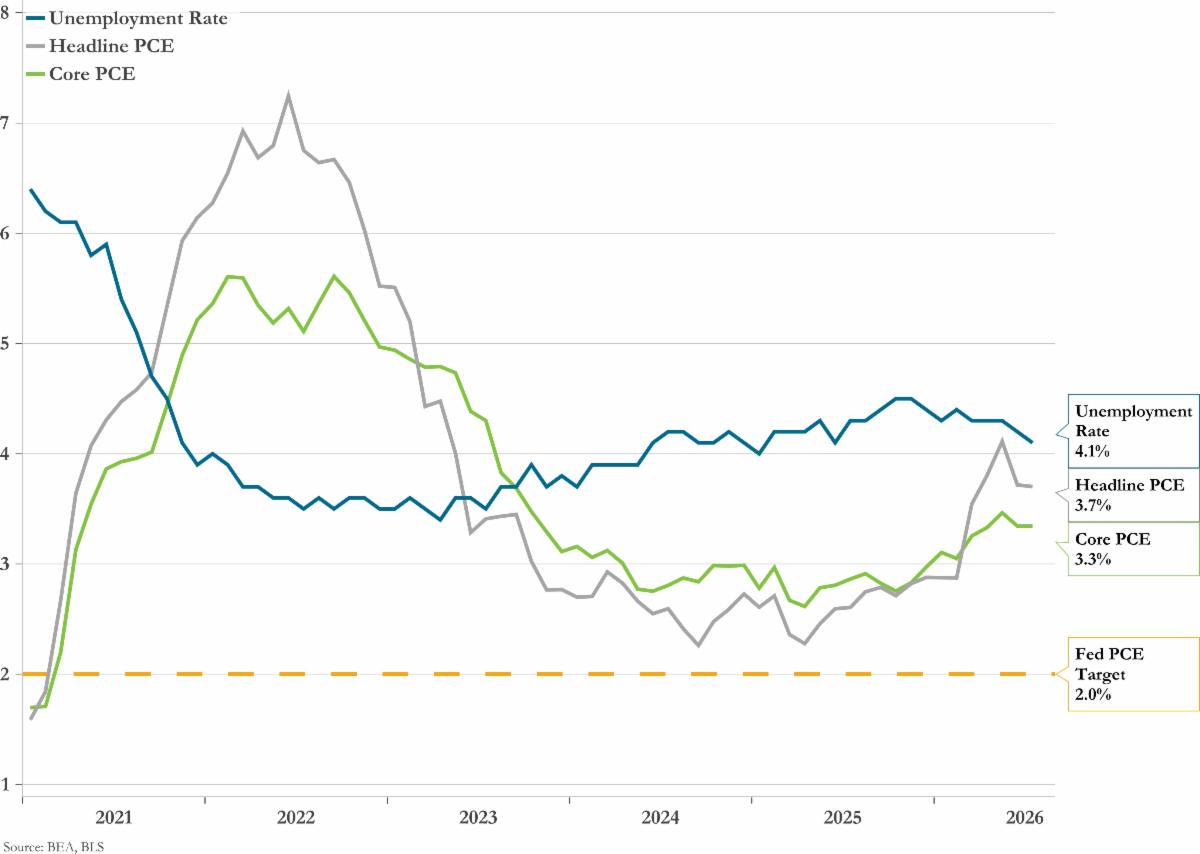
  • Inflation signals remained mixed, as headline and core CPI moderated in July while headline and core PCE remained elevated at 3.7% and 3.3%, respectively.


  • At Jackson Hole, Chair Kevin Warsh reaffirmed the Federal Reserve’s commitment to its 2% inflation objective and emphasized that policymakers still had work to do, prompting markets to price a September rate increase as more likely than not.


  • Tariffs, elevated energy prices, and continued infrastructure spending represent potential upside inflation risks, while slower wage growth and weaker hiring suggest a cooling economy. These competing forces create uncertainty around the future path of inflation and monetary policy.


Unemployment and PCE Inflation


Higher Rates Tighten Financial Conditions


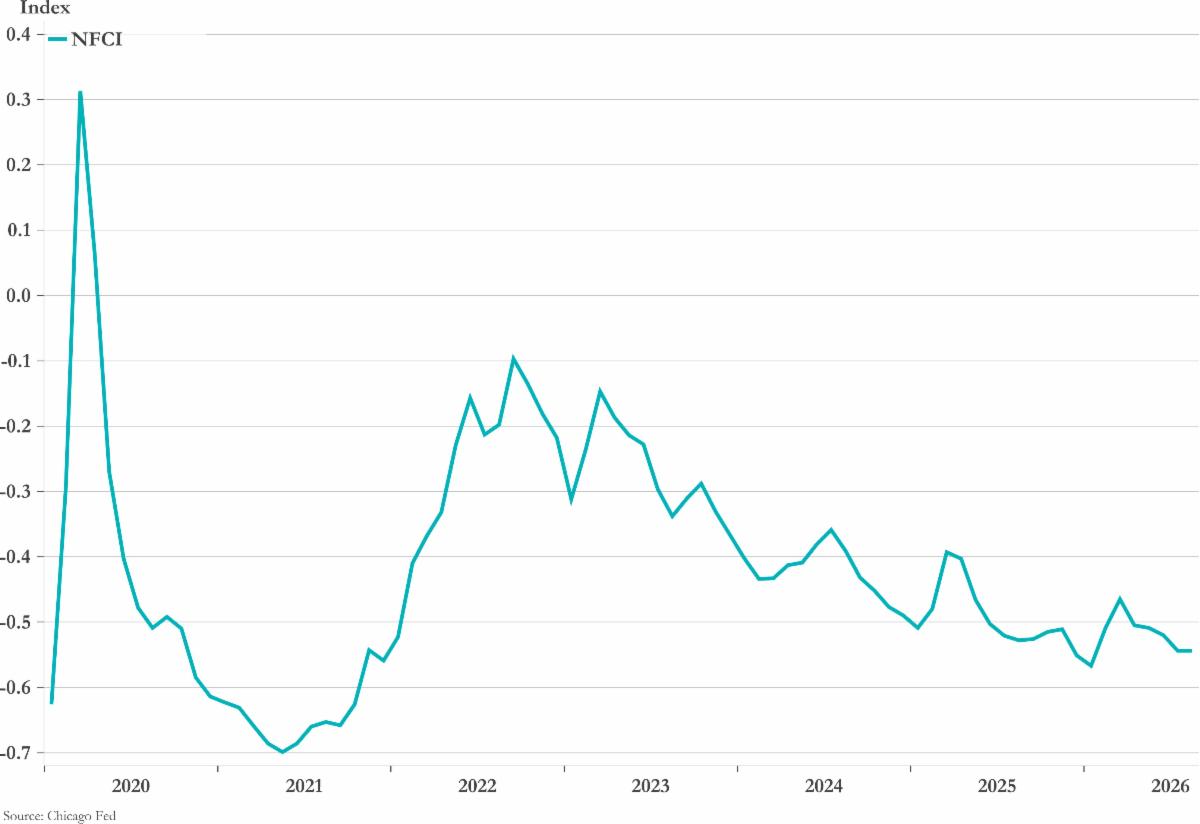
  • Rising rate volatility increased uncertainty across financial markets as investors repeatedly reassessed expectations for Federal Reserve policy, inflation, and long-term borrowing costs. Higher and less predictable yields weighed on bond prices and pressured equity valuations.


  • The sharp rise in longer-term Treasury yields pressured interest-rate-sensitive assets and reinforced the view that financial conditions may remain restrictive even without additional Fed action. Higher borrowing costs can slow business investment, weigh on housing activity, and reduce demand for large credit-financed purchases.


  • More broadly, elevated long-term yields have become an increasingly important market signal, influencing everything from equity valuations and mortgage rates to corporate borrowing costs and GDP growth expectations.


Federal Reserve Bank of Chicago

National Financial Conditions Index (NFCI)


MARKETS


Earnings Boost Equities


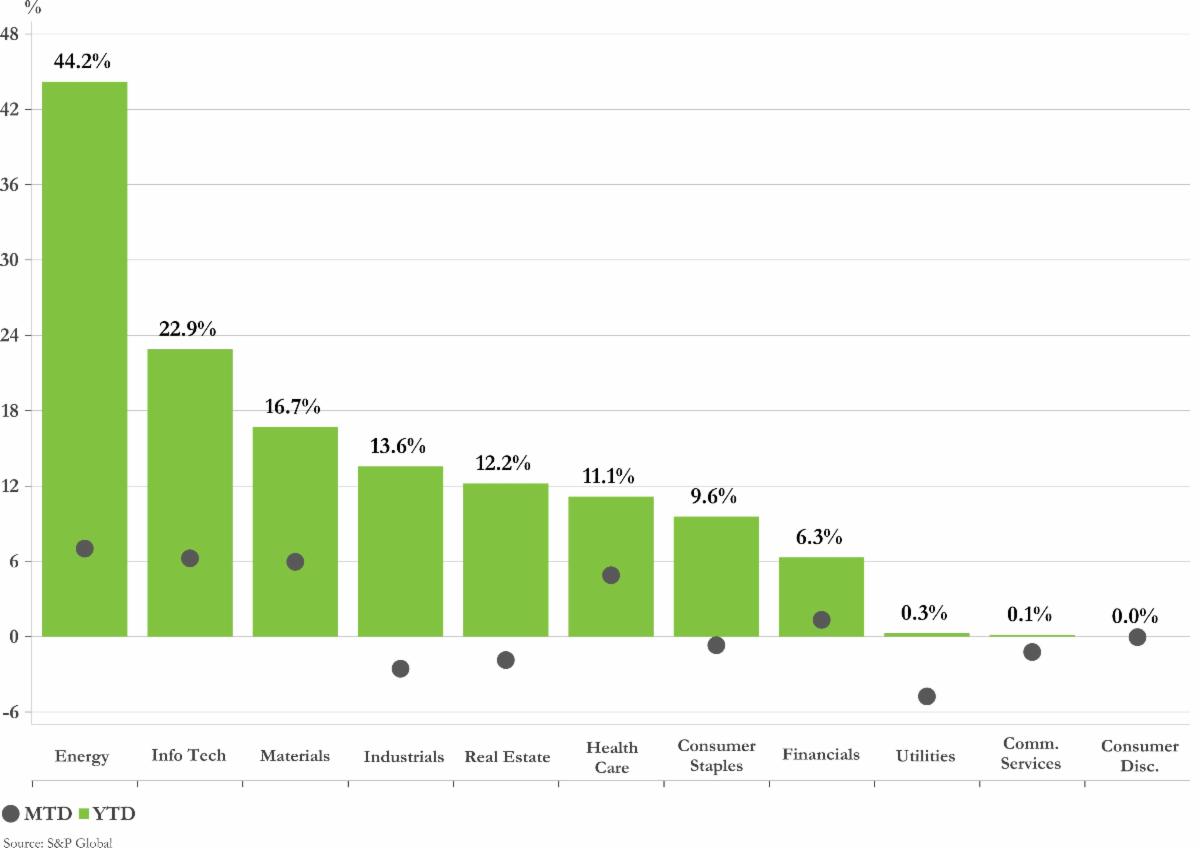
  • Global equities generally advanced in August, although performance varied significantly across regions as emerging markets and Japan outperformed Europe and Hong Kong.


  • U.S. market leadership favored technology, software, health care, energy, and materials, while utilities, industrials, and other rate-sensitive areas came under pressure as long-term Treasury yields rose.


  • Strong results and guidance from several major technology companies reinforced confidence in AI-related spending and helped support a late-month equity rally, while resilient credit spreads suggested that investors remained constructive on corporate fundamentals.


S&P 500 Sector Returns


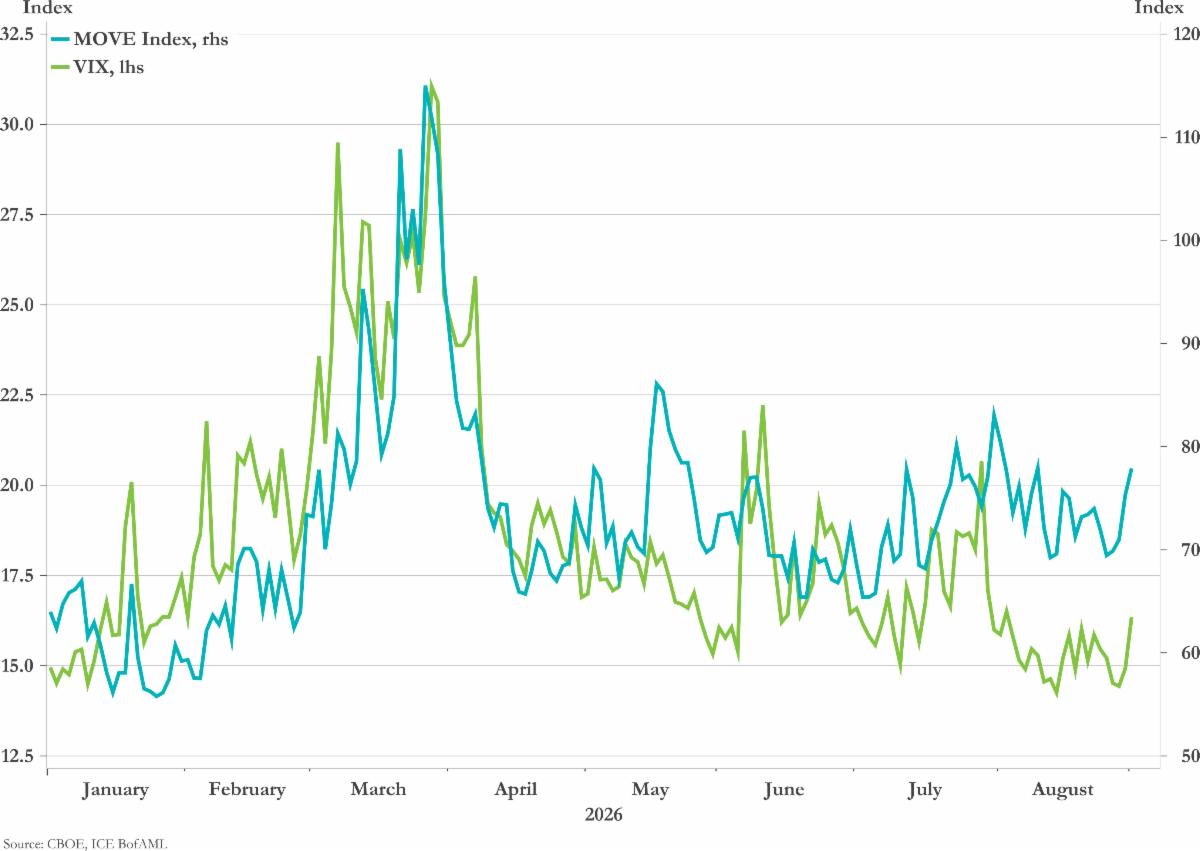
Interest Rate Volatility Returns


  • Treasury yields were highly volatile in August, initially declining following weak employment data and expanded Treasury buyback plans before reversing sharply higher after Jackson Hole and renewed Middle East tensions revived inflation concerns.


  • The 10-year Treasury yield ended August near 4.75%, while the 30-year briefly reached 5.34%, its highest level since 2007, before finishing near 5.24%. Elevated deficits, Treasury issuance, and inflation uncertainty continued to pressure longer-dated yields.


  • Despite temporary support from Treasury buybacks, investors remained focused on whether rising long-term yields represent a short-term repricing or a more durable shift higher in borrowing costs.


MOVE Index and VIX


Commodities Surge to Middle East Risks


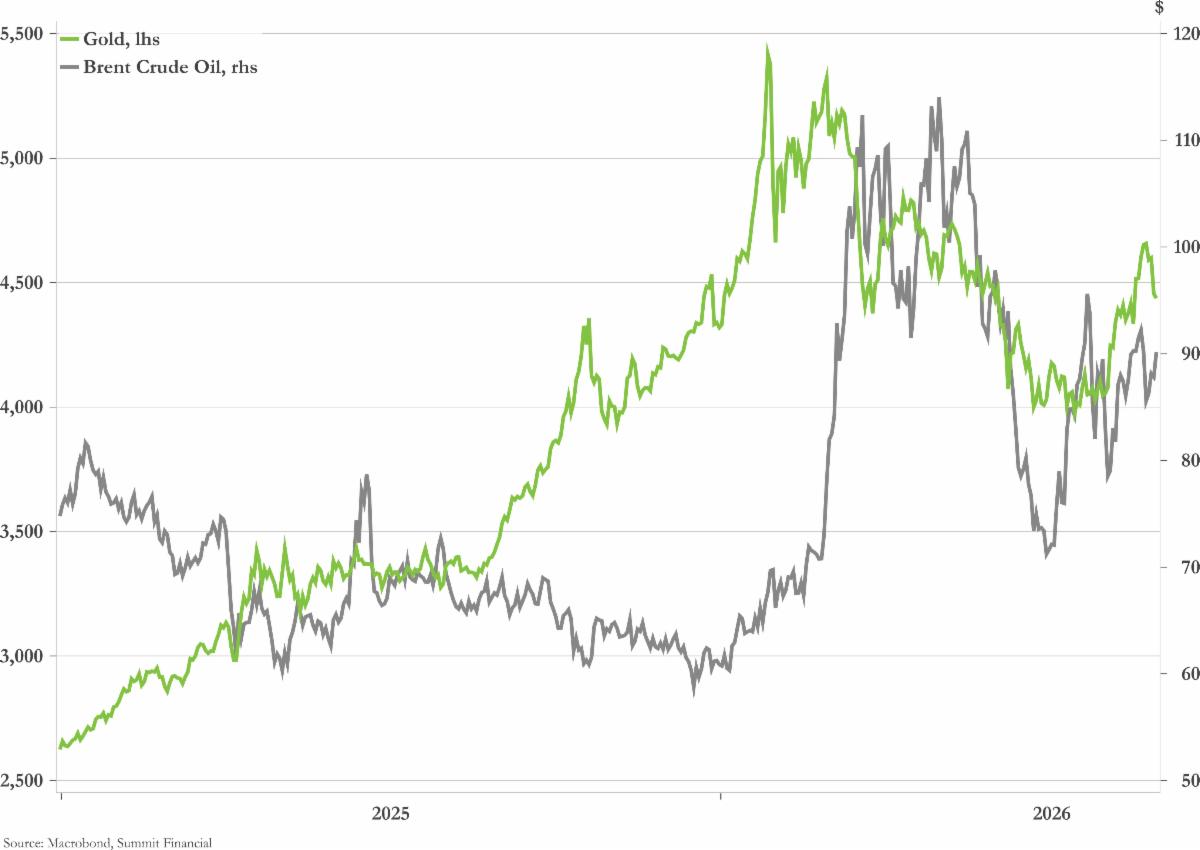
  • Energy markets remained volatile as changing prospects for U.S.-Iran negotiations and uncertainty surrounding shipping through the Strait of Hormuz drove sharp swings in oil prices, although WTI and Brent finished the month with comparatively modest gains.


  • Gold gained approximately 9.7% as ETF inflows, geopolitical uncertainty, fiscal concerns, and shifting rate expectations supported renewed demand for precious metals.


  • Copper advanced approximately 3.7% amid supply constraints and tariff-related stockpiling, while several agricultural commodities also recorded strong gains during the month.


Gold & Brent Crude Oil - Spot Prices


DISCLAIMER

Compliance Code: 9110796.1


This commentary was authored by the investment team at Summit Financial, LLC., an SEC Registered Investment Adviser (“Summit”), headquartered at 4 Campus Drive, Parsippany, NJ 07054, Tel. 973-285-3600. It is provided for your information and guidance and is not intended as specific advice and does not constitute an offer to sell securities. Summit is an investment adviser and offers asset management and financial planning services. Indices are unmanaged and cannot be invested into directly.


Data in this newsletter is obtained from sources which we, and our suppliers believe to be reliable, but we do not warrant or guarantee the timeliness or accuracy of this information. Consult your financial professional before making any investment decision. Past performance is no guarantee of future results. Diversification/asset allocation does not ensure a profit or guarantee against a loss. Economic and market forecasts presented herein reflect our judgment as of the date of this presentation and are subject to change without notice. Any forecasts are subject to high levels of uncertainty that may affect actual performance. Accordingly, forecasts should be viewed as merely representative of a broad range of possible outcomes. Forecasts are estimated, based on assumptions, and are subject to significant revision and may change materially as economic and market conditions change. Forecasts do not take into account the specific investment objectives, restrictions, tax and financial situation or other needs of any specific client.


DEFINITIONS & DESCRIPTIONS


BBG U.S. Agg

Bloomberg U.S. Aggregate Bond Index

The Bloomberg U.S. Aggregate Bond Index is a broad-based flagship benchmark that measures the investment grade, U.S. dollar-denominated, fixed-rate taxable bond market. The index includes Treasuries, government-related and corporate securities, MBS (agency fixed-rate pass-throughs), ABS, and CMBS (agency and non-agency).


BBG Global Agg ex USD

Bloomberg Global Aggregate Index

The Bloomberg Global Aggregate Index is a flagship measure of global investment grade debt from twenty-four local currency markets. This multi-currency benchmark includes Treasury, government-related, corporate, and securitized fixed-rate bonds from both developed and emerging markets issuers.


BBG Municipal

Bloomberg Municipal Bond Index

The Bloomberg Municipal Bond Index covers the U.S. dollar-denominated long-term tax-exempt bond market. The index has four main sectors: state and local general obligation bonds, revenue bonds, insured bonds, and pre-refunded bonds.


Russell 3000

Russell 3000 Index

The Russell 3000 Index measures the performance of the largest 3,000 U.S. companies representing approximately 98% of the investable U.S. equity market. It is constructed to provide a comprehensive, unbiased, and stable barometer of the broad market and is completely reconstituted annually to ensure new and growing equities are included.


Russell 2000

Russell 2000 Index

The Russell 2000 Index measures the performance of the small-cap segment of the U.S. equity universe. It is a subset of the Russell 3000 Index repre-senting approximately 10% of the total market capitalization of that index. It includes approximately 2,000 of the smallest securities based on a combi-nation of their market cap and current index membership.


S&P 500

S&P 500 Index

The S&P 500 Index is a market capitalization-weighted index of 500 widely held stocks often used as a proxy for the stock market. It measures the movement of the largest issues. Standard and Poor’s chooses the member companies for the 500 based on market size, liquidity, and industry group representation. Included are the stocks of eleven different sectors.


MSCI EAFE (Dev)

MSCI EAFE Index

The MSCI EAFE Index (Europe, Australasia, Far East) captures large- and mid-cap representation across developed markets countries around the world, excluding the U.S. and Canada. The index covers approximately 85% of the free float-adjusted market capitalization in each country.


MSCI Emerging Markets

MSCI Emerging Markets Index

The MSCI Emerging Markets Index captures large- and mid-cap representation across emerging markets countries across the world. The index covers approximately 85% of the free float-adjusted market capitalization in each country.


HFRI Fund Weighted Composite

HFRI Fund Weighted Composite Index

The HFRI Fund Weighted Composite Index is a global, equal-weighted index of single-manager funds that report to HFR Database. Constituent funds report monthly net of all fees performance in US Dollar and have a minimum of $50 Million under management or $10 Million under management and a twelve (12) month track record of active performance. The HFRI Fund Weighted Composite Index does not include Funds of Hedge Funds.


Nareit Developed Real Estate

FTSE EPRA/NAREIT Developed Index

The FTSE EPRA/NAREIT Developed Index is designed to track the performance of listed real estate companies and REITS worldwide. Index constituents are free float-adjusted, subject to liquidity, size, and revenue screening for inclusion.


BBG Commodity

Bloomberg Commodity Index

The Bloomberg Commodity Index reflects commodity futures price movements and is calculated on an excess return basis. The index rebalances annually weighted 2/3 by trading volume and 1/3 by world production, and weight-caps are applied at the commodity, sector, and group level for diversification. The roll period typically occurs from the 6th-10th business day based on the roll schedule.


Consumer Confidence Index

Conference Board Consumer Confidence Index

The Consumer Confidence Index is a measure based on a survey administered by The Conference Board that reflects prevailing business conditions and likely developments for the months ahead. This monthly report details consumer attitude, buying intentions, vacation plans, and consumer expectations for inflation, stock prices, and interest rates.


U.S. Dollar Index (DXY)

U.S. Dollar Index (DXY)

The U.S. Dollar Index (DXY) is an index of the value of the United States dollar relative to a basket of foreign currencies, often referred to as a basket of U.S. trade partners' currencies. The Index goes up when the U.S. dollar gains "strength" (value) when compared to other currencies.


DJIA

Dow Jones Industrial Average

The Dow Jones Industrial Average (DJIA), commonly known as “The Dow”, is a price-weighted measure of 30 U.S. blue-chip companies. The index covers all industries except transportation and utilities.


ISM Manufacturing Index

ISM Manufacturing Index

The ISM Manufacturing Index, also known as the purchasing managers’ index (PMI), is a monthly indicator of U.S. economic activity based on a survey of executives covering all North American Industry Classification System’s businesses in the manufacturing sector.


ISM Non-Manufacturing Index

ISM Non-Manufacturing Index

The ISM Non-Manufacturing Index is a monthly indicator of U.S. economic activity based on a survey of executives covering all North American Industry Classification System’s businesses in the services (or non-manufacturing) sector.


NFCI

Federal Reserve Bank of Chicago National Financial Conditions Index (NFCI)

The National Financial Conditions Index (NFCI) is a weekly report that measures U.S. financial health across money markets, debt and equity markets, and traditional or shadow banking systems. Created by the Federal Reserve Bank of Chicago, it combines 105 different market indicators into a single score.


MOVE Index

Merrill Lynch Option Volatility Estimate Index

The MOVE Index measures expected volatility in the U.S. Treasury market. Higher readings indicate greater uncertainty about the future path of interest rates, inflation, and Federal Reserve policy; lower readings indicate a more stable bond market.


VIX

CBOE Volatility Index

A measure of expected volatility in the S&P 500 over the next 30 days, often referred to as the stock market's "fear gauge." Higher readings indicate greater investor uncertainty and expected market volatility.


QUESTIONS?

Our Wealth Management team is ready to answer your questions and help you prepare for your future with a suite of planning solutions focused on you.


View as Webpage


LinkedIn

6135 Memorial Drive Suite 103, Dublin, OH 43017 | 614.380.3800