|
|
Follow FREE Research at MATASII.com
|
|
Gordon T Long Research exclusively located at MATASII.com
|
|
THE "RULE OF 20"
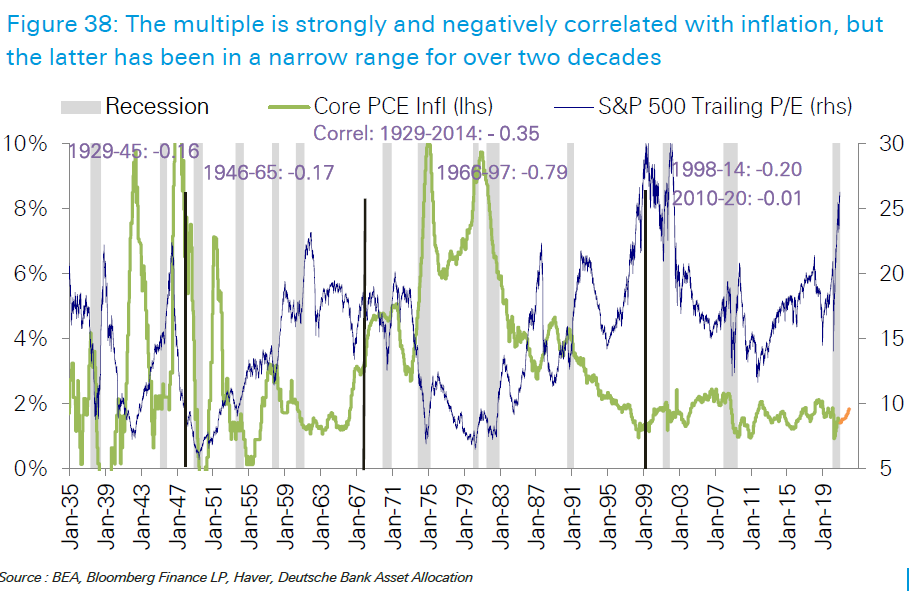
In the 1970's the “Rule of 20” was a well practiced tenet of investing. This was during a period when inflation and stagflation were the market's nemesis. The "Rule of 20" involves subtracting the current rate of inflation from 20 giving us the multiple we should be paying for stocks. No one pays much attention to this rule now because it is perceived that we have neither inflation nor stagflation and future growth levels merit high multiples be paid for stocks.
We would all do well to remember that major market corrections often occur when well established beliefs are found wanting or debunked as false myths.
|
|
Also remember that high PE multiples means you are paying up now for future growth. You are effectively discounting the profits forward. This means that the future gains are being made now. Therefore future market gains may be tepid, with falling PE ratios being paid, even when profits are strong and rising.
Couple these facts with rising inflation / stagflation and you have a recipe for a serious market problem!
- When Inflation Breakevens Rise, PE Multiples Contract,
- When Multiples Contract, Stocks Prices Fall,
- When Inflation Break Evens Rise, Gold Rises.
- Therefore expect Gold To Rise as Stocks Fall in 2021.
|
|
There are good reasons for an inverse relationship between inflation and earnings multiples. The link is clear as this chart from Deutsche’s Bankim Chadha shows (to the right):
INFLATION BREAKEVENS ARE RISING!
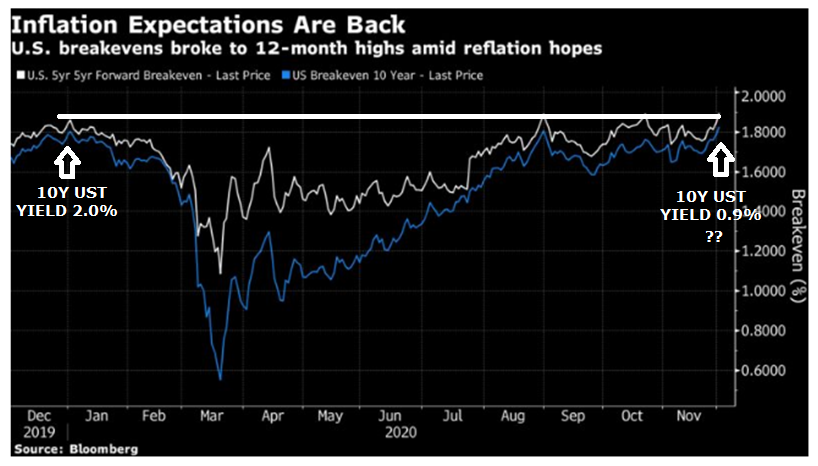
As we spell out in this month's LONGWave video, the 5 & 10Y Breakevens have been steadily rising since earlier in 2020. There is little doubt that this is a reflection of the dramatic increase in global liquidity and overall money supply.
We didn't see this occur after the 2008 crisis, but the liquidity injections and increases in money supply this time are orders of magnitude larger!
Inflation Breakevens are rising for additional reasons (see also Appendix 2):
- Real Rates have dipped which may be attributed to continued outsized buying in TIPS, perhaps by the Fed itself.
- Global Food shortages are pressuring food prices higher,
- Approximately 60-65% of the US CPI is Service based and Service costs are rising to absorb fixed costs occurred due to the Pandemic Lockdowns,
- Futures are up since earlier in the year in Zinc, Aluminum, Nickel, Copper and Iron Ore. As major material components of consumer products, we can likely soon expect further CPI increases,
-
Housing prices are higher as are rents. US home prices which have been rising steadily since the bottom of the last recession have been steepening this year and are now higher than they were during the previous decade’s housing bubble. If actual house prices were used in place of rents, core CPI would have registered a 3% gain in the past year, nearly twice the reported gain of 1.6%.
- The US dollar whose rate of decline is the official definition of inflation has begun to fall versus not just real things but even against other fiat currencies,
- Optimism is rising that Congress will pass some fiscal stimulus deal, even if it is a small one, ahead of a much bigger deal in 2021,
- With $600 billion in excess bond supply in 2021, yields are forecast by leading analysts to jump by at least 20bps to spark the needed demand for US paper.
|
|
CONCLUSION
With yields rising amid renewed reflation prospects, the question is when does it become too much?
Bloomberg writes that:
"Renewed optimism about U.S. stimulus talks pushed the benchmark 10-year yield to a high of 0.94%, a move which if continued could spark a domino effect across risk assets trading at all-time highs thanks to low interest rates. ...... at issue is whether the jump in yields is accompanied by an economic recovery and moderate levels of inflation that would allow the Federal Reserve to keep rates low."
We highlight in this month's LONGWave video the impact on and our expected yields for the 10Y UST.
It appears investors are positioning for improving global economic growth in the near term, with the Treasury curve steepening and U.S. stocks rallying to a fresh record. Meanwhile, 10Y Breakevens have risen to their highest level since May 2019 with what appears to be a distorted value for the 10Y UST Yield (See chart above). Something is soon going to give and the question is whether it will be the Market, Fed or both?
|
|
"Should 10yr yields break above 1.02%, CTAs would be pushed "en masse" into loss-cutting mode, and the resulting systematic sell-off would put additional upward pressure on yields. Based on past correlations the 10yr UST yield could jump up to around 1.20% if CTAs were to sell their way down to a flat position."
|
|
-
TNX - 10Y UST Yield >>> SUBSCRIBER LINK
-
XAU - Daily - Cup & Handle Potential Pattern >>> SUBSCRIBER LINK
DECEMBER - LONGWave Video
-
VIDEO: 16 Minutes with 43 supporting slides >>>> Gold Will Test Your Courage! (Pay-Per-View Link)
|
|
ADDENDUM TO THE DECEMBER LONGWave VIDEO |
|
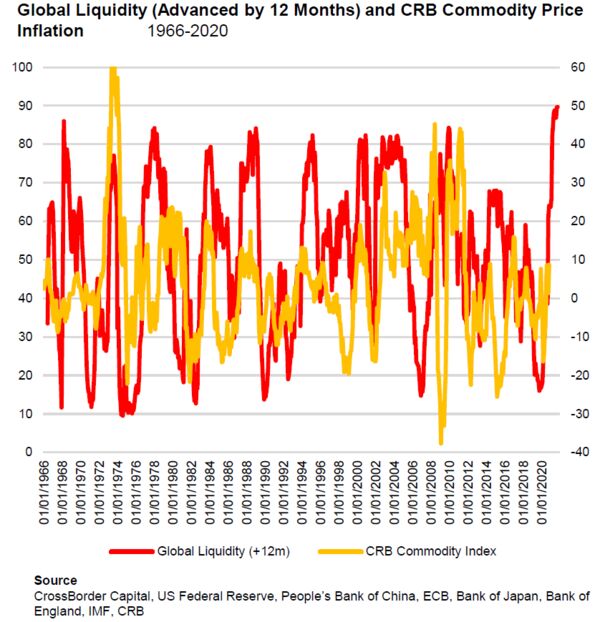
1- GLOBAL LIQUIDITY HISTORICALLY TRACKS TO COMMODITY PRICE INFLATION |
|
ANOTHER IMPORTANT CORRELATION
In this month's LONGWave video we show the importance of the China Credit Impulse leading the US 10T UST Real Yield by 12 months. What is also important to realize is that the CRB Commodity Price Inflation Index does also.
|
|
As we laid out in October LONGWave entitled "Will 2021 Be The Year of Hard Assets?" we have yet another confirming analytic of our conclusions.
|
|
2 - BREAKEVEN INFLATION IS BREAKING OUT - HIT 18 MONTH HIGH |
|
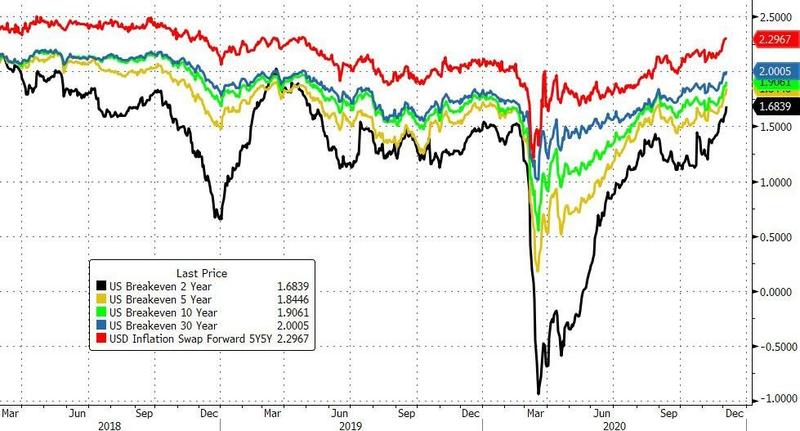
Inflation expectations as priced by the Treasury market are hitting 18 month highs just now. As the reader can see, inflation expectations across all treasury maturities are at cycle highs.
|
|
This is happening coincident with growing expectations for the $908bn bipartisan stimulus deal and widespread expectations that the Fed will ease in some additional way at their next meeting 12 days from now.
That these two events are anticipated by the market does pose some near-term downside risk for inflation expectations, since there is now room for disappointment. Even still, keeping the long game in mind is useful.
Indeed, there exist multiple structural catalysts for inflationary pressure that haven’t existed in quite some time:
- De-globalization,
- USD which may be under continued pressure from massive twin current account and budget deficits
- The possibility that US oil production has peaked, or at least will not grow as it did last cycle
- Raw material (especially base metal) inflation from the acceleration of green transport and power generation trends
- Demand-pull inflation from fiscal stimulus
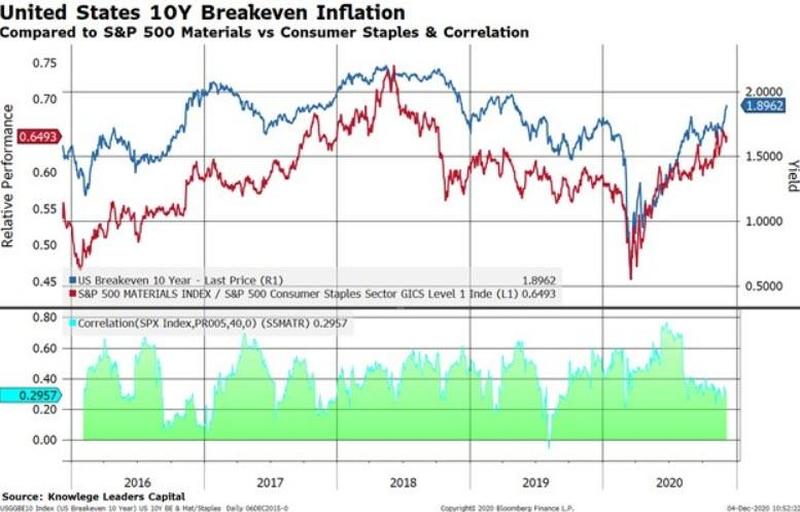
Within the equity market, there are clear implications to a structural change in inflation expectations. The clearest one may be the outperformance of cyclical vs defensive stocks. In the next chart below I compare the materials sector vs the consumer staples sector (red line) and overlay 10Y inflation expectations (blue line). The bottom panel displays the correlation between the two series in green. If Breakevens continue to march higher, it’s clear one wants a more cyclical tilt towards their portfolio.
|
|
On the other hand, cyclicality does not equal value. This is apparent in the chart below in which I plot the relative performance of Pure Value vs Pure Growth stocks overlaid on inflation expectations. |
|
The correlation here is much, much less than the preceding chart. As I have argued multiple times in this blog, value as a style is highly dependent on the yield curve steepening. Because the Fed has telegraphed an inclination to push against back against higher long rates (yield curve control, forward guidance, etc.), a material and sustained steepening of the yield curve (i.e. one that lasts through the first half of 2021) doesn’t seem like a particularly high probability bet.
At least, the bet on cyclical vs defensive is a higher probability and one that will grow if the inflationary catalysts above play out.
|
|
MATASII'S STRATEGIC INVESTMENT INSIGHTS |
|
10Y UST "NOMINAL" YIELDS ARE RISING WITH RISING INFLATION BREAKEVENS |
|
We have been showing this chart for sometime as a warning of 10Y UST nominal yields potentially rising to 1.4%. Anything over a 1.02% 10Y UST Yield will be difficult for the equity markets to digest! |
|
Your LIVE DESK TOP / TABLET / PHONE
MACRO ANALYTIC Video Chart Link: SUBSCRIBER LINK
NOTE: Any Problems with this Chart: E-Mail lcmgroupe2@comcast.net
|
|
CUP & HANDLE "FRACTAL" EMERGING |
|
The Cup & Handle pattern formation appears to be playing out as we forecast in previous videos and newsletters. |
|
Your LIVE DESK TOP / TABLET / PHONE
MACRO ANALYTIC Video Chart Link: SUBSCRIBER LINK
NOTE: Any Problems with this Chart: E-Mail lcmgroupe2@comcast.net
|
|
LONGWave Video - DECEMBER 2020 |
|
IMMEDIATELY AVAILABLE TO NON-SUBSCRIBERS ON A PAY-PER-VIEW BASIS
CLICK RIGHT FOR PREVIEW
|
|
|
VIDEO LINK: SUBSCRIBERS LINK
|
|
The Most Insightful Macro Analytics On The Web |
|
PO Box 1224,
Norton, MA 02766
(508) 285 2213
|
|
|
|
|
|
|
|