|
Greetings!
The Fed Held, the Data Was Strong, and AI Spending Broke the Tape Anyway
By Eli Gal Levy, Senior Analyst
Is the risk worth the reward at this point? Part 10
The question I keep getting is not about a level. It's about whether to be in this market at all. Stay invested while indexes print records, or take a guaranteed yield in short-term paper and sit this out until it works itself out. It sounds like the conservative choice, and it is — but conservative is not the same as costless. Every decision in this tape charges you something, including the decision to do nothing.
The Fed Held, the Data Was Strong, and AI Spending Broke the Tape Anyway
Week of October 26–30, 2026 · Cannon Intelligence Desk
Four sessions of grinding gains, then Friday took it all back. The S&P 500 finished the week at 7,580.07, down 0.57%, after falling 1.82% on Friday alone. The Nasdaq Composite lost 2.00% on the week to 25,436.99 and the Dow 0.85% to 51,770.31. The Russell 2000 was the exception again, up 1.29% to 2,811.84.
The technical damage is now on the board. The S&P is below its 7,626 support, the Nasdaq Composite is through intermediate support at 26,000, the semiconductor index is back under its 200-day average, and the Russell — which showed real relative strength midweek — slipped back to close around the 200-day on Friday. The VIX spiked toward 22 intraday before closing at 19.42, essentially unchanged on the week.
Underneath, money went where it goes when the index leaders break: staples added about 1.75%, with health care and utilities each up roughly 1%.
The week in sequence
Monday and Tuesday were a clean bounce. The S&P rose 0.70% to 7,676.77, then 0.60% to 7,722.60, with the Nasdaq up 1.18% and the Russell 1.16% on Tuesday. The dealer map closed the gap fast: the flip fell from 7,870.94 Friday to 7,724.16 Tuesday while the put wall rose from 7,500 to 7,700, turning a 247-point chasm into a 1.56-point gap by Wednesday’s open.
Wednesday the Fed held at 3.75%–4.00% on a 10–2 vote, with Lisa Cook and Beth Hammack dissenting in favor of a quarter-point hike. The statement called activity strong and inflation elevated. The index added 0.28% to 7,743.98 — and the curve steepened the wrong way: the ten-year rose six basis points to 5.05% while the two-year fell to 4.67%. A hold that lifts the long end is a market saying the pause is not the end of tightening.
Thursday the data came in strong and the megacaps split. Third-quarter GDP grew 3.4% against a 3.2% consensus, September PCE prices rose 3.6% year over year against 3.7% expected, and claims were 194,000. Alphabet fell about 10% after its results and ServiceNow about 19%, while Microsoft rose. The S&P slipped 0.30%, the Nasdaq 1.38% — and the Russell 2000 rose 1.01%. The cap-weighted S&P fund fell 0.38% while the equal-weight fund rose 1.20% and the Magnificent Seven fund lost 2.19%. New highs beat new lows 31 to 2 and 63.4% of members sat above their 200-day. The closing TRIN of 2.25 said the selling was concentrated and heavy in a few names.
Friday the bill arrived. Amazon grew sales 12% to $201.9 billion with AWS up 39% to $46.0 billion — then guided to roughly $220 billion of cash capital spending for 2026 against trailing free cash flow of negative $42.4 billion. Intel fell about 26% in premarket after its report, AMD 8.5%, and the semiconductor ETF closed at 526.71, down 6.2% on the day. Up volume was 34% of the total, S&P advancers trailed decliners by 46, and the Russell’s by 827 — the broadest selling of the week.
What the rest of the market said
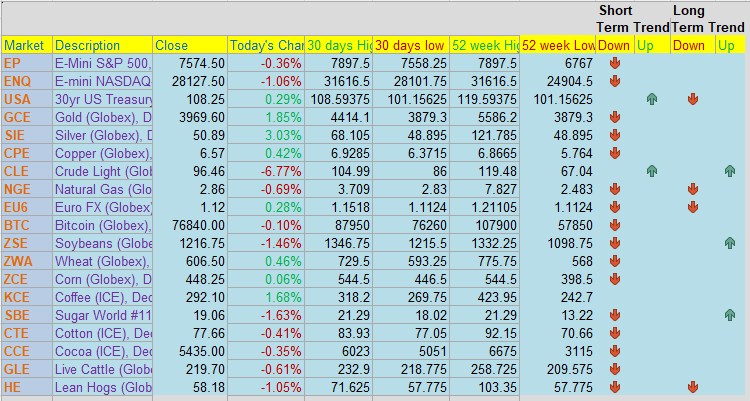
The bond market did not confirm the panic. The ten-year ended the week at 4.94%, down six basis points, the two-year at 4.56%, down thirteen, and the thirty-year at 5.31%. Credit went the other way from equities entirely: the high-yield spread tightened to 3.26%, about 14 basis points inside the prior week. Gold broke down to about $3,885, with crude holding near $103 and Brent above $112.
The one gauge that confirmed the stress was liquidity. Net liquidity fell to $5.73 trillion, down about $78 billion on the week, as the Treasury’s cash balance rebuilt after the tax date. And the concentration measure kept unwinding: the cap-weight-to-equal-weight ratio fell from 3.510 to 3.462, while the share of S&P members above their 200-day actually rose from 56.1% to 58.8%. The index is breaking; the median stock is not.
Who moved
Jeffrey Gundlach (DoubleLine) says the Fed should be raising rates and is behind the curve, pointing at the two-year and the curve that steepened during the press conference. His model mix is the cleanest expression of the week’s worry: 30% equities deliberately away from the AI concentration in the cap-weighted index, 30% bonds as a barbell of safe domestic investment grade and local-currency emerging-market debt, 20% commodities tilting toward gold as it falls, and 20% dry powder in short-duration paper rather than cash.
Tom Lee (Fundstrat) read Chair Warsh’s press conference as dovish, argues the committee is walking back its September hawkishness, and told followers to look through the noise.
Ed Yardeni describes air coming out of the AI bubble without a burst, with a “toxic trifecta” behind the jitters: elevated borrowing costs, uncertain returns on the investment and the financing that funds it. His line after Thursday’s data: the economy continues to roar while the Fed waits.
Michael Hartnett (BofA) stayed bearish, risk-off until mid-November. Mike Wilson (Morgan Stanley) holds that the correction that began in June is in its final stages, with AI funding, the midterms and liquidity as the three clearing events.
David Keller (Sierra Alpha) made 7,600 his line in the sand with 7,300 below it — Friday’s close went through it — and now frames the tape as separating AI winners from losers.
Mark Newton (Fundstrat) turned cautious on Amazon’s break to multi-month lows on above-average volume, which he calls the real technical warning rather than the after-hours gap.
Jeff deGraaf (Renaissance Macro) sees two markets: an overbought equal-weight S&P against a middling cap-weighted index, with hardware and semis oversold enough for a month-end bounce, and defensives taking a bigger share of returns over time. He flagged that 50% of the index hit 20-day highs on the day technology fell hardest — a reading last seen coming out of the May 2025 tariff tantrum.
Warren Pies (3Fourteen) still sees a path to 8,000 by December 31 with a choppy two weeks first. Jeremy Siegel notes the value indexes are at all-time highs and calls the ten-year joined at the hip with AI sentiment. Andy Sieg (Citi) flagged cracks forming in private credit.
Into next week
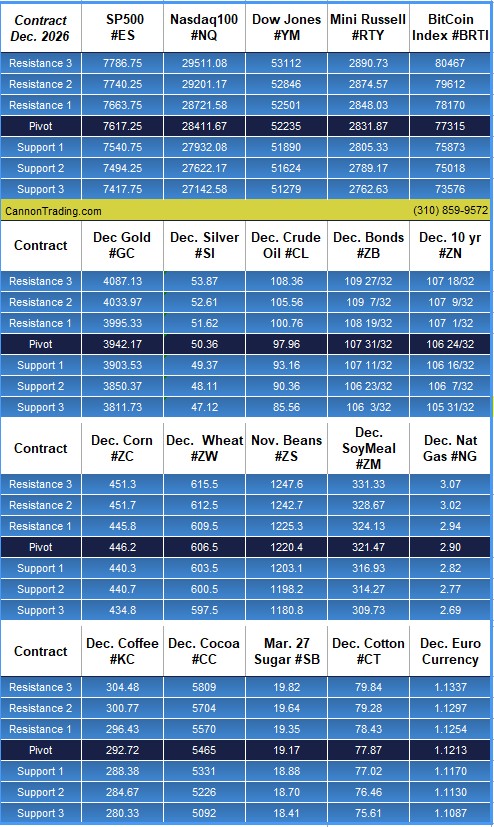
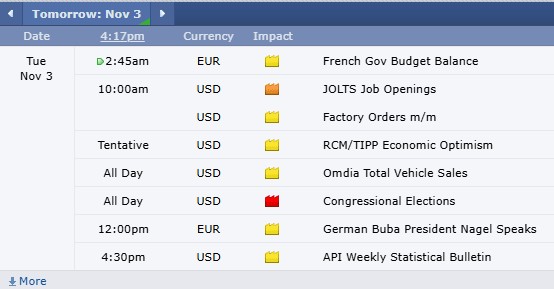
Month-end is behind us and the midterms are Tuesday — the date nearly every cautious voice named as the clearing event. With the index under its flip, the November chain’s heaviest put interest at 7,500 and the call wall down at 7,800, the dealer corridor is narrow and the market sits at the bottom of it.
View Charts and Analysis for SP, Nasdaq, Dow, Gold, Crude Oil, Dollar Index, VIX, Bonds, BTC and More!!
Need help looking at different markets? get some insight from an experienced series 3 broker?
The call is free and we are here to assist - try us!
+310 859 9572
|