A Market of Two Minds

Market Commentary | October 2026 | Crescent Wealth Management

The short version

• The S&P 500 sits near a record high while the typical stock has been in a meaningful drawdown. It's

one of the most lopsided markets in years.

• Most of the big Wall Street firms see this as a setup for the rest of the market to catch up, not as a

warning sign. (Consensus is a starting point, not a guarantee!)

• History suggests tech weakness, not narrow tech leadership, is the real risk to watch.

• The good news: breadth is improving. The average stock is outpacing the index so far this month.

• Mike Gibbs of Raymond James, whom many of you have met, remains constructive on stocks

heading into the seasonally strong year-end stretch.


Dear Friends,


Fall has arrived here in the Upstate, and with it comes more time outside with family and friends,

travel, and the holiday celebrations and gatherings just around the corner. The market, as it often

does this time of year, is giving us plenty to talk about. As many of you know, when the market

starts sending mixed signals, our communications to you pick up. This one runs a bit longer than

usual, but I think it's worth your time. We write these pieces with you in mind, and I hope you find

this one helpful and of value.


If you've been following the headlines lately, you've seen plenty of "record highs." What the

headlines don't tell you is that the S&P 500 has been carried by a relatively small group of very

large companies, while the typical stock has struggled. On Wall Street this is called a lack of

"breadth" (how many stocks are actually participating in a rally), and it has been the talk of the

town.


We're always looking for divergences between what people are thinking and what the market is

actually doing, and right now there's a big one. Mike Santoli, CNBC's Senior Markets

Commentator, wrote an excellent piece on this in his Market Memo, and I'm going to lean on it

heavily below. He summed it up in one line:


“This is a deeply divergent stock market that almost no one saw coming and few

are enjoying, but most everyone seems to think is about to resolve in their

favor.”


I love that line. Plenty of discomfort and plenty of confidence, all at the same time!


A tale of two markets

Here's the split. The S&P 500 sits just 2% below its all-time high. Meanwhile, as Santoli points out, the

median stock in that same index (the one right in the middle of the pack) is down roughly 16%

from its high. Semiconductors are about 20% off their peak and the big banks about 15%.


Why those two groups? For the semis, I'll go back to a metaphor I've shared before: AI isn't a

bubble, it's a balloon, where air can be let in or out from time to time. After an incredible run,

expectations ran high, a lot of investors crowded into the same trade, and some air has come out.

That doesn't change my conviction that AI is the defining technological breakout of our time, much

like the internet was in the '90s.


The banks are dealing with two pressures. The first is uncertainty around the Fed under its new

Chair, Kevin Warsh, who has been pegged as more hawk than dove and who has moved away from

the forward guidance markets had grown used to. Less clarity on the path of interest rates makes it

harder to handicap lending, credit quality and the value of the bonds sitting on bank balance sheets.

The second is AI itself. A new wave of AI-powered personal finance apps, such as Meta's new

Muse application, is sending ripples through traditional banks, with investors asking how much of

everyday consumer banking could shift to these platforms. That pressure falls less on the large

investment banks and M&A-heavy firms, whose businesses depend more on relationships and deal

flow than on checking accounts and consumer loans.


In years past, weakness like that in key sectors would have been a real warning sign for a bull

market that just turned four. This time, a handful of the largest companies have been strong enough

to hold up the entire index.


What the big firms are saying

Santoli surveyed several of the major Wall Street firms, and they're notably calm about all of this:


• Goldman Sachs says that by its preferred measure, market breadth is the weakest since the

dot-com era. Even so, it doesn't see the narrowness as a warning sign and still expects the S&P

500 to move higher over the next one to three months.


• Morgan Stanley's Mike Wilson notes that rising Treasury yields have hit the average stock

hardest. But the prices of those stocks have already fallen further than their earnings have, so if

yields stabilize there's room for them to catch up.


• Deutsche Bank downgraded the technology sector, citing crowded positioning (too many

investors in the same trade) and a high bar for earnings. It also argues that a cooling in tech

could let the rest of the market rotate higher.


Now, let's be honest. Remember the forecasters who flipped their Fed calls a full 180° earlier this

year? Just because a strategist says something doesn't make it true. A consensus is a starting point,

not a guarantee. Still, it's worth knowing where the big money's thinking sits.


Why the pros are rooting for a broader market

Santoli cites research from Trivariate showing that only about 34% of large-cap stocks have beaten

the S&P 500 over the past year, near the low end of the historical range. In plain English, only

about one in three large companies has kept up with the index. No wonder so many professional

investors are hoping for leadership to broaden out. But he adds a useful caution: historically, the

periods when beating the index was easier tended to be periods when the overall market was under

pressure.


He also points to a quiet stabilizer. When some heavyweights fall, others have tended to rise and

offset them almost exactly. On one recent day, declines in Nvidia and Micron were cancelled out

almost to the penny by gains in Apple and Meta, leaving the index nearly flat. This kind of rotation

has kept the index's overall volatility low even as individual stocks moved sharply.


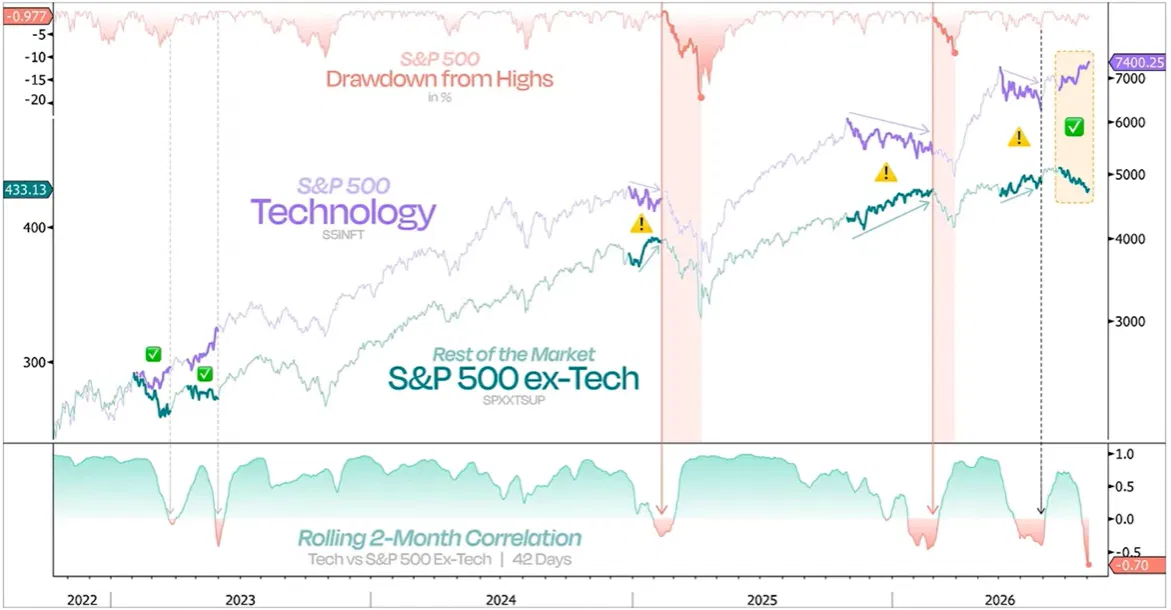
S&P 500 Technology vs. S&P 500 ex-Technology since 2022, with rolling two-month correlation. Green checks mark tech

leading while the rest of the market lagged; yellow warnings mark tech weakening while the rest of the market rallied;

shaded areas show S&P 500 drawdowns. Source: Duality Research.


This chart from Duality Research offers a useful reframe on all of that hand-wringing. It compares

the technology sector with the rest of the S&P 500 since 2022 and tracks how closely the two move

together. Over the past four years, the pattern has been remarkably consistent.


When tech has broken down, the rest of the market has tended to fall with it. In other words,

narrow leadership from tech hasn't been the problem; tech weakness has. And when tech has led

while the rest of the market lagged, that gap has historically closed with the rest of the market

catching up, not with the index rolling over.


Right now, the correlation between the two (a measure of how closely they move together, where

-1.0 means exactly opposite directions) has dropped to about -0.70, one of the most extreme

readings in the series. Meanwhile, the equal-weighted S&P 500 just had its best day relative to the

standard index since July. If interest rates ease and energy prices cool, the "happy ending" version

of this setup is the rest of the market catching up while tech holds its ground. That could set the

stage for a strong finish to the year. The scenario to watch for is the reverse: tech breaking down.

As the chart's warning signs show, that has been the pattern that preceded the market's real

pullbacks.


Narrow isn't necessarily bad

I'm with Santoli on this one. As he writes, “there's nothing wrong with a narrowly led advance.”

Bull markets usually have a dominant theme, and I'd argue this one's theme is clearly AI. His

conditions are that most stocks shouldn't be outright falling, and the divergence shouldn't come

with signs of real economic stress or tightening financial conditions.


He suggests we may be nearing a critical point on that front, and flags several things to watch:


• Credit spreads (the extra yield investors demand to lend to companies rather than the

government) have widened, though not to a critical level.


• The equal-weighted S&P 500, where every company counts the same regardless of size, has

barely bounced from a new low relative to the standard index. That said, the equal-weight S&P

500 ETF (RSP) has climbed more than 2% over the last two weeks, a welcome start.


• The Russell 2000 small-cap index is sitting right at its 200-day moving average, a widely

watched measure of a market's longer-term trend.


• An index of the 493 S&P stocks outside the Magnificent 7 is only a few percent from a

potential technical breakdown. Can the rest of the market break out, or will it break down? (As

a reminder, the Mag 7 are Apple, Amazon, Alphabet/Google, Meta/Facebook, Microsoft,

Nvidia and Tesla.)


Earnings season is the next big test. Santoli cites John Kolovos of Macro Risk Advisors, who says,

“Earnings season couldn't come at a more important time to repair the damage beneath the

surface.” Kolovos warns that if the index keeps rising for several more weeks without broader

participation, history suggests the path gets harder, and that could eventually weigh on the whole

market, tech included.

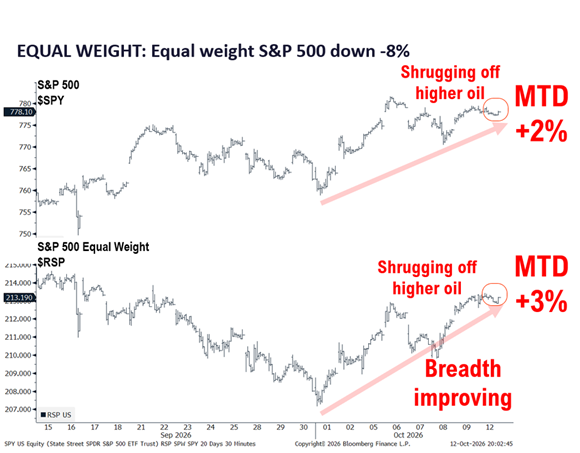
S&P 500 (SPY) vs. S&P 500 Equal Weight (RSP), September 15 – October 12, 2026. Source: Fundstrat, using

Bloomberg Finance L.P. data.


Breadth isn't required for a healthy, upward-sloping market, but it is improving right now. As this

chart from Fundstrat shows, the equal-weighted S&P 500 is up about 2.5% month to date, slightly

ahead of the standard index at about 1.5%. Since bottoming at the end of September, the average

stock has been climbing steadily. Both have also shrugged off higher oil prices, which in the past

might have pressured stocks.


There is still ground to make up. At its late-September low, the equal-weighted index had fallen

roughly 8–9% from its high this summer (the figure in the chart's title). It has since climbed back to

within about 5% of that high. That's exactly the kind of improvement beneath the surface that

Kolovos and others hoped to see heading into earnings season.


The bottom line: tech going up is good for the market, even when breadth is weak for a stretch. As

I've said before, over the long-term, price follows earnings. And remember, bull markets die in

excess, not in doubt. Right now, this market is surrounded by hand-wringing, not euphoria. Today's

divergence looks more like a coiled spring than a crack. Of course, past patterns are no guarantee,

and we'll be watching earnings season closely for confirmation.


A view from a familiar face

Many of you have met Mike Gibbs of Raymond James in person at the small client events we've

hosted over the years. Mike recently shared his latest "Thoughts on the Market," and it lines up

remarkably well with everything above. His bottom line:


“While narrowing breadth, higher rates, and geopolitical uncertainty warrant

monitoring, a strengthening economic backdrop, resilient earnings outlook, and

favorable seasonality support maintaining a constructive view on equities.”


That's a view we share.


A little perspective, and a word on bonds

Santoli noted that this bull market just turned four. It's worth remembering where it started. 2022

was a rare year when stocks and bonds fell sharply together, and the traditional safe harbor didn't

provide much safety. That's a big reason we lean on cash and liquidity for flexibility rather than

relying on a large traditional bond allocation alone. It's also a reminder that the market climbed out

of that hole. Investors who stayed disciplined through 2022 have been rewarded over the four years

since.


Since a few of you have asked about bonds: with interest rates rising sharply recently, bond prices

have fallen, and you may be seeing unrealized losses on the bond positions in your statements.

Admittedly, our bonds have been a laggard this year. But we handpick these bonds with the

intention of holding them to maturity. Barring a default, a bond held to maturity pays back its full

face value, and it pays its interest along the way. The price swings in between are noise, not losses

we expect to realize. And with higher rates on Mike Gibbs's watch list, as the bonds in our ladders

mature, we can reinvest that money at today's higher yields. It's a good example of something I've

mentioned before: often an investor's emotional risk tolerance is less than that of their portfolio.


What this means for you

So what do we do with all of this? Our approach hasn't changed, and it's intentionally simple.

Equities drive growth, fixed income provides stability, and liquidity gives us flexibility when

opportunities present themselves.


In a market led by a handful of very large companies, we've chosen to own many of those leaders

directly, but with guardrails. Nothing here is "set it and forget it." Every position is managed with

the market environment, the company's fundamentals and the technical picture in mind, along with

the specific needs, goals and risk tolerances of each client, and of each individual account within

their portfolio. A trust, an IRA and a taxable account for the same family can, and often should,

look different. Owning individual stocks directly also lets us decide when gains are realized,

choosing specific tax lots when we trim and harvesting losses along the way.


Alongside stocks, we're holding meaningful cash, earning close to 4% in money market funds, as

dry powder for when opportunities present themselves. That's one reason a well-built portfolio isn't

supposed to track the S&P 500 point for point. Many of our clients take regular distributions and

build cash through dividends and interest, so a balanced benchmark, or the S&P 500 without

reinvested dividends, is a fairer yardstick than the headline index. By those measures, we're

pleased with where portfolios stand.


We're in your accounts on a daily basis, looking for growth opportunities as well as ways to

mitigate unnecessary risks. We want to be sure of what you own, why you own it, and how

attractive those companies are, not just for the next few weeks but for the years to come.


We want to make something perfectly clear: we aren't making dramatic moves based on any single

signal. Historically, October kicks off the market's seasonally strong year-end stretch, but just as

we don't blindly sell in a seasonally weak period, we don't blindly buy in a strong one. Seasonality,

like any chart or forecast, is one arrow in our quiver, not the whole quiver. Earnings season will tell

us a lot over the next few weeks. We don't know exactly how it will play out, and I expect some

volatility along the way. I encourage you to stay steady and keep your long-term goals in view.


And for friends of the firm reading this: if it would be helpful to get a second perspective on how

your portfolio is positioned in this environment, I'd be glad to talk. The same goes for anyone in

your life who could use a second opinion. We always welcome the introduction.


If you'd like to share this commentary or read previous market emails, newsletters, or our M&A

industry pieces, you can find them at crescentwm.com/resources. And as always, if there are topics

you'd like us to explore, please pass them along.


We look forward to hearing from you, so please reply with any thoughts or questions you may

have. We can do our best work together when we hear from you. No matter which way the market

moves, we're here for you.


Enjoy the cooler weather, safe travels, and the time with family and friends as the holiday season

approaches!


Sincerely,

Emory

Emory G. Hendrix, Jr., AAMS®, CEPA® 

Managing Director / Crescent Wealth Management

A: 124 Verdae Blvd., Ste. 105, Greenville, SC 29607

D: 864.729.4288 O: 864.464.9626   

E: emory@crescentwm.com   W: www.crescentwm.com

Advisory services offered through NewEdge Advisors, LLC, a registered investment adviser. Securities offered through NewEdge Securities, LLC. Member FINRA/SIPC. NewEdge Advisors, LLC and NewEdge Securities, LLC are wholly owned subsidiaries of NewEdge Capital Group, LLC. 


NOTICE: This email communication including all attachments transmitted with it may contain confidential information intended solely for the use of the addressee. If the reader or recipient of this communication is not the intended recipient, or you believe that you have received this communication in error, please notify the sender immediately by return email and PROMPTLY delete this email including all attachments without reading them or saving them in any manner. The unauthorized use, dissemination, distribution, or reproduction of this email, including attachments is strictly prohibited and may be unlawful.