|
East Tennessee February real estate sales showed the most robust consumer interest since 2022, with double-digit growth over last year. Consumers responded favorably to interest rates, warmer weather and improved affordability.
Buyers' reactions are slightly delayed from real-time market movement: When mortgage rate drops and media headlines celebrate good news, buyers follow within a few weeks and sustain that optimism.
The same can apply for negative impacts to the market, and we are only just seeing the mortgage rate waver based on the temporary effect of rising energy prices.
ETNR members are hopeful for a productive spring. We're watching to see whether inflationary price shocks and foreign policy will have an effect on rates, and if so how a prolonged impact might change the outlook for the year.
| | |
Home Sales Report
FEBRUARY 2026
-
East Tennessee home sales rose 16.3% from February 2025.
-
The median sale price was $370,000 — up 2.7% from the previous year.
-
Total housing inventory has increased 10% from the previous year.
-
Half of the homes sold were under contract in 51 days or less, up from 42 days a year ago.
-
42.15% of homes sold for the asking price or above, with 16.9% selling for more than the asking price. 6.5% sold for at least $10,000 over asking and 2.5% sold for at least $25,000 over asking price.
-
The sale-to-list price ratio held steady at 98.75% – up rom 98.5% a year ago.
-
New construction was 15.9% of total home sales, up from 14.9% in February 2025.
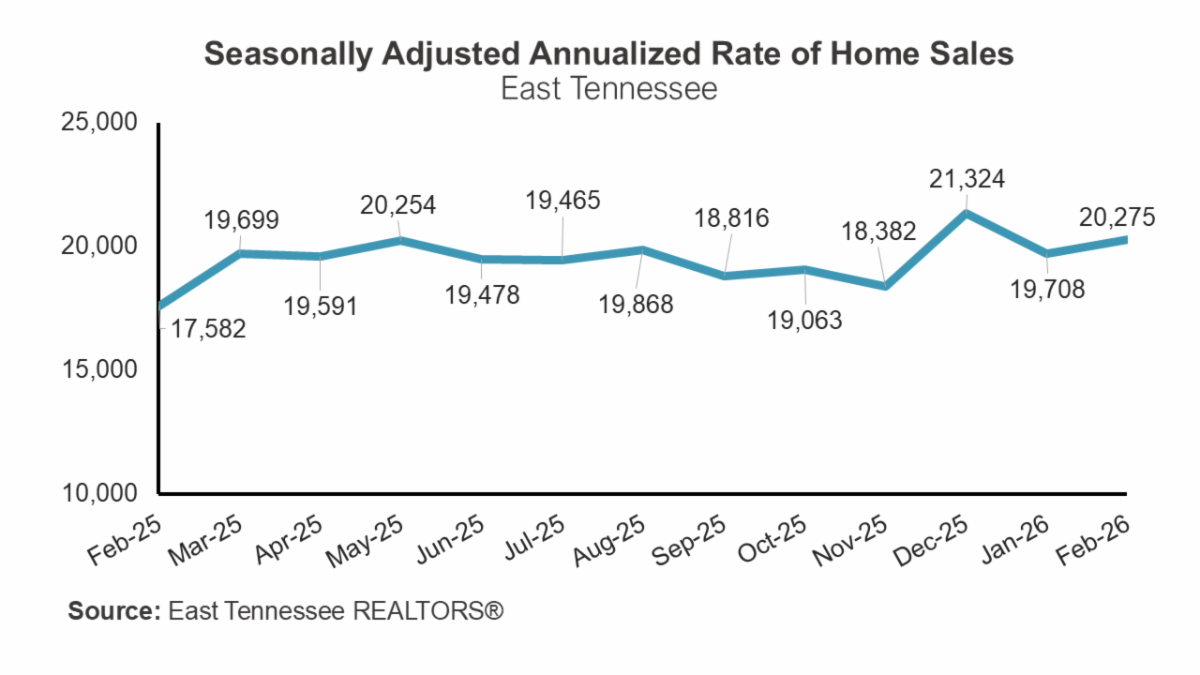
| | East Tennessee REALTORS® reports home sales data using a seasonally adjusted annualized rate (SAAR). This method takes into account seasonal fluctuations in the real estate market, such as increased home sales during the spring and summer, by adjusting the data to provide an annualized rate representing the projected number of homes that would be sold over a year if the current sales pace were to continue. | | |
What's the outlook?
Buyers leaped into the market in February, galvanized by favorable mortgage rates and excitement around affordability. Sales increased 16.3% over last February, and the first two months of this year cumulatively represent a 12% increase over the same period in 2025.
East Tennessee is an anomaly in the flat national home sales market; nationwide existing home sales rose only 1.7% over January, a decline of 0.8% year-over-year.
It's good news for buyers too, even if we're still a "seller's market" for now: The gap between list and sale prices remains narrow, showing that seller expectations are becoming more normalized and aligned with leveling market demand. Homeowners can still rest easy knowing that East Tennessee home assessment values are extremely strong - the list to sale ratio was 98.75% in February.
We continue to urge our members to share their optimism with customers; despite a wide variety of alarming (and sometimes contradictory) national headlines about housing, East Tennessee's market is primed for success and affordability is improving each month.
The booming sales do have one downside for the industry. Three months of enthusiastic sales have stripped bulk from an already lean regional inventory heading into the spring busy season, particularly in the lower price ranges that are the most needed for families who are waiting on mortgage rates. Robust sales could still be on the horizon, but constrained inventory caps possible growth.
| | |
Inventory by county
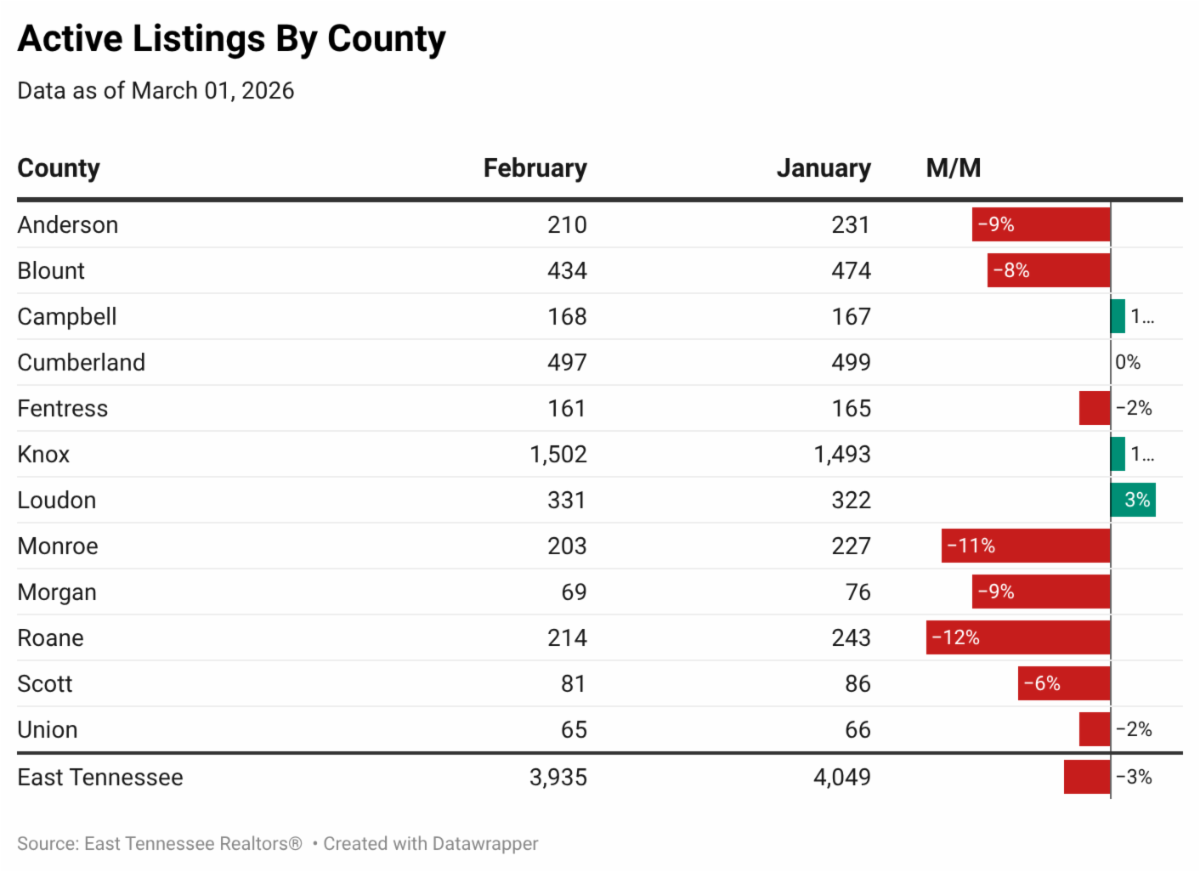
Out of the 12 counties in the East Tennessee REALTORS® footprint, 8 marked measurable decreases in active listings month-over-month. Three months of unseasonably high sales volume have outpaced the region's typical new inventory additions. Overall, regional inventory decreased month-over-month by 3%.
| | |
Knox County releases drafts of Unified Development Ordinance zoning districts and map
As the last step of the multi-year Advance Knox community planning process, Knox County has engaged a consultant to align codes with the future land use plan. The result will be a Unified Development Ordinance (UDO) that combines all zoning, street, subdivision, stormwater and development codes into one comprehensive document. Review the basics here.)
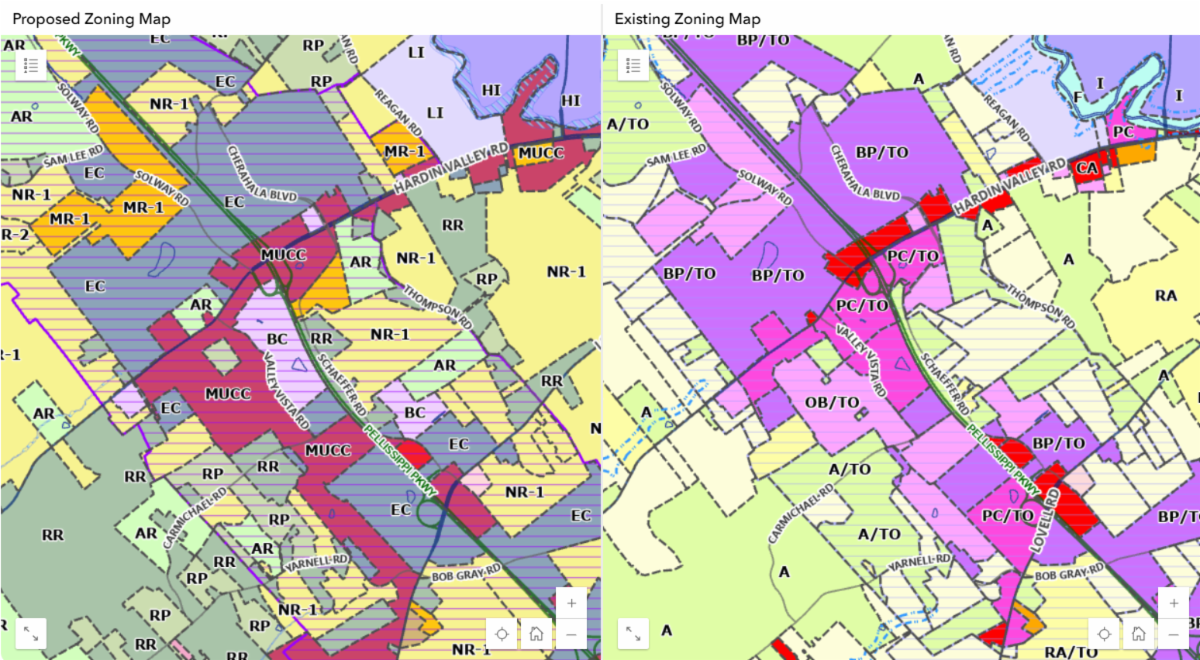
The latest step in the Advance Knox Unified Development Ordinance has been released, including dimensional standards for each new zoning district. The long-awaited Knox County UDO map is available, showing exactly how lots will be zoned under the new districts.
Feedback is crucial at this step, as this is the first time we have seen the UDO applied to real lots.
| | |
Some of the future regulations are yet to be released, namely those that govern cluster development and planned subdivisions - planned to be shared later in April. The simplification of the process will be beneficial for both the development community and surrounding neighbors, making it obvious what type of structures and uses will be allowed.
However, this approach makes it even more important to write the ordinances well now, as much of the project-by-project flexibility previously offered will be replaced by district-specific requirements.
Major changes in the new regulations and map include:
- New lot and structure dimensions for each zoning district
- Changes to the types of structures allowed
- The addition of mixed-use residential and commercial corridor dimensions
- The addition of build-to dimensions for more residential districts
- Requirements to add residential diversity in denser districts
- Removal of the Planned Residential zone in favor of district-specific subdivision dimensions
| | |
We urge our professional community to carefully review the draft and provide feedback or questions to the UDO team before the deadline of April 5.
After that, the next portion of the draft will be released to include cluster development regulations, expanded parking regulations, landscape, stormwater and more.
In particular, the effect of the new districts on housing density and diversity cannot fully be defined until the final batch of articles is released.
| | |
TACIR report confirms serious infrastructure needs in East TN
Infrastructure has become the national buzzword in recent years, as the great post-pandemic migration and federal funding efforts highlighted communities who are thriving, and others who are not.
Infrastructure is often viewed by the public as a sort of off/on switch for development of housing and commercial amenities, as residents equate the day-to-day pain of slow traffic or reduced services with population increase. The public then often turns to the most visible growth - homes! - to place blame for the lack of infrastructure.
The Tennessee Advisory Commission on Intergovernmental Relations (TACIR) report shows that the infrastructure challenge is a result of decades of backlog and a lack of future-oriented planning; much like the housing crisis, it began far before our newest residents arrived. A growing list of projects and lack of local, regional and state funding is then only exacerbated by the influx of population.
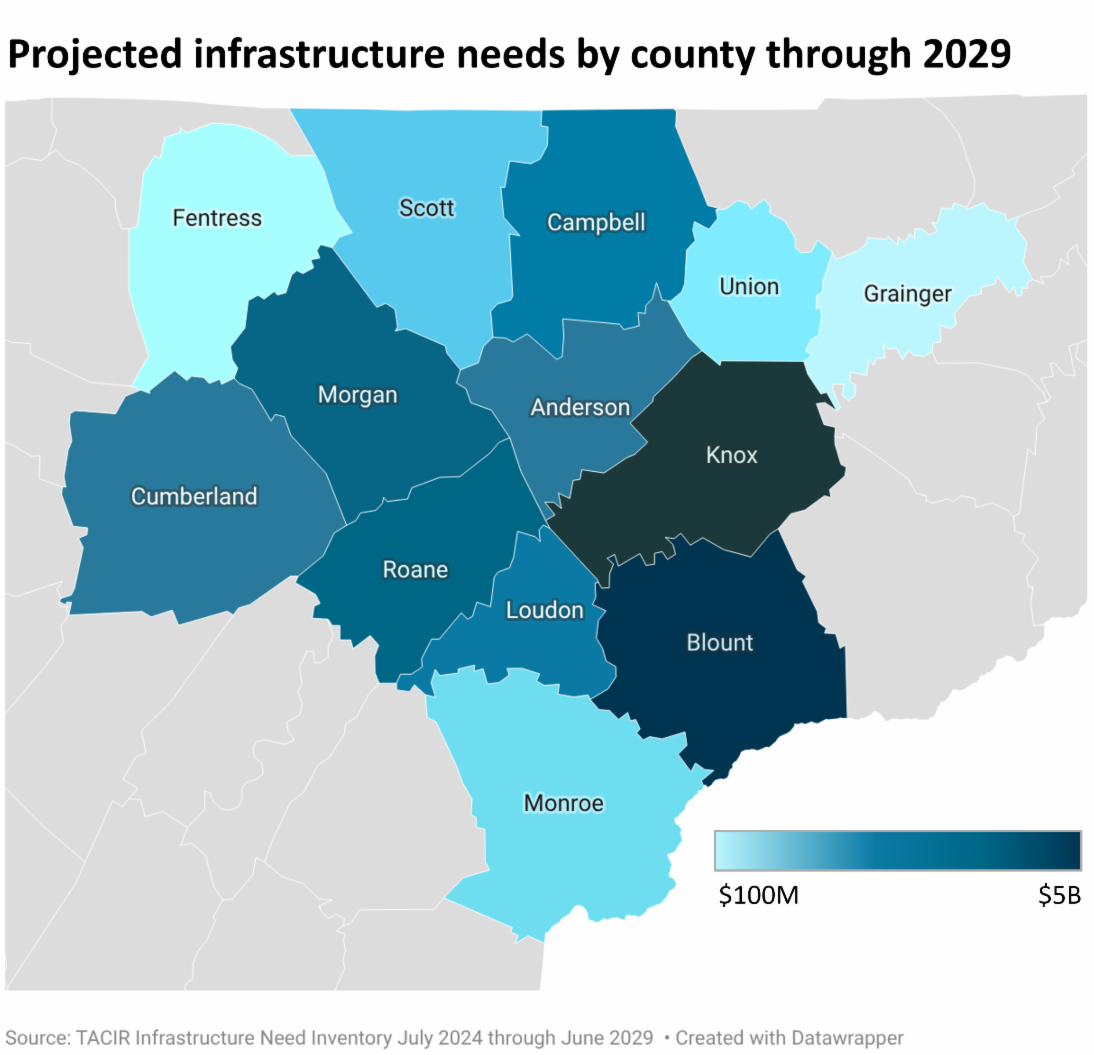
| | The report breaks down specific needs by county, showing that Knox County tops the list in East Tennessee with more than $5 billion in infrastructure needed through June 2029. Roadways are the most urgent need, with more than $2 billion in projects identified for transportation alone. Education and water infrastructure follow. | | |
The report shows the difference between current and projected spend, and estimated needs over the five-year period from 2024-2029.
An overwhelming influx of residents fled urban environments in favor of more pastoral communities, where they hoped for improved quality of life and affordability. Unfortunately, those communities were often limping along on outdated, underinvested systems of public infrastructure and services, with little prospect of increased revenue. Faced with the strain of so many unexpected new residents, that infrastructure is failing across the state and here in East Tennessee.
Shouldn't all those new residents mean new revenue?
Eventually, yes. However, our state is already estimated to be $80 billion behind on real projects and sources most of its roadway revenue from the shrinking gas tax, so an immediate influx of capital would be needed to kick off even the most urgent needs. With no state income tax, we also have limited ability to capture a first-year benefit from new residents' high out-of-state incomes.
We know that we can't pause growth until the infrastructure catches up; regional planning for the future must include broad vision and investments in infrastructure without expecting housing providers and develope to pay for it piecemeal.
| | |
California drops off list of inbound moving renters to East TN
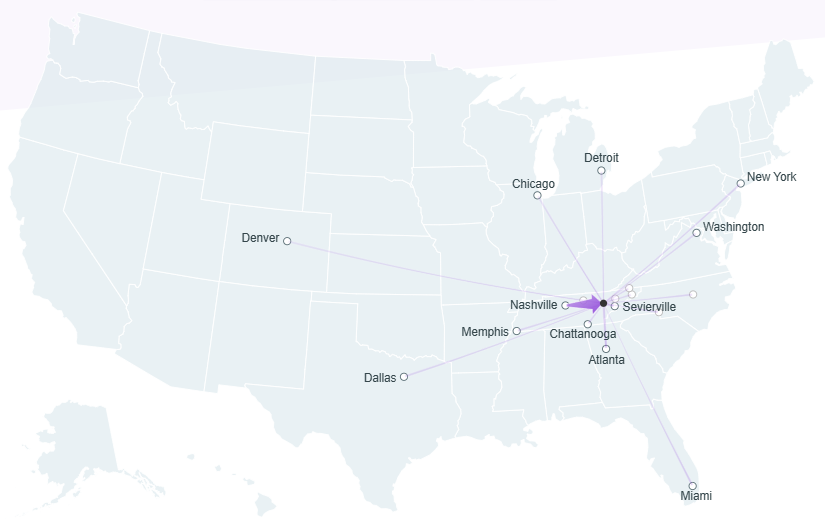
The latest visualization from Apartment List, based on search traffic for rentals, shows that the radius of movers to the Knoxville metropolitan statistical area is shrinking.
As the population influx to Tennessee slows down to a much more normal 1.1% annually, movers are looking closer to home. According to Apartment List, the top three sources of renters coming to Knoxville are now Nashville, Sevierville and Atlanta.
| | |
Outbound searches have remained much the same, with movers headed to nearby metros including Nashville, Chattanooga, Atlanta and Charleston, NC. For the first time this year, Oklahoma City has emerged as a destination from Knoxville. The report cites affordability as a main motivator.
| |
How are oil prices affecting the real estate industry?
While oil prices affect everything from gas to business operating costs over a longer term, the most immediate impact is inflationary pressures causing lenders to increase the cost of borrowing.
"Higher oil prices mean higher mortgage rates."
- Dr. Lawrence Yun, Chief Economist for the National Association of REALTORS®
Watch and share a great video explainer and view more quick takes on today's economic hot topics here.
| | |
Mortgage Rate Update
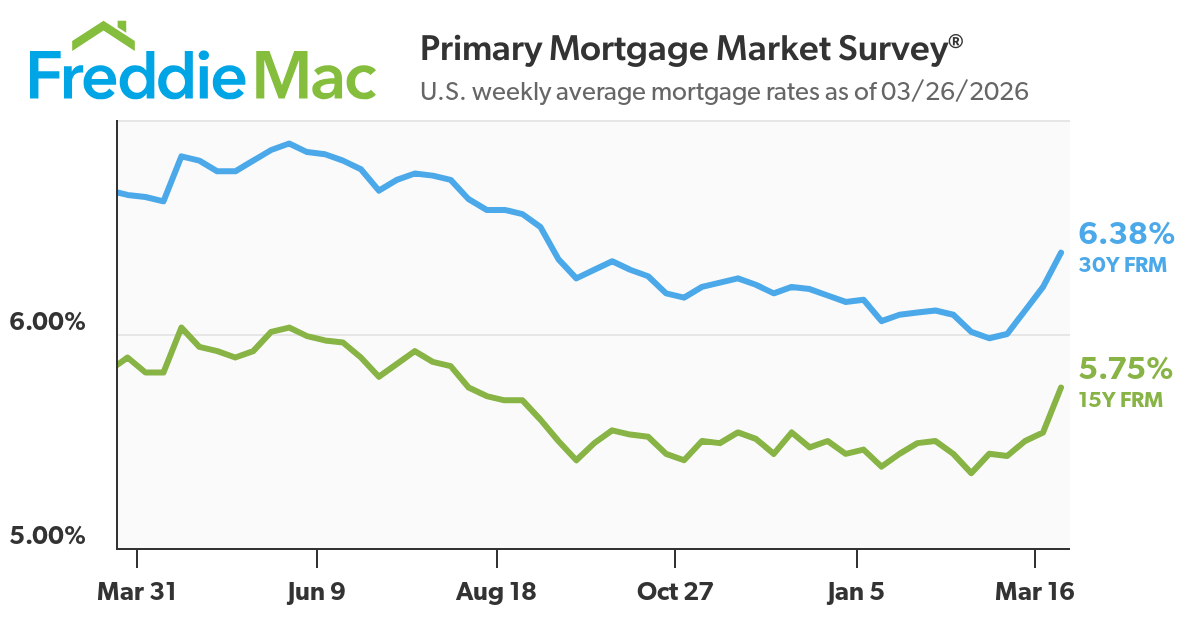
After reaching its lowest point since 2022 in early February, the 30-year fixed mortgage rate (30Y FRM) rose back up to 6.38% as of March 26, 2026.
| | |
Anecdotally, consumers seem to have developed a sweet spot range of rates that they consider "affordable," potentially based on the ongoing media discourse. When rates fell below 6.2%, applications increased dramatically and exponentially compared to the relative affordability context of previous larger percentage drops.
"Mortgage rates below 6%" has been frequently used as a marker of whether national policy aimed at improving affordability is making a difference, at the Federal Reserve and elsewhere.
On the flipside, 6.5% seems to be the threshold where consumer applications dive and potential buyers hold back. In alignment with our 2026 forecast, ETNR believes that rates between 6-6.5% will yield somewhat predictable outcomes. Outside of this range, home sales performance for the year will be anyone's guess.
| | Stay up to date with the most recent information about East Tennessee's housing and real estate market. Here's the latest from local media: | | Market Pulse is a monthly research newsletter providing a rundown of the latest housing and economic research and analysis across East Tennessee. | | Was this email forwarded to you? Subscribe here. | | | | |