First Fall Season September Stats Breakdown
As always, we pull our market stats right away, and break them down for you a few weeks before the "official" release. For September, we pulled these stats from the Austin MLS on 10/3/2024 10:40 am.
This month we're noticing the following....
Buyer Behavior Shifts as Prices Dip Slightly
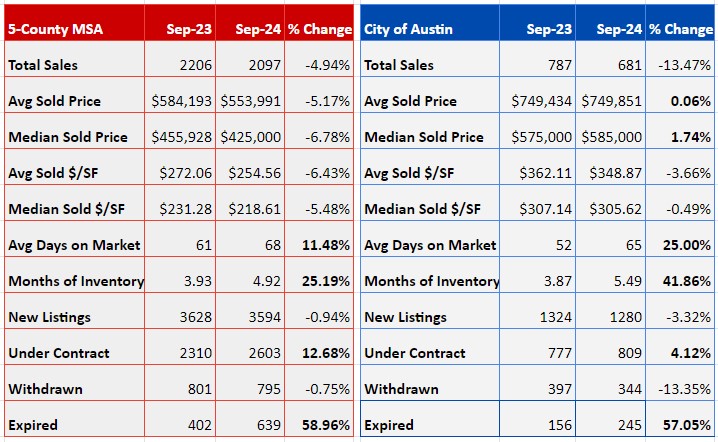
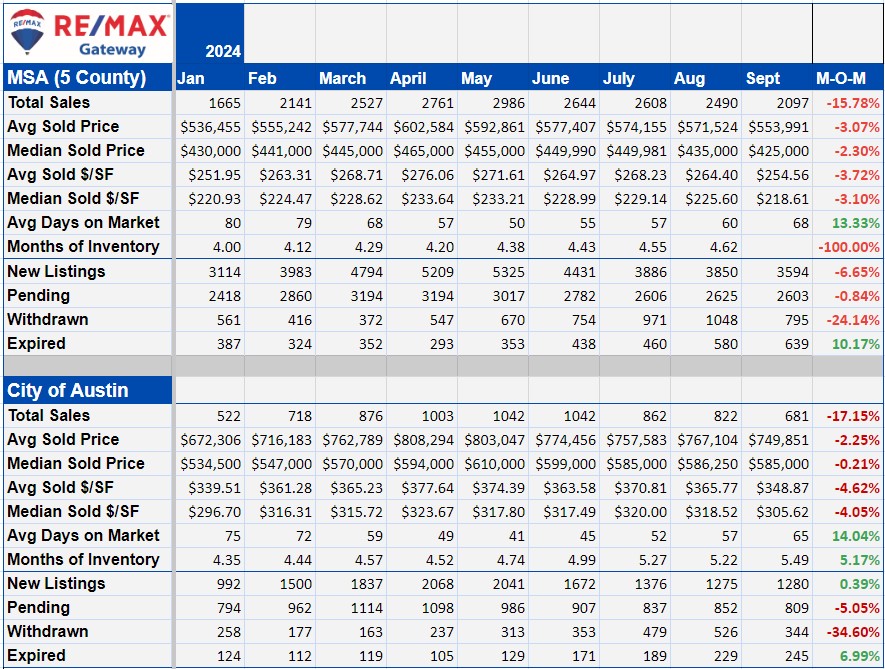
While sales across the MSA and City of Austin have dipped slightly month-over-month (MOM) and year-over-year (YOY), the buyer landscape continues to evolve. With average sold prices down 5.17% across the MSA and slightly steady in Austin, buyers are still looking to scoop up deals, but they’re also pickier than ever. This market correction means buyers have more leverage, but it’s still a balancing act. Sellers, make sure you're ready to price it right to avoid endless DOM (days on market).
Sellers Holding Out for Better Days
Speaking of sellers, many are holding out, as reflected in the inventory rise across the board. Months of inventory surged to 4.92 months across the MSA and 5.49 in Austin—hello, patience-testing times! Meanwhile, expired listings are skyrocketing (up 58.96% across the MSA and a whopping 57.05% in Austin). Many sellers are opting to relist or renew leases, but this presents a great opportunity for buyers who can negotiate on those “stale” listings. Get in there before sellers change their minds.
Pending Sales & Inventory: The Market’s Tea Leaves
While new listings have dipped slightly across both the MSA (-0.94%) and Austin (-3.32%), pending contracts have jumped up significantly (12.68% in the MSA and 4.12% in Austin), showing that deals are still getting done! Inventory levels are at their highest of the year, which gives buyers a buffet of options, with fewer bidding wars.
|