A Newsletter for Extension Staff
Livestock Marketing Information Center
| | | | Week Ending 10/24/2026 | Last | Year Ago | | FI Cattle Slaughter (Thou Hd) | 546 | 573
| | FI Hog Slaughter (Thou Hd) | 2615 | 2577
| | FI Sheep Sltr. (Thou Hd) | 35 | 37
| | Young Chicken Sltr. (Mil Hd) | 172.9 | 172.6
| | - | |
| | Slaughter Cattle Live Weight | 1458 | 1451
| | Slaughter Hog Live Weight | 288 | 291
| | Sltr. Lamb/Sheep Live Wt. | 112 | 111
| | - | |
| | Beef Production (Mil Pounds) | 487.3 | 508.4
| | Pork Production (Mil Pounds) | 561.7 | 558.1
| | Lamb, Mutton Prod. (Mil Lbs.) | 2.0 | 2.1
| | - | |
| | Previous 6 Wk. Moving Avg. | |
| | Total Beef (Mil Lbs) | 476.0 | 497.2
| | Total Pork (Mil Lbs) | 549.3 | 554.2
| | Total Lamb, Mutton (Mil Lbs) | 2.0 | 2.1
| | | |
| | | Source: Various USDA-AMS reports. Some data are preliminary. | | October Cattle on Feed Lower, Red Meat Stocks Higher | | |
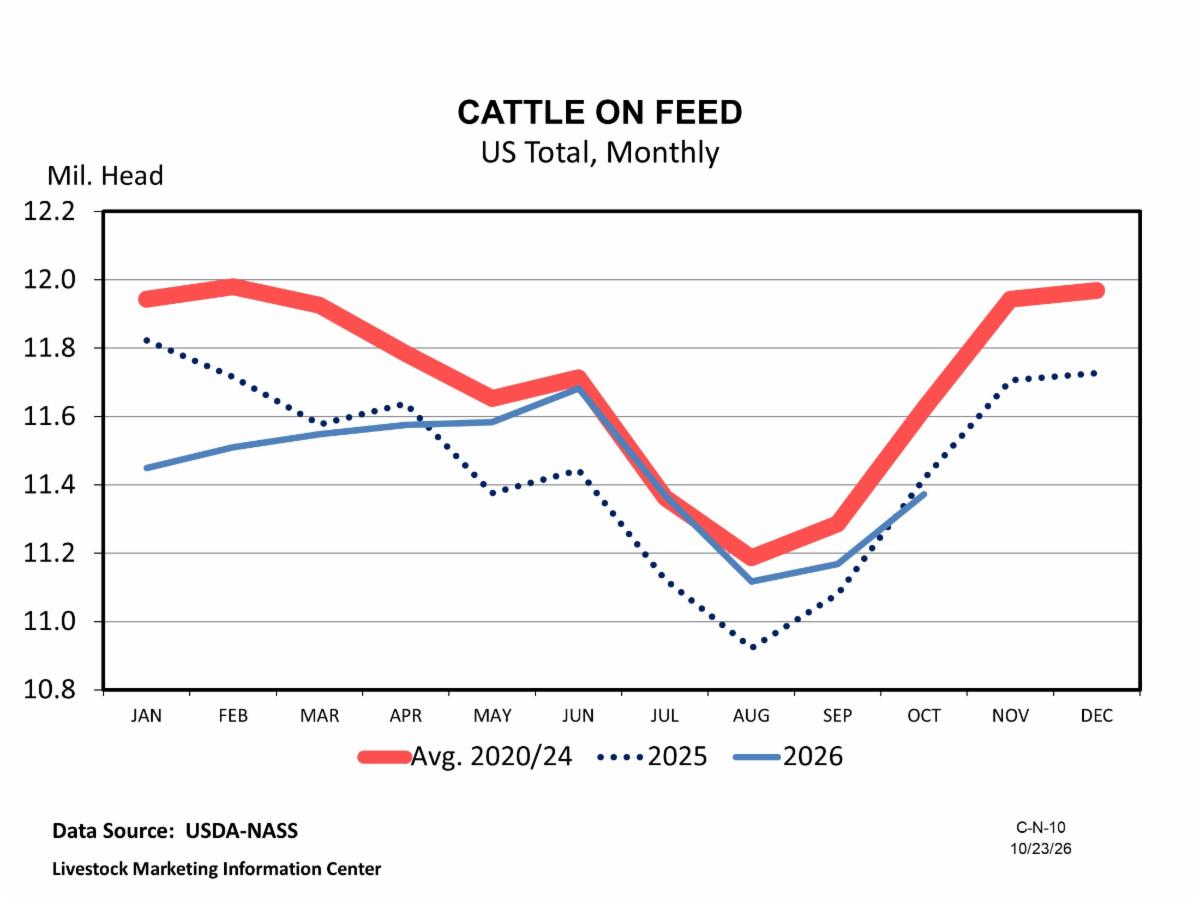
The USDA-National Agricultural Statistics Service (NASS) reported Cattle on Feed as of October 1 to be down 46,000 head (-0.4%) to 11.372 million head. This was the opposite direction of average pre-report expectations, which were expecting a +0.2% increase from last year. The last time cattle on feed were below a year ago was April 2026. Marketings for the month of September were reported at 1.524 million head, down 108,000 head (-6.6%) from last year, which was slightly better than average pre-report expectations of a -7.3% decline. The big surprise in the report was September placements. Prior to the report, average expectations were for an -8.3% decline from last year; actual placements were down -12.1%, or 244,000 head, from last year to 1.777 million head, well below expectations. This Cattle on Feed report was a quarterly report, and USDA-NASS provided a breakout of steers and heifers on feed. The percentage of heifers on feed in October was 37.8%, which is down slightly from 38.1% last year but well above the 32% to 34% range that was reported during the herd rebuilding era in 2015 and 2016.
USDA-NASS reported cold storage statistics for the month of September, and red meat stocks were up +3% to 846 million pounds, while poultry stocks fell -5% to just over 1.1 billion pounds. The increase in red meat stocks was driven by a +9% increase in pork stocks to nearly 428 million pounds, which more than offset a -1% decline in beef stocks to 400 million pounds. The decline in poultry stocks was driven by lower year-over-year chicken stocks of 741 million pounds (-6%) and turkey stocks of 360 million pounds (-5%). Compared to a year ago, eggs in cold storage rose +7% to nearly 20 million pounds. Butter stocks rose +16% from last year to 296 million pounds, and cheese stocks increased +2% to almost 143 million pounds.
| | |
Global Exports to Decline Across Major Suppliers
The USDA-Foreign Agricultural Service (FAS) released its October Livestock and Poultry: World Markets and Trade report on October 9 with its first forecasts for 2027. For beef, the 2027 story is less about production and more about trade. Global beef production is forecast flat at 60 million metric tons (MT) in 2027. Increases in Argentina (+3% to 3.1 million MT), Uruguay (+10% to 630,000 MT), and India (+2% to 4.7 million MT) were offset by declines in Australia (-2% to 2.9 million MT), the EU (-1% to 6.3 million MT), the U.S. (-1% to 11.8 million MT), and Brazil (-2% to 11.8 million MT). The USDA-forecasted decline in Brazil’s beef production is driven partly by their cattle inventory turning lower as producers retain more heifers and reduce the number of cattle available for slaughter. This is evident by the number of available cattle for slaughter, which has fallen about -11% since 2024.
Global exports are forecast down -1% to nearly 13.9 million MT in 2027. Brazil, the world’s largest beef exporter, faces the steepest challenge. After a record 4.38 million MT in 2025, its exports are forecast at 4.15 million MT this year and 4.10 million MT in 2027. Australian beef exports are forecast to increase nearly +4% (80,000 MT) in 2027 to just over 2.2 million MT. Beef exports for Argentina and Uruguay are forecast at 81,000 MT and 50,000 MT in 2027, respectively, rising +5% and +2%.
U.S. beef production is forecast down -1% to 11.2 million MT in 2027 as cattle inventories stay tight and early signs of heifer retention appear. Imports are expected to fall -3% to 2.8 million MT from nearly 2.9 million MT in 2026. In 2027, the forecasted beef imports would be +33% above 2024’s 2.1 million MT. Exports are forecast down -1% as lower production keeps exportable supplies tight, and Australia’s product is likely to be competitive in Japan and South Korea.
| | |
Grain and Hay Market Update
As livestock producers prepare for winter feeding and look ahead to 2027, the outlook for corn and hay prices will help shape feed budgets and purchasing decisions. Corn rallied throughout the summer due to abnormally hot and dry weather across the corn producing states. The price of corn for December Futures on the Chicago Mercantile Exchange peaked at a high of $5.46 per bushel in early September. However, corn prices have since retreated due to bearish reports out of USDA-NASS. The September 1, 2026, corn stocks were reported at 2.095 billion bushels. This was an +8.9% increase from industry expectations and a +35% increase from September 1, 2025, reported stocks. October 9th saw the release of the monthly USDA Crop Production report with a major revision in total production from the September 2026 report. The USDA total production estimate for October was 16.03 billion bushels. This was in stark contrast to industry expectations who pegged corn production in a range of 15.7-15.8 billion bushels. Subsequently, December Futures have penciled in this increase in stocks and production and are currently trading around $4.67 per bushel, a +14.5% decrease since the September highs. Harvest will continue to be a major factor to watch as analysts get a better idea of total production. As of the October 19th USDA Crop Progress report, corn harvested is estimated at 44%.
Hay production, inventory, and prices will continue to be a main topic of discussion as most regions complete cuttings. Nationally, alfalfa hay production is estimated to be 50.56 million tons, up +0.7% from previous season. Other hay production is estimated to be 69.97 million tons, down -3.9% from the previous season. Total hay supplies are projected to be down -2.2% for the 2026/27 marketing year compared to the 2025/26 marketing year. This reflects sustained drought impacts on regions, especially in the west, along with other macroeconomic factors. USDA’s Agricultural Prices report showed the national average price for all hay reached $190 per ton in August 2026, up $29 per ton (+18%) from August 2025.
| | |
State Extension Services in Cooperation with the USDA
Currently, 29 state Extension services participate in the LMIC - Alabama, Arizona, Arkansas, Colorado, Florida, Georgia, Idaho, Indiana, Iowa, Kansas, Kentucky, Louisiana, Michigan, Mississippi, Missouri, Montana, Nebraska, New Mexico, North Dakota, Oklahoma, Oregon, South Carolina, South Dakota, Tennessee, Texas, Utah, Washington, Wisconsin, and Wyoming.
USDA members of the LMIC represent one of eight Federal partner agencies. Those participating agencies are the Agricultural Marketing Service (AMS), Animal Plant Health Inspection Service (APHIS), Grain Inspection Packers and Stockyards Administration (GIPSA), Economic Research Service (ERS), Farm Credit Administration (FCA), Foreign Agricultural Service (FAS), National Agricultural Statistics Service (NASS), and World Agricultural Outlook Board (WAOB).
| | | | |