|
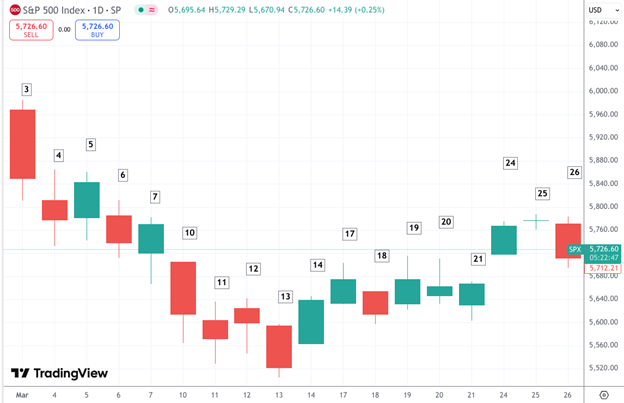
S&P 500 Index - Daily Chart - March 3 - 26, 2025 (Source: Tradingview)
March 3
Wall Street suffered a significant blow as President Trump followed through on tariff plans targeting Canada and Mexico. The Dow Jones Industrial Average plunged by 649 points, while the S&P 500 fell 1.76% and the Nasdaq dropped 2.20%. Adding to the unease, reports emerged that Trump intended to escalate tariffs on Chinese goods to 20%, deepening investor anxiety over a potential global trade war.
March 4
Markets experienced another sharp decline as fears of a full-blown trade war intensified. The Dow sank by another 670 points, marking a deepening red streak. The S&P 500 retreated 1.22%, and the Nasdaq dipped 0.36%. Investors grew increasingly skittish after China responded to U.S. tariffs with its own 15% levy on select American goods.
March 5
Wall Street staged a strong comeback led by a surge in tech stocks, with all major indexes ending the session in positive territory. The Dow rebounded 485 points, the S&P 500 gained 1.12%, and the Nasdaq climbed 1.36%. The rally followed news that President Trump would delay implementing the next round of tariffs by one month, temporarily calming investor nerves.
March 6
The rebound proved short-lived as volatility returned to Wall Street. The Dow gave up 427 points, the S&P 500 fell 1.78%, and the Nasdaq tumbled 2.79%. A sharp 20% drop in Marvell Technology weighed heavily on the tech sector, adding to broader investor concerns about the prolonged impact of the trade disputes.
March 7
After several punishing sessions, U.S. equities managed modest gains. The Dow added 222 points, the S&P rose 0.55%, and the Nasdaq climbed 0.74%. However, the week’s losses were already substantial, with the S&P 500 on pace for its worst weekly performance since the previous September.
March 10
Markets were slammed by a double dose of tariff anxiety and growing fears of an economic slowdown. The Dow plunged 890 points, the S&P 500 sank 2.90%, and the Nasdaq fell a sharp 3.90%. While earlier concerns focused on tariffs being inflationary, investors pivoted toward recession fears as broader economic indicators showed signs of softening.
March 11
Tariff concerns again dictated the direction of the markets, pushing all three major indexes lower. The Dow fell by 478 points, while the S&P 500 declined 0.76% and the Nasdaq edged 0.28% lower. A new round of tariffs targeting Canadian steel and aluminum, signed by President Trump, added to investor unease.
March 12
Despite continued weakness in the Dow, broader market sentiment improved slightly on the back of encouraging inflation data. The Dow dipped 82 points, but the S&P gained 0.49% and the Nasdaq advanced 1.13%. Consumer staples dragged the Dow lower, with notable names like Procter & Gamble, Walmart, and Johnson & Johnson each falling around 2%.
March 13
Renewed fears over the fallout from tariffs pulled the market deeper into the red. The Dow dropped 537 points, the S&P 500 declined 1.39%, and the Nasdaq lost 1.89%. The tech sector bore the brunt of the sell-off, as stocks like Meta and Palantir fell roughly 4%, weakening the broader index.
March 14
Wall Street caught a break as a lull in trade-related headlines allowed investor optimism to resurface. The Dow jumped 674 points, while the S&P 500 climbed 2.13% and the Nasdaq surged 2.49%. Diminished fears surrounding both tariffs and inflation helped fuel the day’s rally.
March 17
Markets started the week on a positive note as a lack of new tariff announcements and a favorable retail sales report buoyed investor sentiment. The Dow rose by 353 points, while the S&P and Nasdaq gained 0.64% and 0.55%, respectively. The sharp February pullback appeared to be stabilizing as resistance levels took hold.
March 18
Major indexes slipped as tech giants once again came under pressure. The Dow fell 260 points, the S&P dropped 1.07%, and the Nasdaq declined 1.66%. Nvidia slid 3.4% following a company conference that failed to alleviate long-term concerns surrounding demand for AI-driven products.
March 19
A reassuring message from the Federal Reserve gave markets a much-needed lift. The Dow climbed 383 points, the S&P added 1.08%, and the Nasdaq rose 1.30%. Fed Chair Jerome Powell’s comments that there was “no recession in sight” helped ease recession-related fears and gave Wall Street some breathing room.
March 20
The markets struggled to find direction amid conflicting signals on the strength of the U.S. economy. The Dow slipped 11 points, the S&P edged down 0.22%, and the Nasdaq fell 0.30%. A lukewarm home sales report and stable unemployment numbers helped calm some nerves, though inflation and recession concerns lingered.
March 21
Markets narrowly escaped a down day as a late-session rally helped stocks finish in the green. The Dow gained 32 points, the S&P ticked up 0.08%, and the Nasdaq rose 0.39%. Investor optimism was buoyed by President Trump’s remarks suggesting flexibility in the upcoming April 2 tariff decision, hinting at potential relief.
March 24
Washington's optimism sparked a robust rally on Wall Street to kick off the week. The Dow soared nearly 600 points, the S&P climbed 1.76%, and the Nasdaq rose 2.16%. Hopes that the next round of tariffs may be less severe than anticipated helped re-energize the market.
March 25
Markets flattened as investors took a breather following the previous session’s rally. The Dow added a modest 4 points, the S&P rose 0.16%, and the Nasdaq advanced 0.53%. However, a weak consumer confidence report signaled lingering unease among households regarding ongoing economic policies.
March 26
Tech and semiconductor stocks weighed heavily on markets as fresh concerns out of China dragged down sentiment. The Dow declined 132 points, the S&P fell 1.12%, and the Nasdaq dropped 1.83%. Nvidia was among the hardest hit after reports of new Chinese restrictions on semiconductor imports, compounding fears about tariffs and the sustainability of AI demand.
|