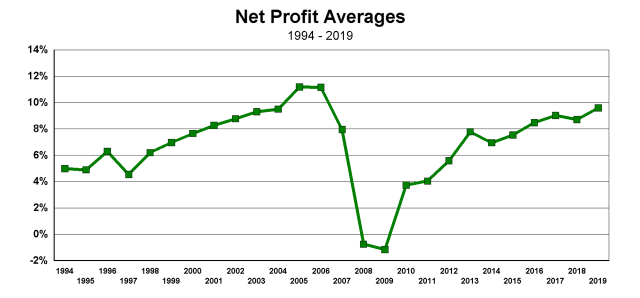
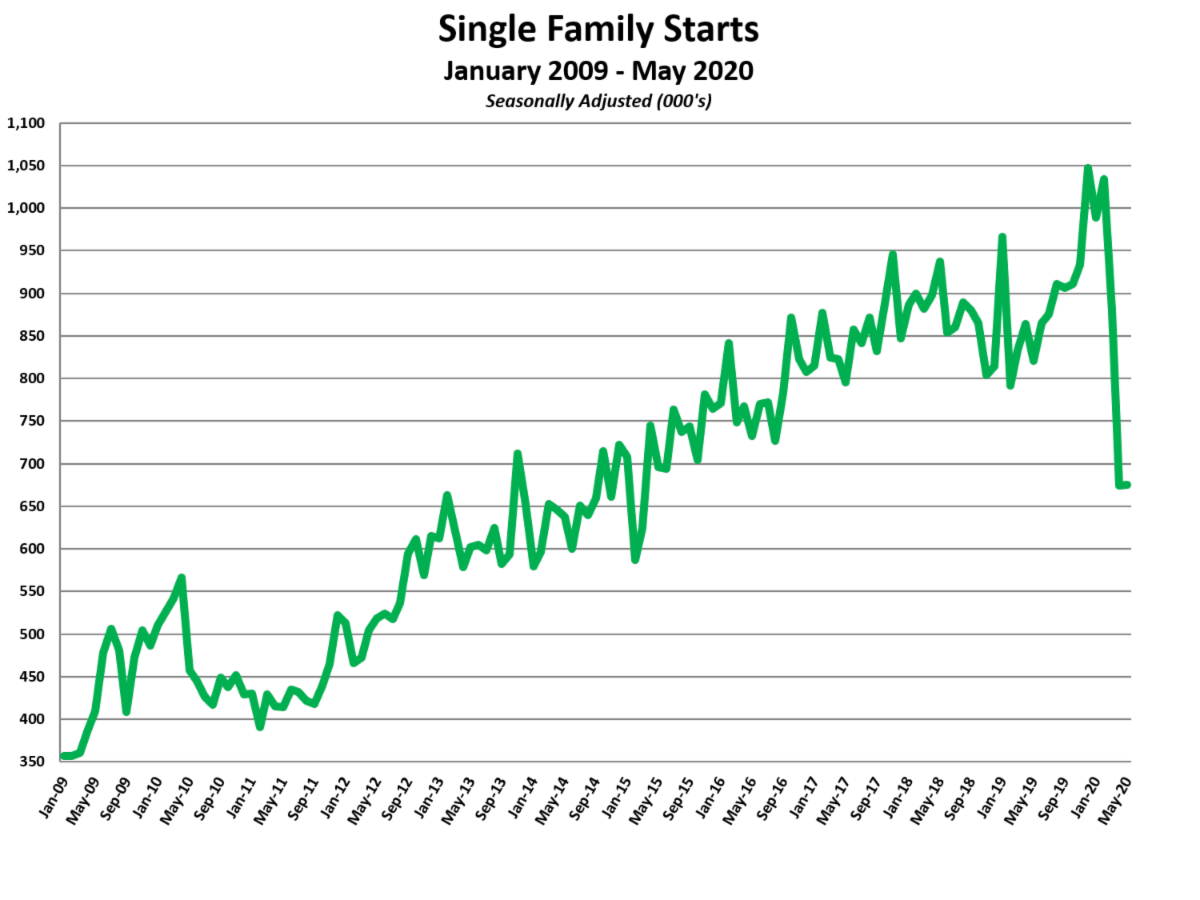
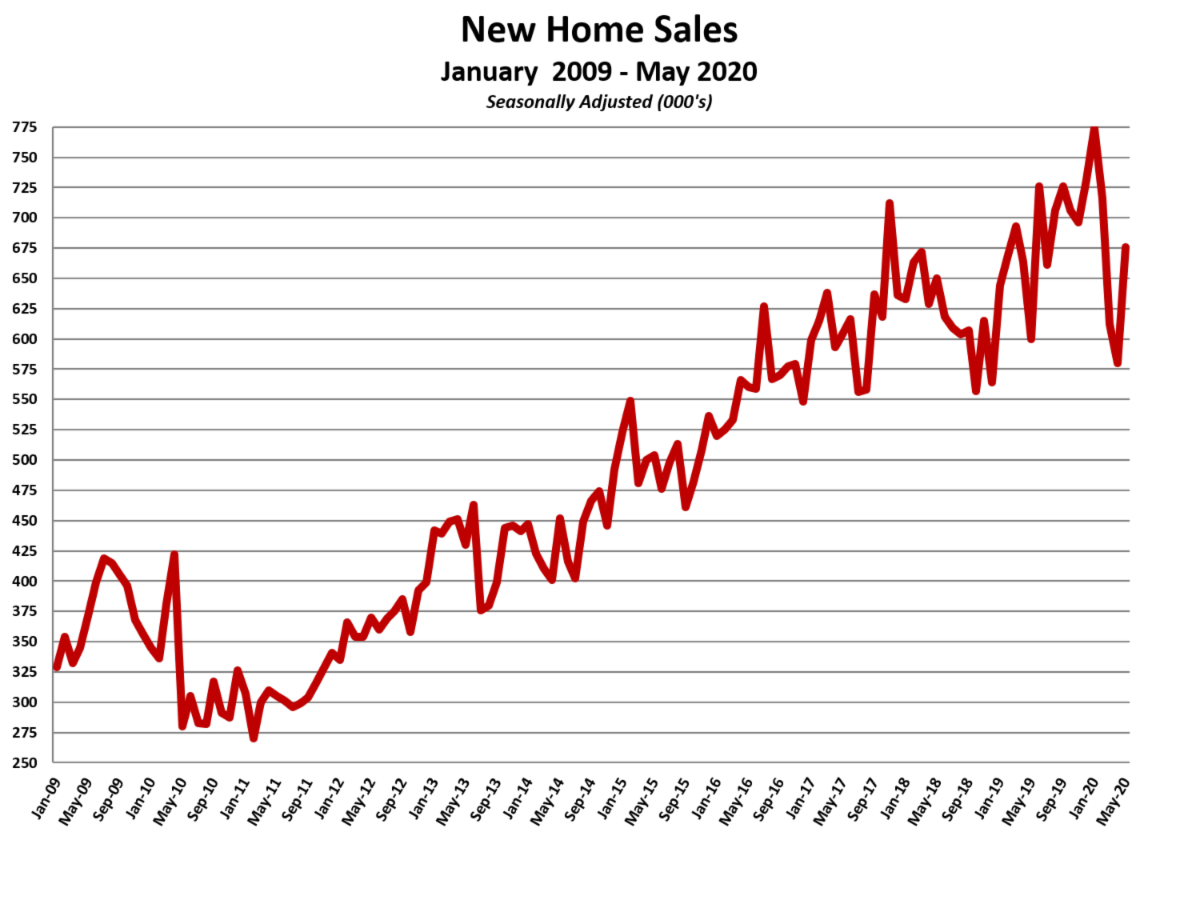
Trend lines help identify patterns and can be a useful forecasting tool. Chuck Shinn, president of Builder Partnerships, has been compiling housing trends data for the builder community since he was an economist for the NAHB in 1968. Chuck's housing industry charts track historical trends in housing activity since 1959, and monthly activity of the recovery from the 2009 housing recession.
After the 2009 housing recession, trend lines show the industry on a gradual, upward trajectory. However, as evident in Chuck’s current charts, the industry never reached pre-recession levels before experiencing a sharp decline caused by the COVID-19 shutdown of the U.S. economy in March.
New home sales increased 16.6% in May to 676,000 surpassing all expectations. Existing home sales fell both in April and May, down a total of 25.8% since March, which was down 8.5% from February’s annual rate of sales.
Click
here to view the 33 charts in Chuck Shinn's current report on housing activity.