By Charles C. Shinn Jr., PhD
Founder, Shinn Builder Partnerships
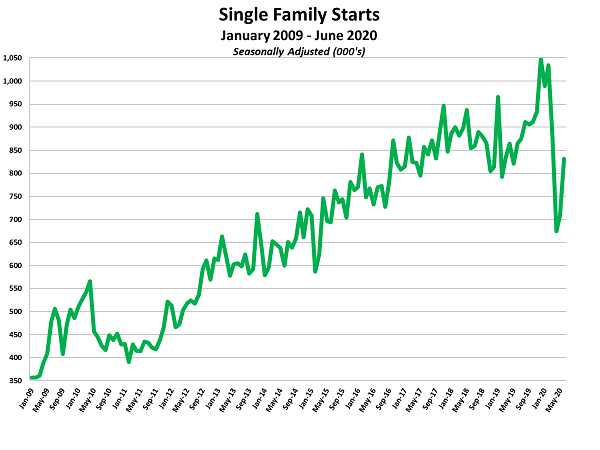
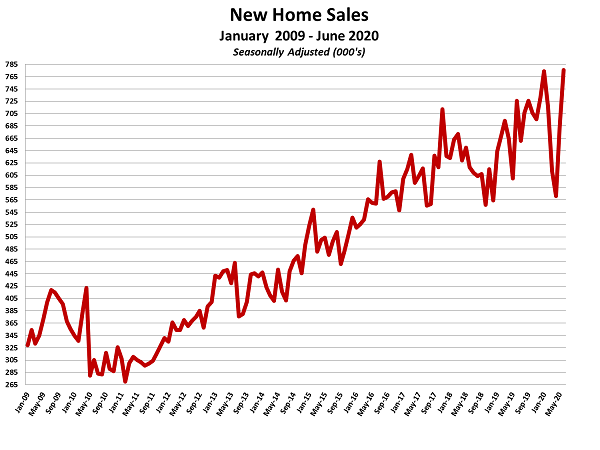
Both new and existing home sales have experienced strong recoveries from the COVID-19 shutdown during May and June. Home builders experienced increases in sales of 19.4% in May and 13.8% in June. May permits increased 12.0% from April and increased another 11.8% in June which are leading indicators of housing starts which increased 4.4% in May and 17.2% in June.
For existing homes, pending home sales in May increased at a record setting pace of 44.3%, and June sales registered a 20.7% increase from May sales. The median sales price for existing homes marked it 100 straight months of year-over-year increase at $295,300.
My housing trends charts visually show annual and monthly trends of the housing industry for existing home sales and new home permits, starts and sales. The first series of charts are annual information from 1959 to 2019, 1978 to 2019, and 1991 to 2019. The 1991 to 2019 charts represent the annual activity during the last cycle and recovery.
These charts reveal how weak the recovery was during the 2010 decade. The first set of monthly charts—from September 2005 (cycle peak) to present—represent the collapse of home building and its recovery. The remaining charts cover the home building industry’s recovery from January 2009 (bottom of cycle) to present, including both new construction and existing home sales.
Click
here
to view my current report on housing activity.