The Miles Franklin Newsletter
|
|
From The Desk Of David Schectman
|
|
Gold preserves wealth, but silver can make you rich
– David Morgan
The Gold/Silver ratio today stands at 102.7x, the millennium-to-date average now 65.7x: the last date on which the ratio was below its evolving average was better than seven years ago on 08 November 2013.
– Mark Mead Baillie
Dow 1929/30:
First drop: -48%
First bounce: +48%
Nasdaq 2000:
First drop: -41%
First bounce: +41%
S&P 2020:
First drop: -35%
First bounce: +35%
Spooky. Dow and Nasdaq went on to drop 86% and 74% from those initial bear market rallies.
– Henry Winstanley
Stocks and gold can't both be right. Not unless gold buyers and equity bulls alike simply see cash as trash, and are now racing to get rid of currency at any cost as governments everywhere rush to destroy it in the name of fighting the deflation they have imposed to fight the virus.
– LeMetropole Café
Gold is up 13.82% against USD in the year-to-date (YTD)
– David Schectman
ECONOMY dying. FED incompetent. Next BAILOUT trillions in pensions. HOPE fading.. GOLD @$1700. Predict $3000 in 1 year. Silver @ $17. Predict $40 in 5 years. Bitcoin @$9800. Predict $75000 in 3 years. PRAY for the BEST-PREPARE for the WORST.
– Robert Kiyosaki
Let me break it down for you... Gold is trading near its ALL TIME HIGH and GOLD STOCKS ARE TRADING NEAR 20 YEAR LOWS!!! Hopefully I don't have to draw you a picture....
"According to Alexander, the world is witnessing financial market manipulations on a scale and frequency that have rarely been seen before."
– Derek
If there are no negative consequences from borrowing all this money to save the economy, then why do we have to pay taxes?
– Bill Holter
|
|
David's Commentary (In Blue):
Traditionally, gold rises when the stock market falls. Am I hoping for a stock market collapse? No. I just want to find an island of safety in the midst of the Fed buying stocks, bonds and printing unlimited amounts of money to keep the markets from collapsing. In japan the BOJ has been buying stocks for years and the Nikki has been stuck around 20,000. All of the Fed’s “support” may be able to keep the stock and bond markets from collapsing for a while, but I do not see how the stock market can grow in the midst of a global recession/depression. The stock market doesn’t have to fall for gold to outperform. If gold goes to $3,000 and the stock market rises to 30,000 the Gold to Dow ratio will be 10 to 1. It is currently at 14 to 1. Gold will have outperformed stocks by 40%. And, if the Dow falls to 15,000 the ratio would be 5 to 1.
Half of all Americans are liberals and half are conservatives. Some like Mozart or rock or jazz or rap. Some like blonds and some like brunettes. There are always different ways to look at things and different views to choose from. My views are just that; they are my views. Everyone is entitled to see things any way they choose. It’s your view that counts - for you, not my views. I’m not asking for anyone to endorse my views. What I hope to accomplish is to provide you with a realistic, logical perspective on the economy, the Fed, precious metals, the dollar, inflation and the stock market that will assist you in determining the best way to deal with today’s especially difficult issues. Then you decide what course of action suits you best. I do not give financial advice, I will tell you what I do and what I believe is the best course of action, but you must decide for yourself what you need to do.
I like to think of myself as your “cheerleader,” and a person who holds your hand during difficult and conflicting times. There are times when is hard to toe the line and have faith in gold and silver, because the media and Wall Street are constantly bad-mouthing precious metals and cheerleading the stock market and economy. Precious metals cycle and there are times when they become more important than ever. We are now in one of those periods.
When was owning gold (and silver) most advantageous?
In 1930
. That is when the Dow crashed and the Dow to Gold Ratio fell from
17 to 1
to 1 to 1 ($35 gold and 35 Dow).
In
1966.
Stocks were expensive and gold was cheap and the ratio was
27 to 1
. In 1980 the ratio fell once again to 1 to 1 ($850 gold, 850 Dow). Then, stocks were cheap and gold was expensive.
After the Dow crashed in 1987, it proceeded to move up until 2000, culminating in the dot.com bubble collapse. In
2000
the ratio stood at
40 to 1
(Dow around 11,000 and gold $275) and then, by Dec. 2012, the ratio crashed to 7.68. Stocks were cheap and gold was expensive.
In
2018
the ratio was
21 to 1
and it has been steadily falling for the last two years – even BEFORE the Pandemic turned the world upside down. It is now 13.94 to one and, if history is our guide, is heading toward 2 to 1 or 1 to 1. Stocks are overvalued compared to gold now and the ratio is heading lower and lower, favoring gold over stocks.
What I am saying is that there are times when you want to lighten up on stocks, or be out of the market entirely, and bulk up on gold and silver. The Dow to Gold Ratio is a reliable indicator. And now it is saying gold will be a superior store of value compared to stocks.
This is the time to measure your wealth in ounces, not in dollars.
It’s clear enough to understand why that is so, now. Our unemployment rate and GDP are crashing to Great Depression levels, or worse. Our solution, or should I say the Fed’s solution is to paper everything over. Trillions no longer mean anything and it looks like our deficit in 2020 will top $7 trillion. For me, that number is very significant because in 1983, when I went to work in the precious metals industry, our total national debt, the accumulation of over 200-years’ worth of borrowing, including the Civil War and the War of 1812, WW1, WW2, the Korean War and the Viet Nam war totaled up to just
ONE TRILLION DOLLARS
. In the last few weeks we have added another $3 trillion to the debt on the way to adding $7 trillion before the year is up. And that probably will not be enough.
If there were ever a reason to own gold and silver it is NOW. If you can’t see that clearly, then you are wasting your time reading this newsletter or any of the like-minded industry commentary. If you think we can print our way to prosperity then there isn’t anything I can say to you. If you think that unbridled money creation at this level will not lead to hyperinflation followed by a crushing deflation then you are not paying attention. Check out Weimar Germany in 1922, Zimbabwe, Argentina, Brazil and Venezuela, to name just a few. Donald Trump wants to make America Great Again, but in fact Trump’s America is heading full speed toward being another banana republic. I am not blaming Trump for this, but it’s his show now and he will be the one to take the blame.
I want to take a moment to talk about silver. For the last 12-18 months, I recommended switching from gold to silver. At the time I started making the recommendation, the gold to silver ratio was in the mid to high 80s. It took 80-some ounces of silver to buy one ounce of gold. I said that the ratio was historically on the high side and silver was too cheap, relative to gold. Many of you took our advice. I switched a portion of my gold to silver in my portfolio and so did my son Andy. The ratio recently broke all records as it briefly hit something like 125-130 to 1. Now, silver has come to life and as of today, the ratio today is down to 100 to 1. The “average” ratio, for the last several decades is around 55 to 1. A decade ago, at the peak of the most recent bull market ($50 silver and $1,900 gold), the ratio was as low as 38 to one. Silver is once again trending toward those levels and our advice, which turned out to be early, will prove to be correct. However, at these levels, silver is a much better buy than gold. Even with the uncommonly high premiums in physical silver at the wholesale level, the ratio is still favors silver over gold – in spite of the premiums.
Here are three excellent articles on silver.
|
|
|
|
Zero Hedge
Although the silver-gold ratio has fallen, the
white metal remains historically inexpensive
compared to gold. We still effectively have silver on sale...
Mike Savage
What Is Going On
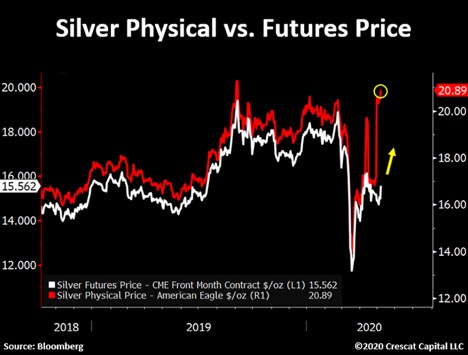
Physical silver just surged above $20/oz! Largest disconnect between physical & future prices in almost a decade. Big move in silver futures likely underway. This truly is a supercharged setup for precious metals.
|
|
|
|
What’s Going On Here?
Many people have to be asking this question as the “virus” is proving to be no more deadly than the seasonal flu based upon research from around the world including Stanford University. Still, we have most states that are still mostly locked down and populations locked in. 24/7 fear-mongering by the major networks are the main reason, in my opinion, why many are still so fearful.
I am not saying people are not dying and that this is nothing BUT the draconian response by politicians is making less and less sense every day. As a matter of fact, doctors are saying that Sweden did not lock down and their number of deaths is slightly higher than their Scandinavian neighbors who did lock down. The numbers are not far off and there is LESS of a chance of a second outbreak later this year because of herd immunity which is NOT achieved when people are separated.
I am no expert in this area but I do pay attention to what those who are experts have to say. Of course, none of this is reported in the mainstream media and the faux fact-checkers on Facebook and other sites stifle the dissemination of this information.
This leads me to believe that this crisis was planned and is being used to cover up the real cause of our economic collapse which is too much debt and not enough income without conjuring money up out of nowhere to provide the illusion that all is well.
Almost everyone with a functioning brain can now easily see how manipulated and distorted “markets” are. With each round of dire economic news which, in a real stock market, would likely cause stocks to collapse, these Frankenmarkets continue to rise- even more so the worse the news gets.
Just today it was reported another 3 million people plus filed for unemployment in the last week. That makes 33 MILLION lost jobs in just the last 7 weeks. WOW! And many won’t be coming back anytime soon. Anyone who expects a V shaped recovery in the economy is delusional. The “markets” are a different story because “printing and buying” has left any resemblance of the real economy and the “markets” far in the rear- view mirror.
The futures are way up as I write this on Thursday morning and here are some headlines on ZeroHedge:
“It’s Devastating: Kashakri Says Real Unemployment Rate Is As High As 24%. (It was 20% BEFORE THIS STARTED but at least someone is pointing out that the numbers are not real.) More than likely pushing 50%!
“BOE (Bank of England) Warns Of Worst Economic Slump in 300 Years”
““Biblical” Wave Of Bankruptcies Is About To Flood The US”
“IRS Orders The Dead To Return Stimulus Money” (What comment could possibly be made here?)
“Stocks Have Never Been More Expensive: Disconnect Between Markets And Reality Hits Idiotic Levels” (“Printing and buying” Will do that. Those at the top get wealthy beyond their wildest dreams, the middle class gets crushed and the poor get poorer- what could go wrong?)
The Fed is the lender, buyer and OWNER of last resort.
Why is it that the US Treasury had to put $450 BILLION into the Fed to backstop the first $450 Billion in losses that may take place when they start to buy junk bonds in Early May?
They are expected to use 10X leverage to buy $4.5 TRILLION in junk bonds. I wrote a few weeks ago that this could be a backdoor government takeover of private business. Bank of America, while not coming right out and saying it, seems to agree. In a note to the Fed the following quote: “Not to mention the Fed will own debt in companies that will soon restructure and end up holding post-petition equity”. Equity is stock ownership in said company. This appears not to be a bail-out but a BUYOUT of America’s companies.
Could this be a part of the plan- wipe out most small businesses, buy up the big ones, own it all and call all the shots?
This is an entity that conjures up trillions out of nowhere and somehow it makes sense that the US taxpayer (Us!) should backstop an entity that charges us interest on money that was created out of thin air? Is anyone else a little upset that Wall Street has gotten trillions in loans in the last few months at not much more than 0% with not a peep from congress while votes need to be taken to throw a few crumbs to keep the regular folks from taking to the streets? Or that major corporations bankrupted the first bailout for small businesses and that those who finally get loans get to pay more than 10 times what the Wall Street banks were charged?
Does it make any sense, as the Fed is conjuring up trillions, that gold and silver remain range-bound? Only if you understand that the faux cash provided not only props up stocks, bonds and real estate but also allows banks to issue paper contracts that appear to be gold or silver to be sold into the market to reduce the price. Of course, at the same time central banks are setting records for purchasing the real metal, private banks are buying and the regular guy, if he can find any at all, has to pay monster premiums and wait for a month or more to get delivery. Does that sound like a recipe for lower prices- or HIGHER?
The clock is ticking- both for the prop-up and suppression schemes. As the numbers are growing exponentially it appears that the cliff is rapidly approaching.
I wrote years ago about a possible event that could lead to the next black swan event. I opined that the bankruptcy of a state- like Illinois for instance- could lead to a major meltdown. The die was cast for MANY states that have overpromised for pensions, etc. and were running tens of billions in deficits for years. They cannot conjure up money from nowhere like the US government and could have faced decisions that would likely have led to bankruptcy. That would leave many asking “who’s next” and likely cause a major selloff of most assets.
Enter the Coronavirus! California is getting up to $10 Billion in freshly conjured up cash, Illinois is getting even more and this fake money will give the illusion (for a very short period of time) that all is well. Unless the numbers go WAY up this “money” will be gone in weeks or if they’re lucky- months.
The virus will be blamed for DECADES of malfeasance by local and state leaders that basically bought votes with promises of riches in the future for those who played ball. They likely all knew that one day it would blow up but figured they would be long gone at that time. Many are. That day has arrived and only a bailout with fake money from nowhere can hide the real carnage taking place on the balance sheets of cities, states and local governments. But for how long?
John Rubino wrote an article that had these quotes:
“The people running states like New Jersey and cities like Chicago know they’re broke”
“They also know they have only two possible outs: Bankruptcy or some form of federal bailout”
“Gov. JB Pritzker (Illinois) almost instantly had his hand out for- get this- $41 Billion, a sum equal to three times the state’s estimated pandemic-related revenue loss in the coming year. Overall, governors have asked for about $500 billion in aid”.
In our state of Pennsylvania, we have a whopping portion of a day set aside in our rainy-day fund- among the worst among all the states and we have an economy that is on life support with the electricity out.
In the meantime, tens of millions are wondering when things will go back to normal. Those who are astute are asking what things will look like when we attempt to get back to somewhere near normal.
Everything has changed. Have you adjusted your portfolio to adjust to these changes or are you holding on and hoping? Hope is NOT a strategy.
Be Prepared!
|
|
|
|
SRSrocco
Silver Just Broke Through A KEY Long-Term Technical Level
Not only is silver having a good day today, but it also broke through a KEY long-term technical level. While many precious metals investors do not follow or believe in technical analysis, most successful traders most certainly do.
Some technical analysts are suggesting that silver may now start to outperform gold
. We will see.
However, this morning I was watching the short-term futures price on Investing.com. The Investing.com silver price is higher than Kitco.com because they are showing the larger traded July Futures month. Thus, Investing.com is showing silver trading above $17.
I encourage members to follow me on my SRSrocco Report Twitter feed. I posted a few tweets on the Short-term silver breakout as it occurred. It’s amazing how the metals trade off support and resistance levels. Here was my first tweet as silver was getting ready for its short-term breakout:
About an hour and a half later, I posted the next tweet on the continued short-term silver breakout:
After silver broke through the RED LINE, it consolidated for about an hour and retested the new support area (BLACK DASHED LINE) before continuing higher. I’ve watched a lot of intraday trading and had a good gut feeling this was going to take place.
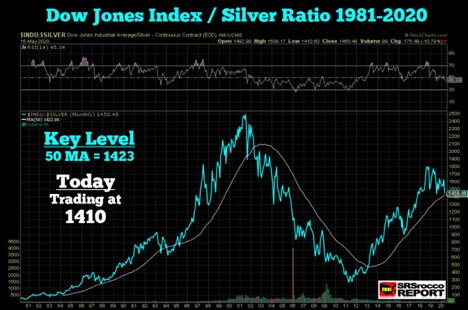
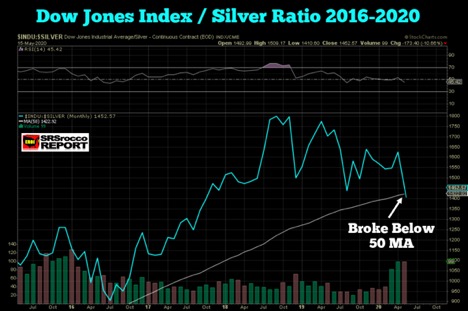
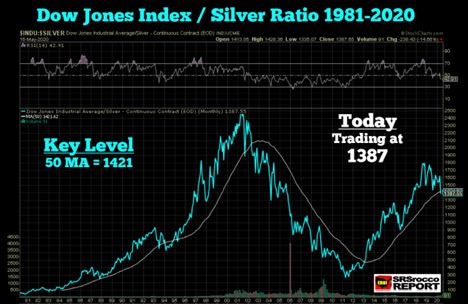
While it is nice to see silver trade higher today, I was more focused on the longer-term charts below. The long-term monthly chart for the Dow Jones Index-Silver Ratio shows that an important technical level is the 50 Month Moving Average (50 MA). For the last seven years, the Dow-Silver Ratio has been below the 50 MA.
However, that changed today as the spike in the silver price pushed the Dow-Silver Ratio below it for the first time since 2013
:
|
|
|
|
When the Dow-Silver Ratio is increasing, the silver price becomes cheaper in relation to the Dow Jones Index, and the opposite is true when it heads lower. As we can see, the Dow-Silver Ratio fell to a low in May 2011 at 250/1, when silver reached $50 an ounce.
Over the next seven years, the Dow-Silver ratio increased and hit a peak of 1800/1 in October 2018.
|
|
|
|
While technical indicators only provide CLUES as to the future direction of a stock, bond, or commodity, it’s nice to see that silver finally broke below the 50 MA. I edited the chart above because Stockcharts does not provide live prices for Silver or Gold. So, I had to calculate the Dow-Silver Ratio manually and show where it will likely be at the end of the day when Stockcharts updates the silver price. Time will tell if the Dow-Silver Ratio will continue lower.
UPDATE AFTER CLOSE:
The Dow-Silver Ratio fell to 1387 as of the close on Friday when Stockcharts updated the Silver price.
|
|
|
|
With the massive money printing and liquidity injections by the Fed, I believe it will be very positive for the gold and silver prices moving forward.
Furthermore, with only 2.4 billion oz of total physical gold investment in the world versus between 3-5 billion oz of investment silver, there just isn’t that much to go around when investors finally get PRECIOUS METALS RELIGION
…. only at much higher prices (values).
Lastly, if you haven’t watched my newest video update, there’s some important information and data you won’t find anywhere else on the internet:
|
|
Gold leads silver on the way up. So where is gold headed
|
|
$1,800 is gold’s line in the sand. Once broken, $1,900 and then $2,000 should follow shortly
|
|
|
|
Sean Broderick
3 Smokin’ Hot Gold Charts
6
Gold is lookin’ shinier all the time. This past week was very strong as gold continues the bull market it started last year. And man, you ain’t seen nothin’ yet.
Let me show you a series of charts that make my point.
Chart No. 1: You Can’t Print Gold
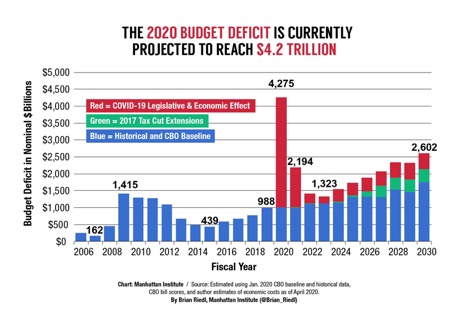
Have you seen the way that the Federal Government is spending money? The Congressional Budget Office already admitted last month that the U.S. budget deficit will break $3.7 trillion in 2020.
But that’s an optimistic view.
According to many analysts, the combination of economic crash and COVID-19 rescue spending is going to cause even more red ink. Conservative think tank Manhattan Institute expects the budget deficit to be $4.2 trillion this year and stay high for years to come.
|
|
|
|
How is the Federal Government covering these checks? They’re electronically printing fiat currency to do it.
You can’t print gold. So, even though the U.S. dollar remains strong against other currencies for a bunch of reasons — basically, the greenback is winning a beauty contest in a leper colony — traders and investors alike keep buying more and more gold as a hedge.
What do I mean by that? Well, gold is a hedge against the federal deficit, fiat currency debasement and a global pool of negative-yielding bonds. It’s even a hedge against something we haven’t seen in a while, but traders fear could be around the corner — inflation.
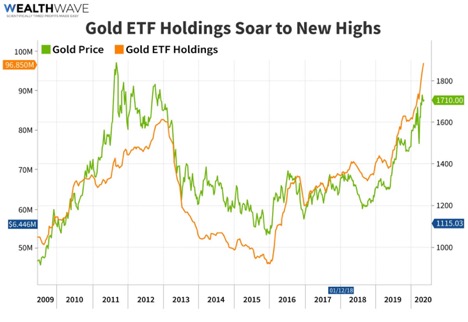
Chart No. 2: Gold ETFs Hit New Record
And we can see traders buying gold hand over fist by looking at the holdings in physical gold exchange-traded funds (ETFs).
Globally, ETFs added another 170 metric tons of gold to their holdings in April. That took the total to a new all-time high, according to the World Gold Council.
And so far, the buying has continued in May with gold ETFs now holding 96.85 million troy ounces, as you can see from this chart.
|
|
|
|
Is the hand-over-fist buying in gold ETFs pushing gold prices higher? It sure looks like it.
Now, the gold ETFs can be a two-edged sword. When gold ETFs sell gold, that weighs on the market. But for now, at least, the path seems clear — as gold ETFs add ounces, the price of the yellow metal will trend higher.
And traders are doing this with one nervous eye on the Fed.
Why? Because they’re afraid the Fed will go negative.
The Fed is currently targeting a benchmark interest rate of between zero and 0.25%. That seems low. But the fed funds futures market shows that traders are pricing in the potential that the Fed will slash its benchmark two-year Treasury rate below zero next year. The five-year Treasury also hit an unprecedented low.
This is happening even though Fed Chair Powell has pushed back against the idea of negative rates. But Treasuries went into a slide when Atlanta Fed President Raphael Bostic said on Thursday that the U.S. central bank would deploy its “full arsenal” to aid the U.S. economy, which has been left reeling by the COVID-19 pandemic.
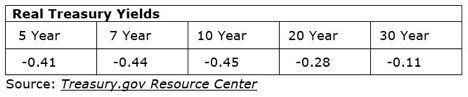
So, how does any of this affect gold? Bullion typically benefits in periods of low U.S. borrowing costs and negative real rates. After all, one of the points that bears make about gold is that it doesn’t pay interest. Well, now it looks like interest on Treasuries is headed to less than zero.
It’s even worse when you look at real interest rates — yields taking inflation into account. Real interest rates are negative all along the curve, according to the Treasury Department
|
|
|
|
Again, negative real rates are traditionally bullish for gold.
And it’s not the only bullish force. There are OTHER things going for the metal.
The World Gold Council reports that central banks continued to amass gold. Global gold reserves grew by 145 metric tons in the first quarter.
Also, total gold supply fell 4% in the first quarter as COVID-19 lockdowns hit mine production and gold recycling. Operations halted at many mines to stem the spread of the virus. And recycling came to a standstill towards the end of the quarter as consumers were confined to their homes.
Will these forces continue? They will if the pandemic is harder to stop than Wall Street and Washington believe. And I’m afraid I’m a pessimist on that count. I think this pandemic will drag on for longer than many people imagine.
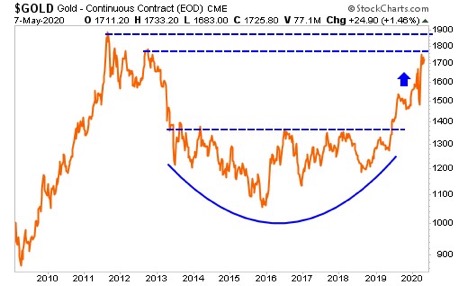
Chart No. 3: Gold’s Next Breakout Is Coming
Now, let’s look at the bigger picture — a multi-year chart of gold.
|
|
|
|
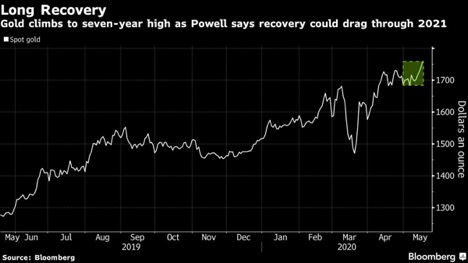
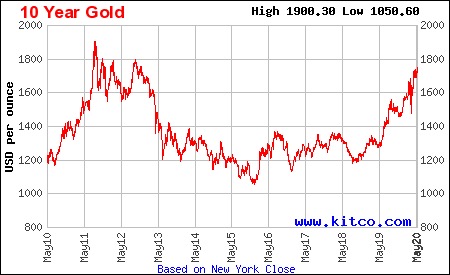
You can see that gold formed a bowl-shaped consolidation pattern for years. It finally broke out of that last year, and it has zig-zagged its way higher ever since. The next two levels of overhead resistance are $1,785 and $1,886.
I believe gold could push above both those levels this year. In fact, my target for this year is $1,949. After that, we’ll probably see more consolidation before gold pushes above $2,000. But after that, we’re off to the races.
How high could gold go in this big bull run? I don’t have a crystal ball, so it’s tough to say for sure. But $3,000 an ounce and even $5,000 is very possible.
My Gold & Silver Trader subscribers are already riding this wave to fat open gains. And I’ll be adding new positions soon. Remember, in a bull market, pullbacks are buying opportunities.
The next buying opportunity for gold could be right around the corner. And the next leg right after that could be even higher.
I hope you’re riding this massive gold wave. The best is yet to come.
All the best,
Sean
|
|
|
|
Egon von Greyerz
TOTAL CATASTROPHE OF THE CURRENCY SYSTEM
As the Nasdaq makes a new high for the year, the world outside the stock market timebomb is falling apart. For example, the UN agency, The International Labour Organization (ILO) reports that 1.6 billion jobs are at risk in the global economy. That is half of the global workforce of 3.3 billion. Particularly vulnerable are the 2 billion people in the informal economy. For most of these vulnerable people, this means no income, no food and no security reports the ILO. This is a human tragedy on a massive scale and most people in the Western world are totally unaware.
HALF UK ADULTS PAID BY THE STATE
Looking at the UK, 23 million people which is half of all adults are now paid by the state. This includes people being furloughed, on unemployment benefits and public sector workers and pensioners. That is just an incredible proportion of the population which are getting free money for making no productive contribution. Yes, the human side is of course incredibly important and suffering people should be helped. The problem is only that THERE IS NO MONEY. What half of the adult population is receiving is money that doesn’t exist but is just printed out of thin air and thus has no real value.
REAL US UNEMPLOYMENT 39%
If we take the US, Q2 GDP is forecast at -35%. Over 20 million have lost their jobs and both small and big businesses are going into a black hole. Most of these 20 million have no savings and couldn’t survive for one month without government handouts. If we take the real US unemployment figure based on ShawdowStats, it is now 39%. If we compare that to the 25% unemployment during the depression in the 1930s, it is a staggering figure.
If the world, as I believe, has now entered a secular downturn of major proportions, many of these 20 million will never get their jobs back. That either means no income, no food, and nowhere to live or the government assisting these people permanently. Both of these outcomes will lead to perdition. No income means misery, disease and eventually a lot of people dying. Money printing is sadly no solution either. Once money is printed on a larger scale, the currency will be totally debased, become worthless with hyperinflation to follow. Just look at Venezuela with a major part of the population struggling to survive.
THERE IS NO SOLUTION
This is what is so sad with the current economic crisis – there is no solution. Nobody should believe that it is the Coronavirus that has caused this catastrophe for the world. CV was the catalyst but the underlying problems have been there for a long time. The Great Financial Crisis in 2006-9 was temporarily patched up with trillions of money printing but it was never solved. The GFC was only a rehearsal and now the world is facing the inevitable collapse of the financial system.
CENTRAL BANKS PANICKED IN AUTUMN OF 2019
That there was something rotten in the Kingdom of Denmark the World became crystal clear in the late summer and early autumn of 2019. The ECB then made it clear for a second time that they will do whatever it takes. And then the Fed started with daily and weekly Repos of $100s of millions. We have never been told the reason for these Central Banks’ panic actions but it is totally clear that the financial system is crumbling under the burden of massive debts and derivatives.
And then in February-March this year the most horrible catalyst in the form of a pandemic hit a fragile world economy at the worst possible moment. In my opinion, the world economy, lumbered with debts and deficits, would have crashed without the Coronavirus. But CV makes the problem much bigger and will cause the economic collapse to happen much faster.
What central banks around the world are doing will not make one iota difference when it comes to saving the world economy. You cannot solve a debt problem with more debt. The bankers have managed for some time to fool the world that creating money out of thin air can create wealth. But the world will very soon realize that it can’t. Global debt has more than doubled since the last crisis started. It was $125 trillion in 2006 and now global debt is over $270 trillion. With the current money printing that figure will soon be over $300T and later increase by $100s of trillions.
MISPLACED IRRATIONAL EXUBERANCE
It is totally incomprehensible that stock market investors have for 7 weeks been buying the dip in the light of the world collapsing around them. They seem to be totally oblivious to the world economy. Instead they are just focusing on the injection of liquidity in the form of worthless money. These investors seem to believe that finance stands above everything else and is totally detached from what is happening in the real world.
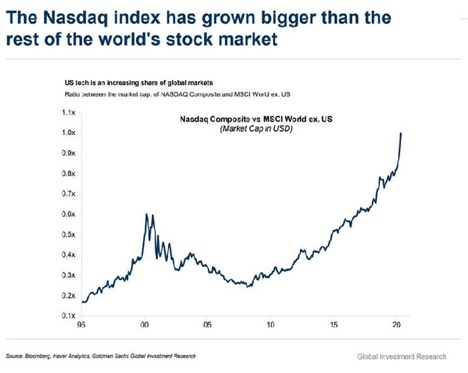
It seems that these investors believe there is only one important sector in the economy which is finance and money printing. The worse the economy turns, the more money is printed and stock market investors love it. This is why the Nasdaq Composite has just made a new high for the year. This is just unreal. The world economy is totally paralyzed but who cares when you have money printers who can just create trillions out of thin air.
|
|
|
|
And who cares about companies making profits when central banks can create all the money the world needs. So, it is really fortunate for investors that the money business is booming and causing all this euphoria in stock markets. To make money in the stock market you don’t need companies producing goods. All you need is a friendly central banker who keeps on printing. Or at least until now!
YOU CAN’T AVOID THE FINAL COLLAPSE
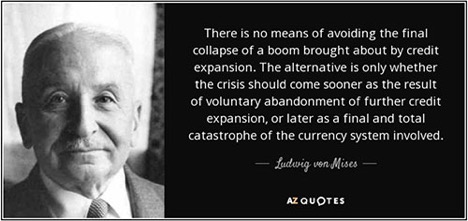
What these investors don’t realize is that “there is no means of avoiding the final collapse of a boom brought about by credit expansion”. This is what the wise Austrian economist von Mises said. I urge you to read his words below:
|
|
|
|
Central banks and governments are now printing more money which makes it clear that we won’t see a voluntary abandonment of credit expansion
Instead, the world is now in the final stage of credit expansion which will lead to hyperinflation and “total catastrophe of the currency system involved.”
Sadly, this is totally unavoidable.
So, what is going to be the likely effect on markets in the coming weeks and months:
MARKETS
The irrational exuberance in stocks is soon coming to an end. It could end next week or last another couple of weeks. But whenever it comes, the next fall will come as a shock for investors and be at least as bad as the initial fall. Long term we are looking at
stocks collapsing more than 95% in real terms.
GOLD AT $20,000
Let’s just look at the
Dow/Gold ratio
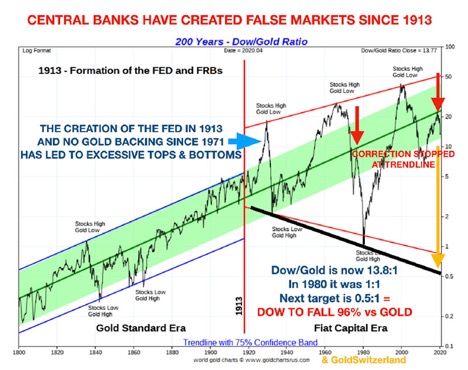
which topped in 1999 at 45 and is now 13.7. This ratio has been in a correction up since 2011 but has now resumed the downtrend. This correction is very similar to the correction in the 1970s. See the red arrows below in the graph.
|
|
|
|
What makes this 200-year chart so fascinating is the amplitude of the moves. Since the creation of the Fed in 1913 and the closing of the gold windows by most countries (the US being the last in 1971), the chart is showing major swings and tops and bottoms are much more exaggerated than before 1913. This is caused by the constant interference of central banks and their manipulation of markets. There are no real markets today. Prices are set in a casino that has little resemblance with reality. The credit expansion and fake money has led to fake prices in virtually all instruments. If you don’t believe that, just wait to see what will happen next in markets.
As the Dow/Gold chart shows above, the next target in the ratio is likely to be 0.5:1 or lower. In 1980 it was 1:1 (Dow 850 and Gold $850). The trend line is now at 0.5 which means that
the Dow is likely to fall by at least 96% vs gold in the next few years
. In my view, it could even overshoot and go a lot lower.
But even if the Dow only fell to say 10,000, at a Dow/Gold ratio of 0.5, that would mean
a gold price of $20,000which I believe is very probable, even without high inflation.
SILVER AT $1,666
E
ven more interesting is Dow/Silver Ratio
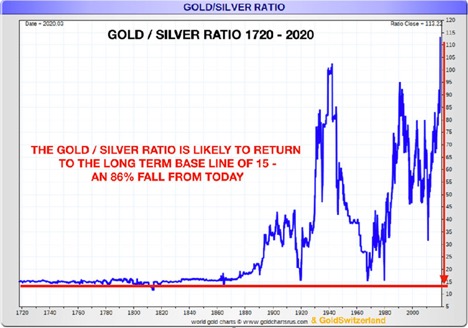
. The Gold/Silver ratio is now over 100 but is in the next few years likely to return below the long-term average of 15.
|
|
|
|
If we then look at the
Dow / Silver ratio
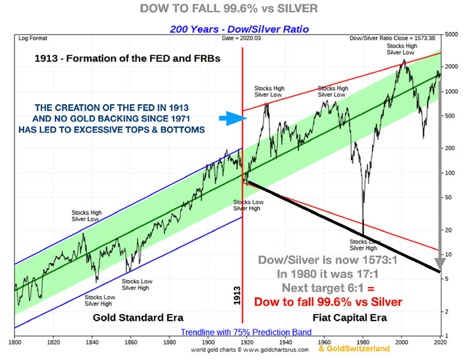
this shows how traditional investments will totally collapse against hard assets and especially against silver which is dramatically undervalued. The chart below shows what a major move we are likely to see. This ratio is now at 1573. In 1980 it was at 17:1. If it falls to the long-term trend line it could reach 6.
That is a 99.6% fall of the Dow vs Silver in the next few years
. That is both spectacular or devastating depending on which side you take. So silver is likely to outperform most investments in the next few years and lead to enormous gains. But we must remember that silver is incredibly volatile and not for widows and orphans. We recommend to our investors to hold 20-25% silver and 75-80% gold in order to sleep well at night.
|
|
|
|
Let’s say that the Dow declines to 10,000 in the next few years. With a Dow/Silver ratio of 6, that would mean
a silver price of $1,666
. Certainly not impossible.
Normally the real moves in the metals are always led by silver. The gold/silver ratio has come down from 126 in mid-March to 110 today and looks like it is about to fall more strongly very soon. Silver is now going up slightly faster than gold which is what we want to see when the uptrend in the metals resume.
So, I expect a major move up in gold and silver to be imminent. But as I keep warning investors, you are not holding metals for gains measured in worthless paper money but for financial survival and for protection of your wealth against a collapsing financial system.
Founder and Managing Partner
Matterhorn Asset Management
Zurich, Switzerland
|
|
Private Safe Deposit Boxes
|
|
Unencumbered / Segregated Storage
|
|
About Miles Franklin
Miles Franklin was founded in January, 1990 by David MILES Schectman. David's son, Andy Schectman, our CEO, joined Miles Franklin in 1991. Miles Franklin's primary focus from 1990 through 1998 was the Swiss Annuity and we were one of the two top firms in the industry. In November, 2000, we decided to de-emphasize our focus on off-shore investing and moved primarily into gold and silver, which we felt were about to enter into a long-term bull market cycle. Our timing and our new direction proved to be the right thing to do.
We are rated A+ by the BBB with zero complaints on our record. We are recommended by many prominent newsletter writers including Doug Casey, Jim Sinclair, David Morgan, Future Money Trends and the SGT Report.
For your protection, regardless of where you live, we are licensed, regulated, bonded and background checked per Minnesota State law.
|
|
Miles Franklin
801 Twelve Oaks Center Drive
Suite 834
Wayzata, MN 55391
1-800-822-8080
|
|
Copyright © 2020. All Rights Reserved.
|
|
|
|
|
|
|