The-Lead-Left-logo-with-PC_Newsletter image

PDF | Research | Week of July 22 2024

Quote of the Week

“The thing that really worries us is the level of valuations.”

– Roger Aliaga-Diaz, global head of portfolio construction and chief Americas economist, Vanguard.


Lead Left Vodcast

Fast and Furious (Second of Two Parts)

🔔 Subscribe to our YouTube channel: click here

Watch Now

CLO Awakening (Second of Two Parts)

guillaume-perigois-0NRkVddA2fw-unsplash-scaled image

As the leveraged loan market woke up this past January, as confidence in the economy and rate expectations grew, so the CLO market has rebounded. Not just in the US, as we detailed last week, but in Europe as well. 


Our friends at Creditflux highlighted this phenomenon, quoting one leading manager as saying: “Given the number of CLO issuances year to date, we see 2024 breaking records for gross new issue volumes in Europe.” 


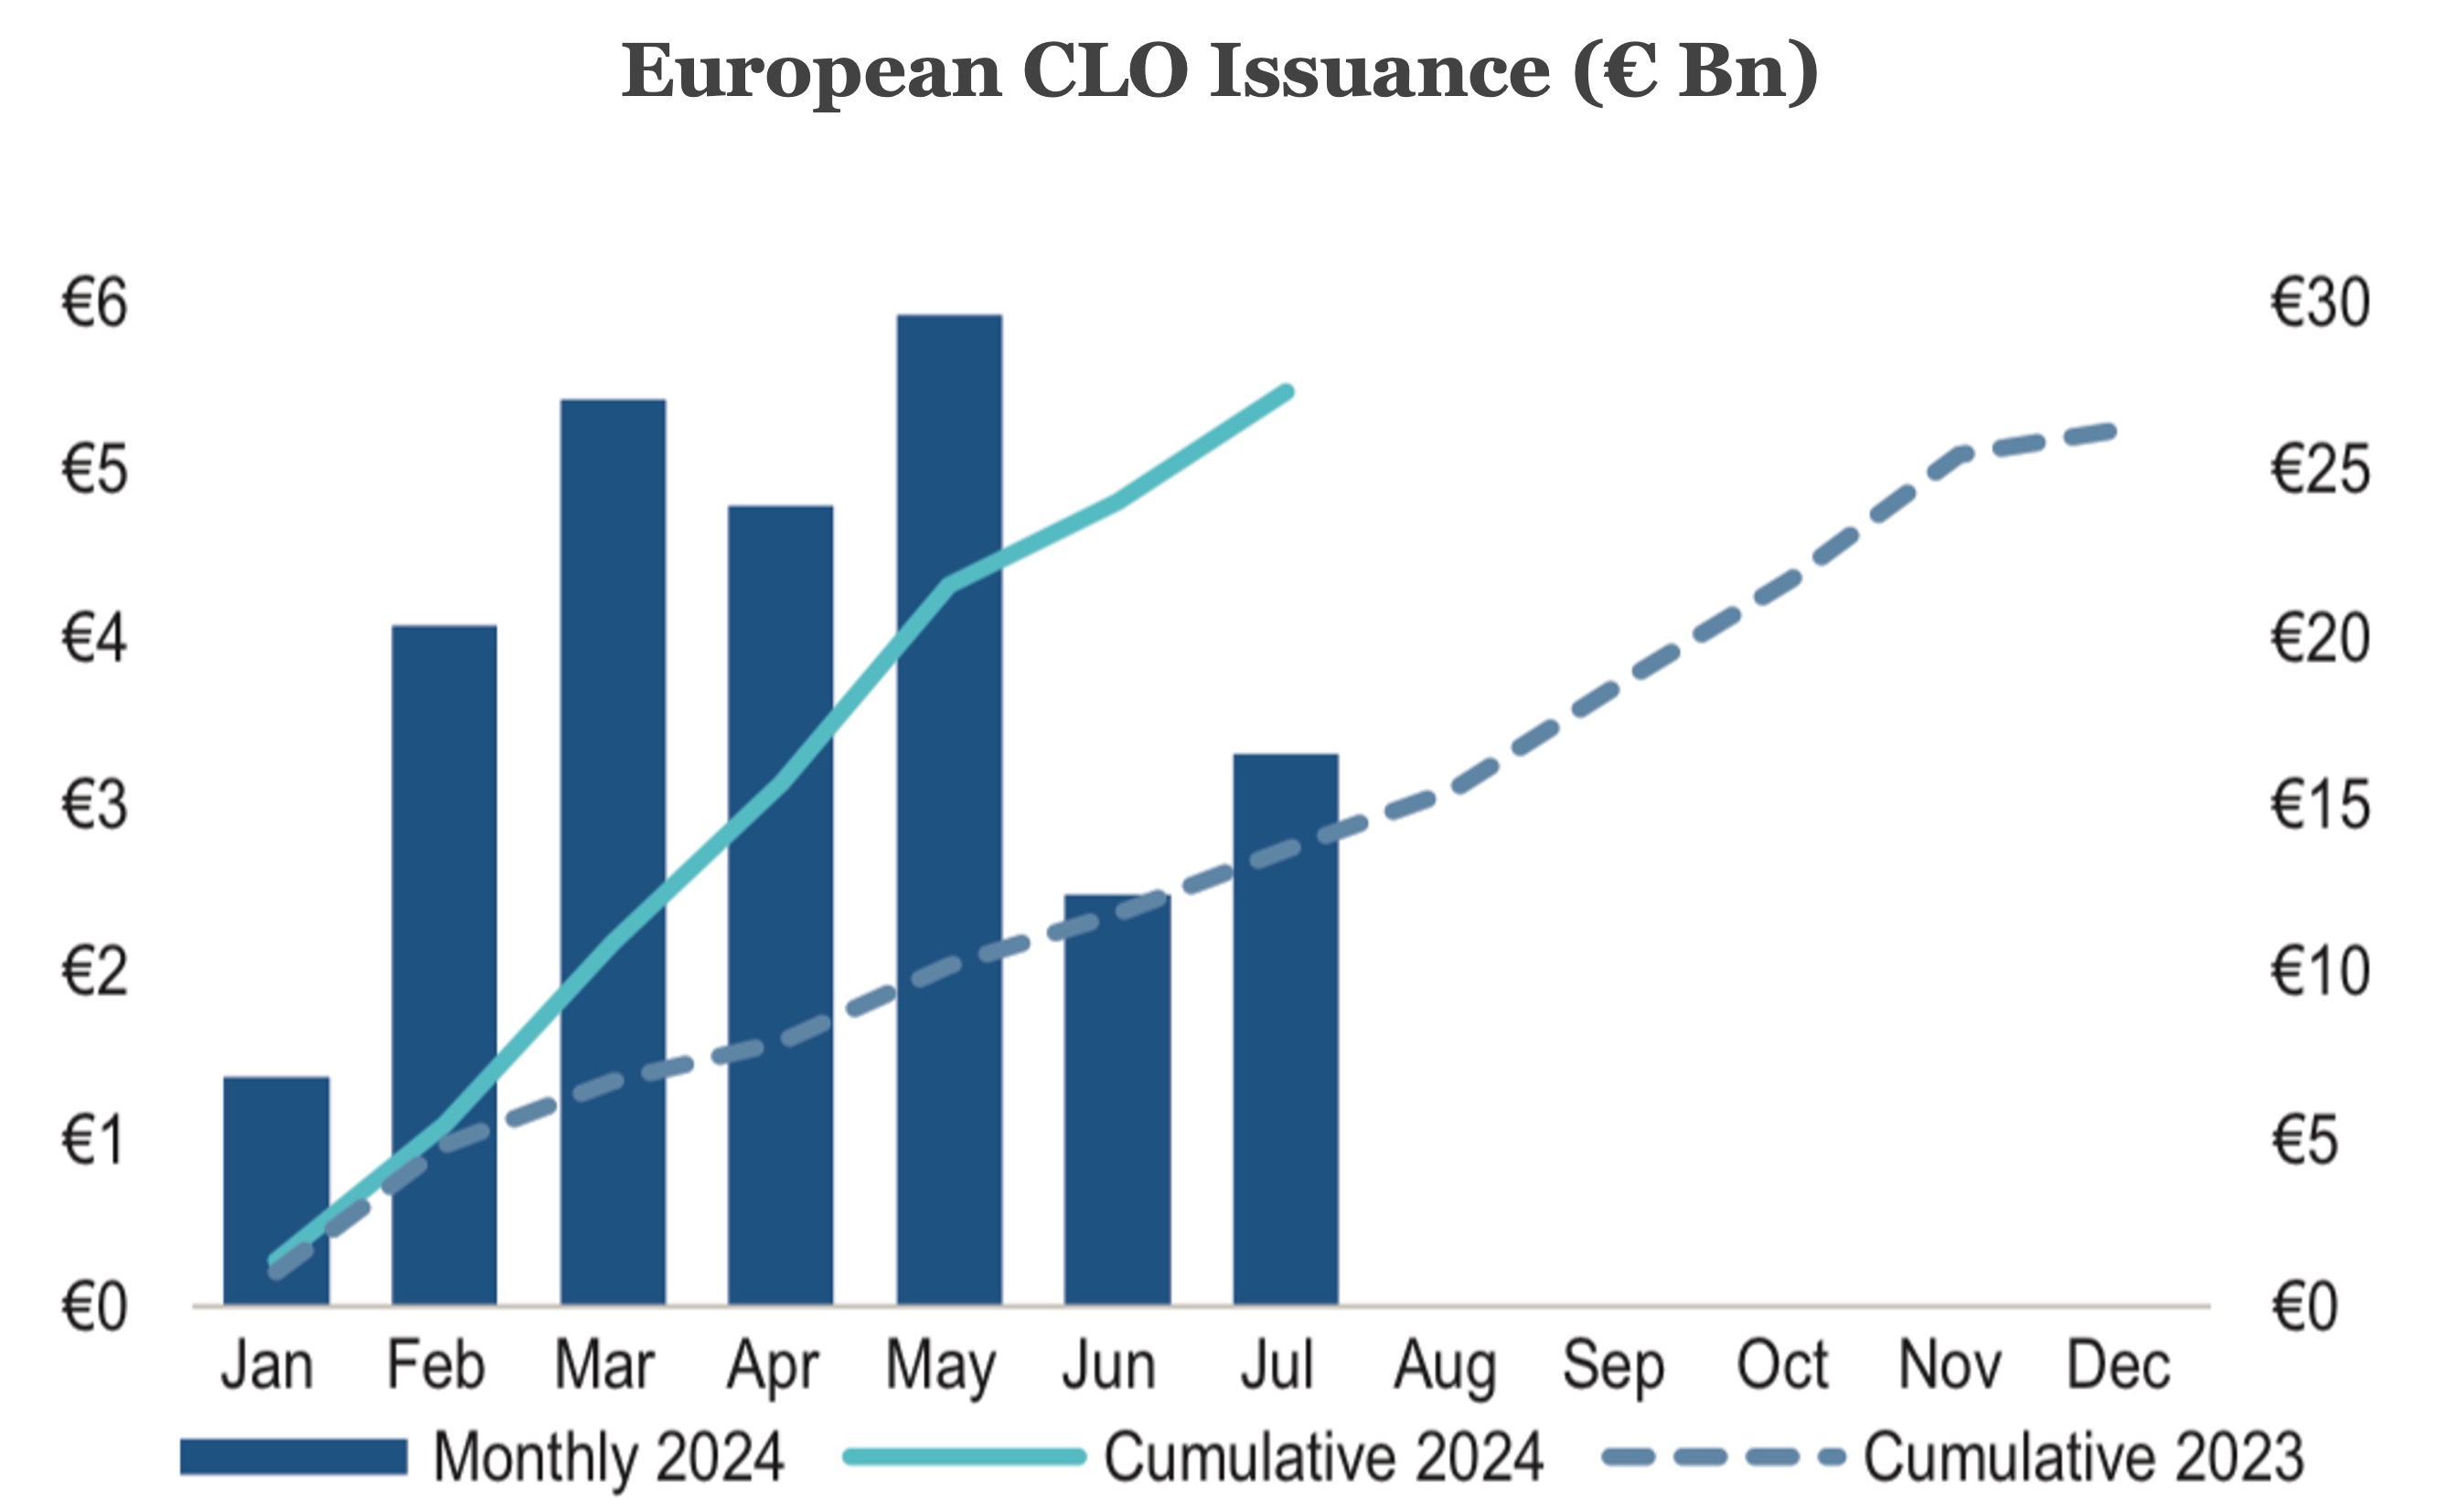
As our Chart of the Week shows, European issuance year-to-date totals about €27 billion 2024, almost double 2023’s €15 billion of activity, per PitchBook LCD. Contrast that with US issuance of about $115 billion and $60 billion, respectively for this year and last year.


From a pricing perspective, both US and Europe have seen the cost of triple-A liabilities come down in the same way loan spreads have compressed. Recent European vehicles have been issued at their tights slightly below 130 bps with their US counterparts a bit above that...


Read More

Chart of the Week

Euro Stars

New CLO issuance in Europe this year is outpacing 2023 by a wide margin.

CTW-0722 image

Source: Pitchbook | LCD


(Past performance is no guarantee of future results.)

Lead with Your Left

 
30-DAY FREE MEMBERSHIP


Join the leading voice of the middle market. Try us free for 30 days.
Learn More
 

Loan Stats at a Glance 

PitchbookLCD-Logo-for-newsletter image
LCD-0722 image

Contact: Ryan Brown / PitchBook LCD

PDI Picks

Fundraising revival on hold 

PDI-0722 image

There were some signs of improvement in the second quarter, but raising new private debt capital was still a struggle in the first six months of 2024. 

The first half of 2024 did not offer much consolation to those awaiting clear signs of a private debt fundraising revival. Private Debt Investor’s provisional data for H1 records $108.5 billion of capital raised – down on the $114.1 billion total in the first half of last year, and a significant decline on the $143.3 billion total in the first half of the peak fundraising year of 2021 (see chart)...

Read More

Leveraged Loan Insight & Analysis

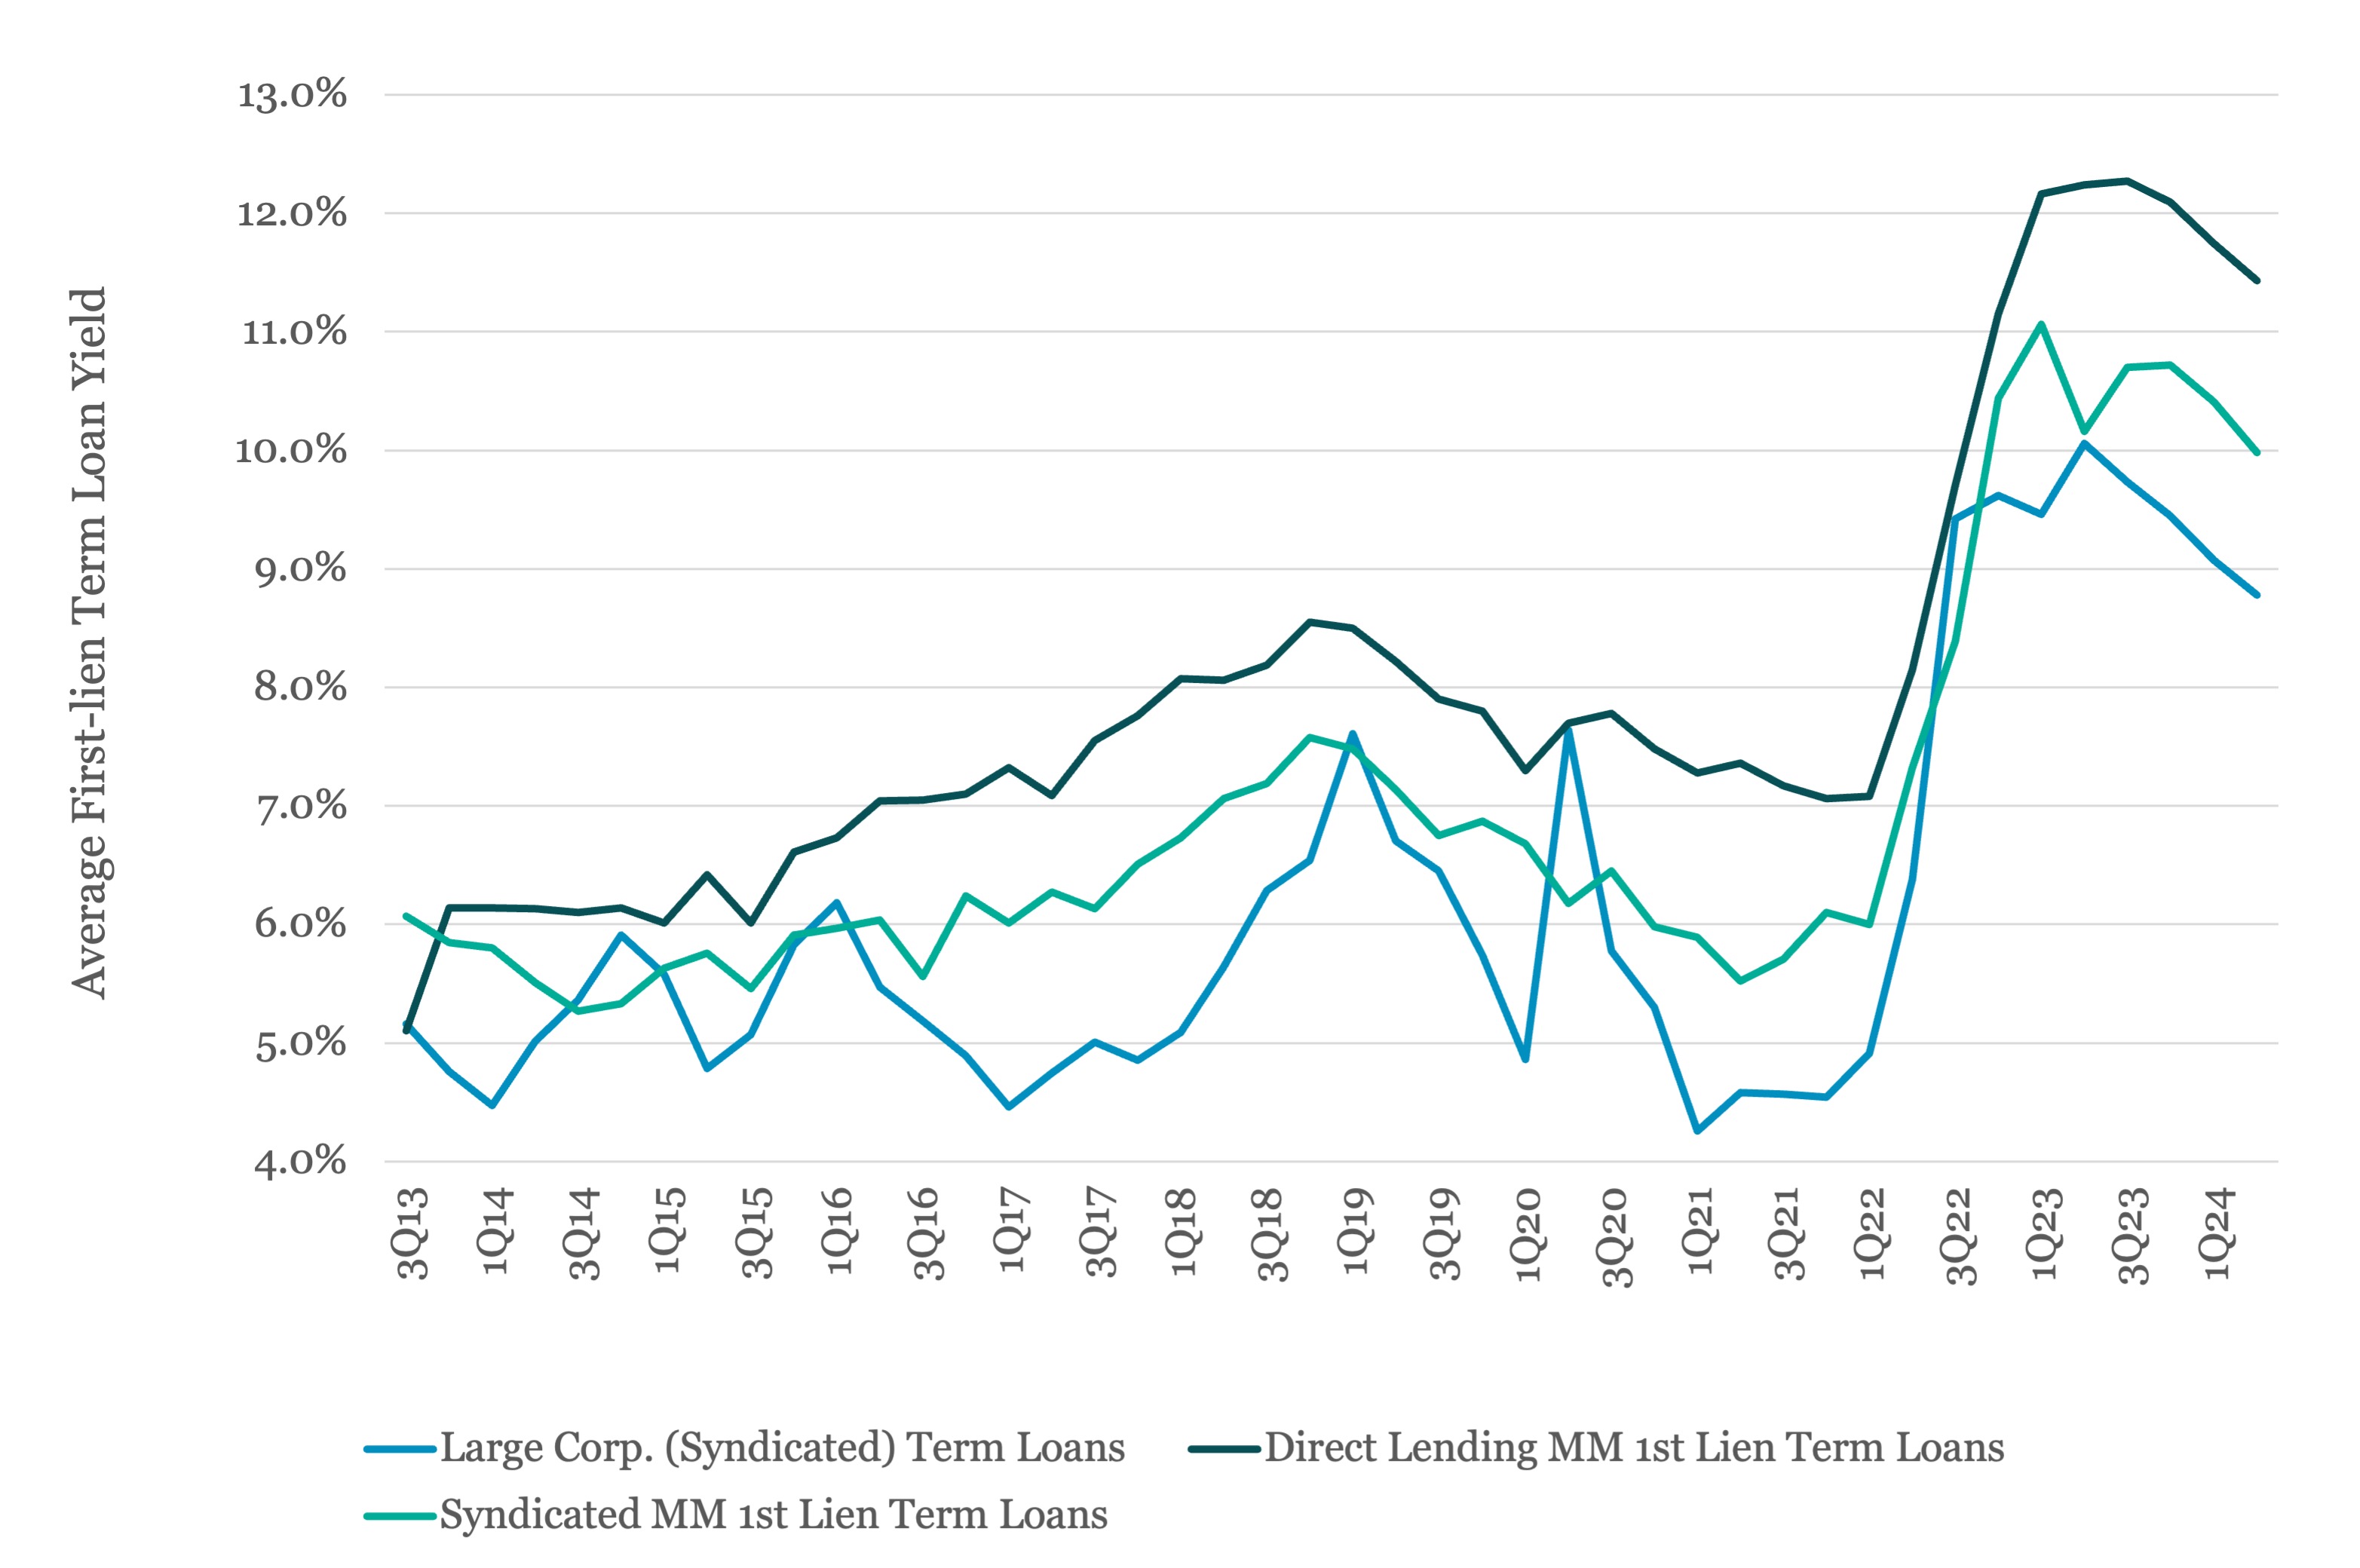
Premium for MM direct lending loan yields over large corporate credits averaged 265bp in 2Q24

LSEG-0722 image

Pricing tightened across all market segments in 2Q23 as demand for assets outpaced supply. This enabled borrowers to obtain more attractive pricing on new credits and refinance existing debt...

Read More

Contact: CJ Doherty / LSEG

The Pulse of Private Equity

PE exit/investment ratio

PB-0722 image

GPs need to address the oncoming maturity wall of their existing investments, and many are turning to continuation funds to extend exit timelines or secure liquidity without forced selling...

Read More & Download Report

Contact: Garrett Black / PitchBook

KBRA Direct Lending Deals: News & Analysis

DLD-Logo image

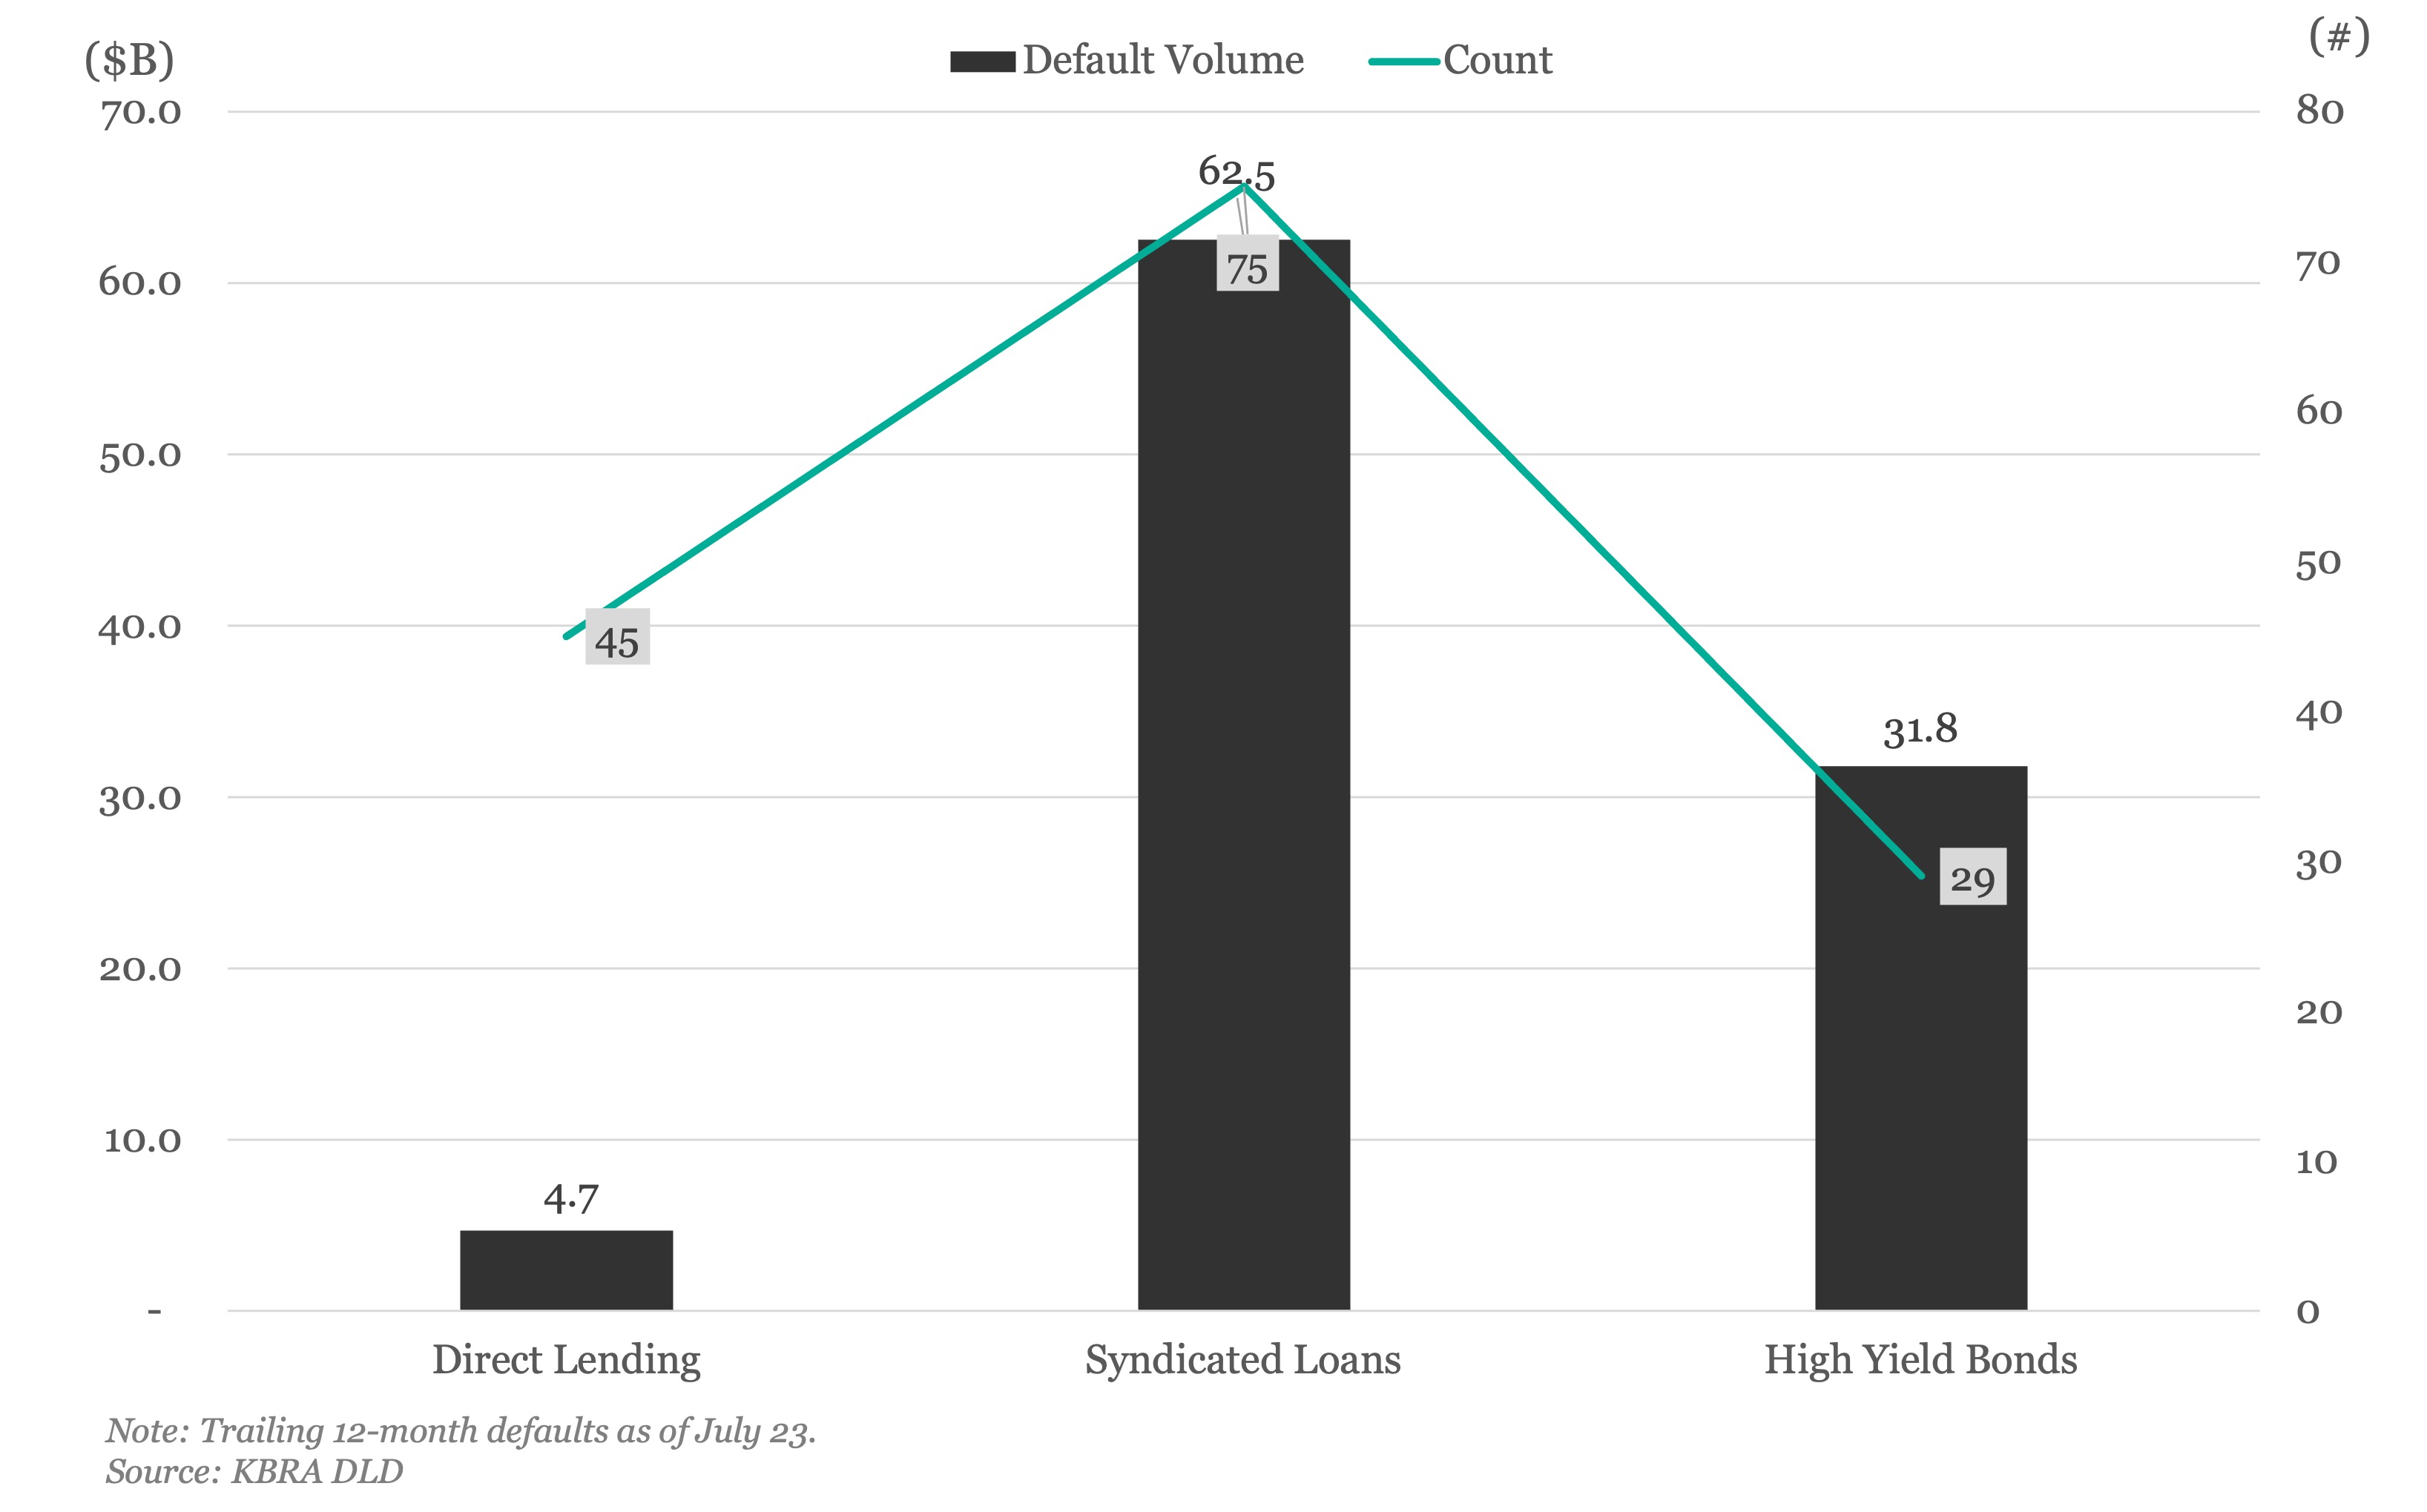
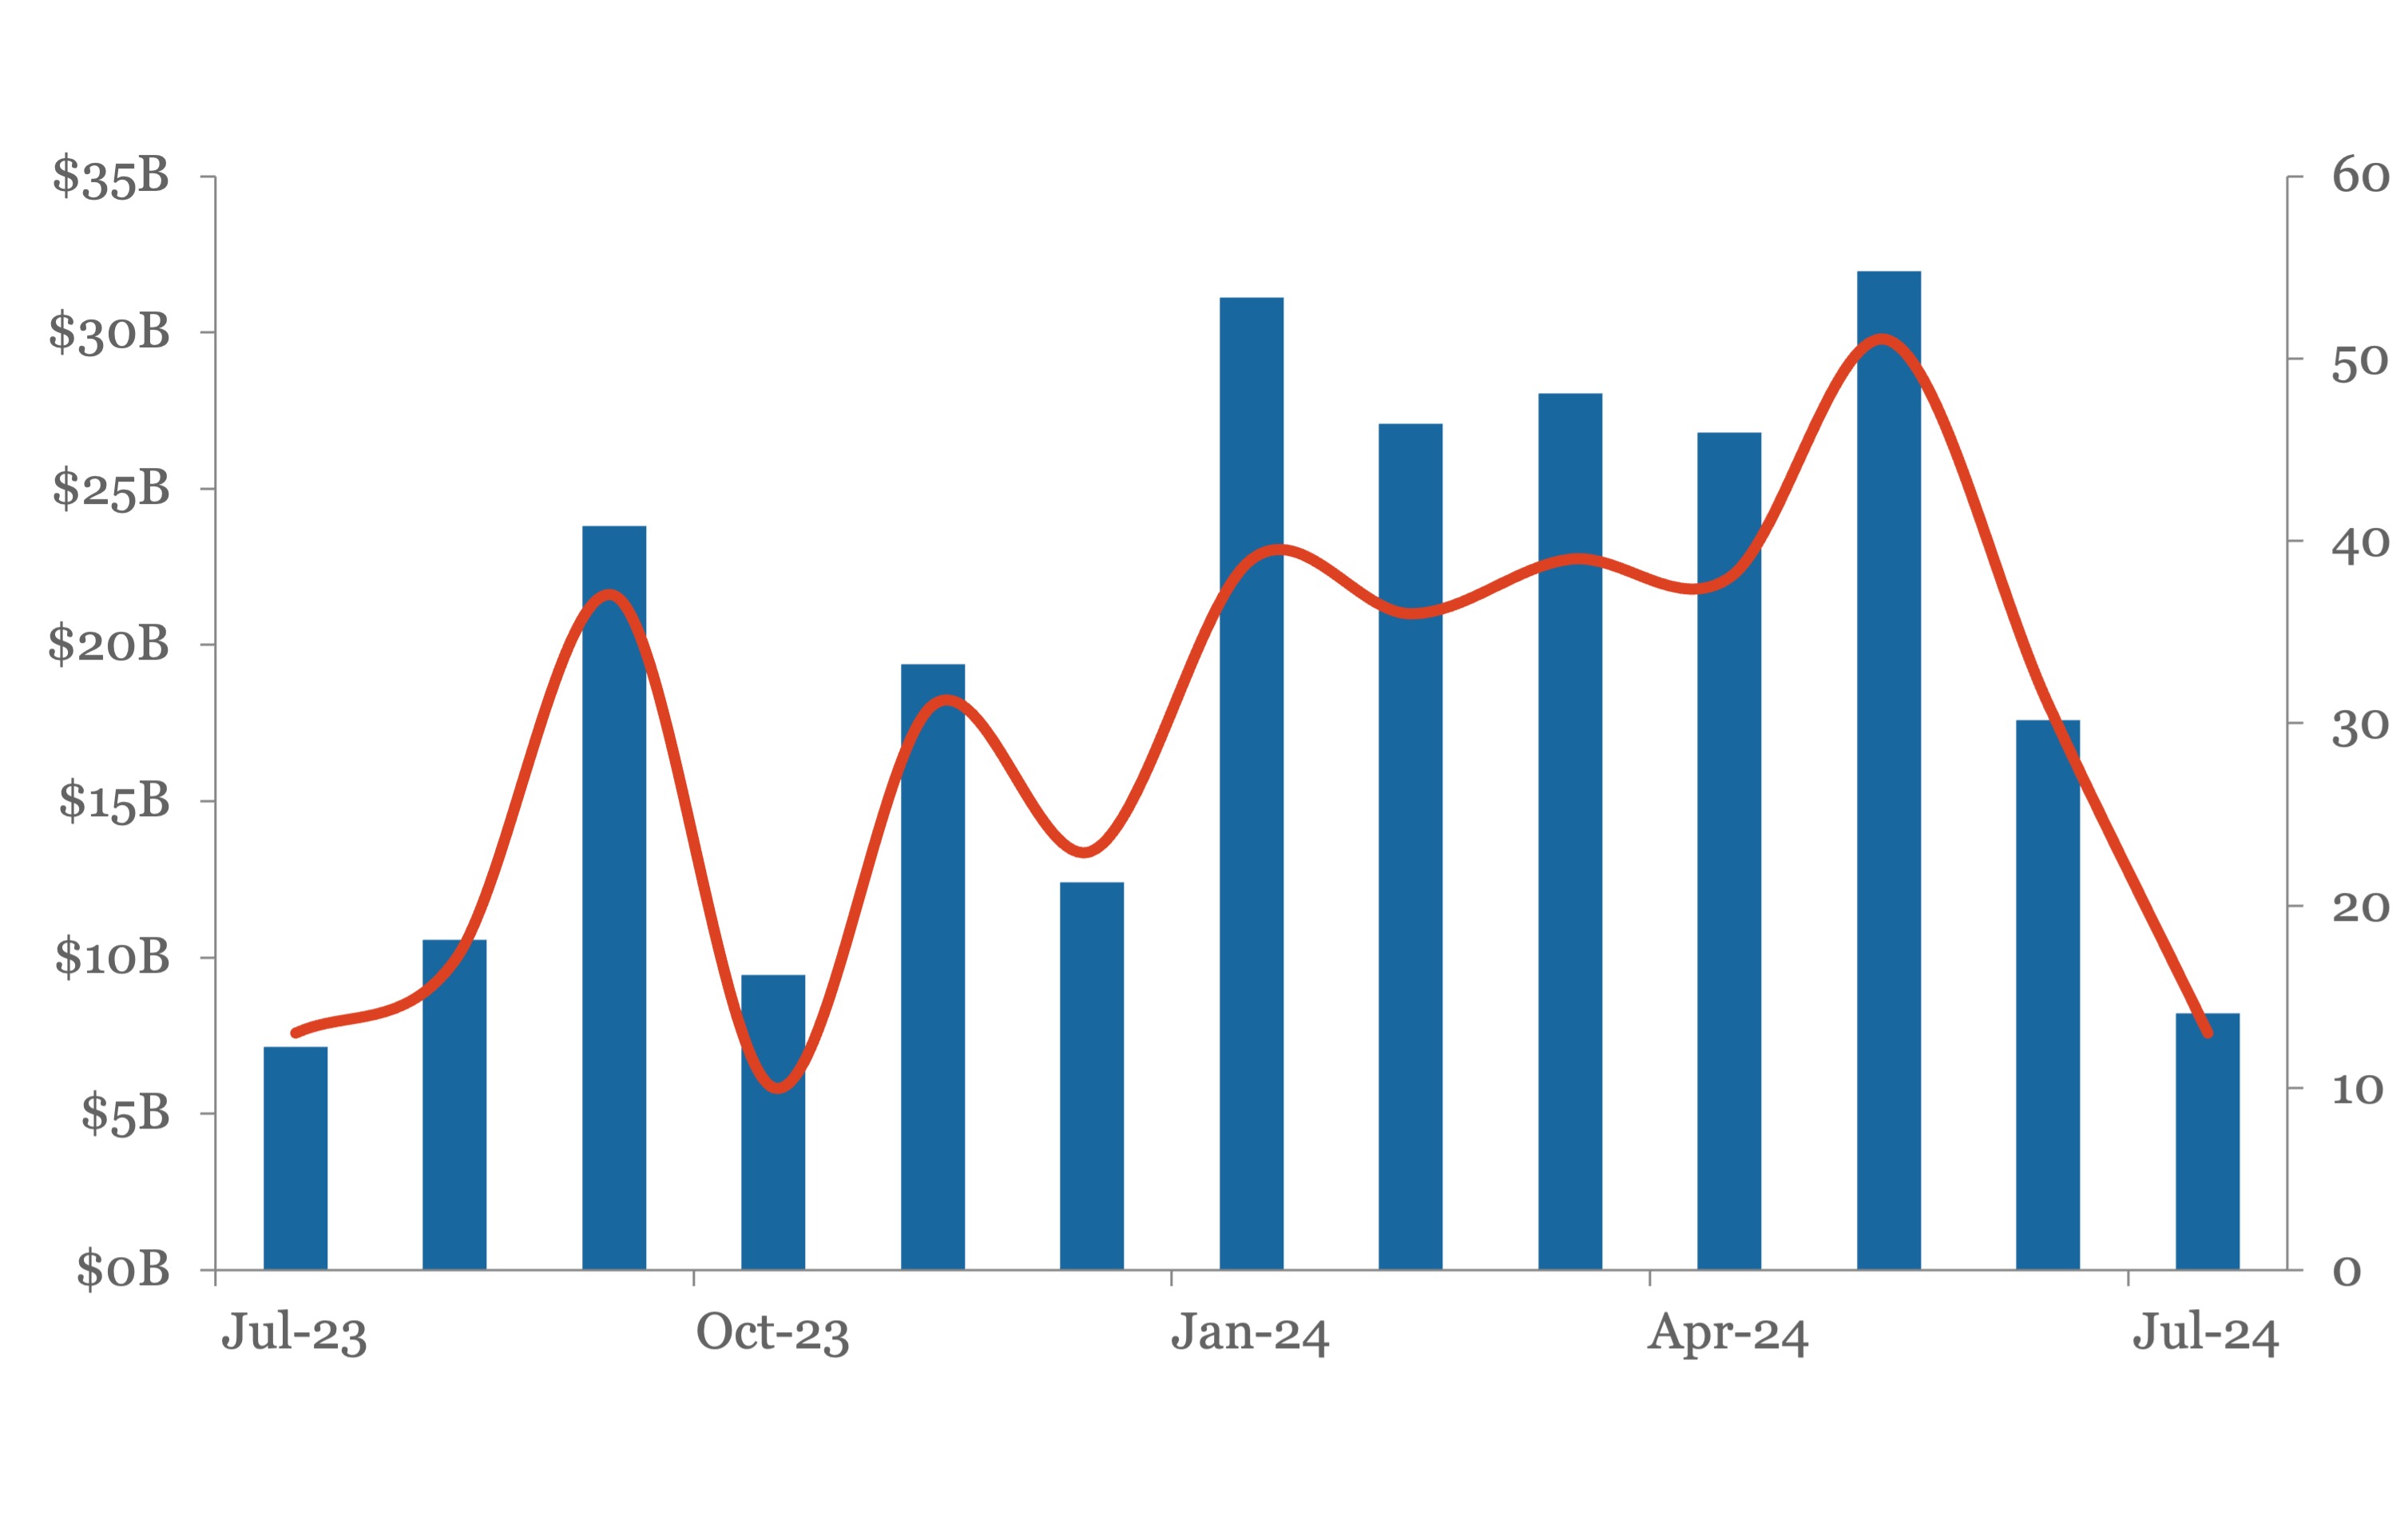
TTM Default Volume, Count

KBRA-0722 image

Contact: Eric Rosenthal / KBRA DLD

Middle Market & Private Credit

Fitchratings-for-newsletters image

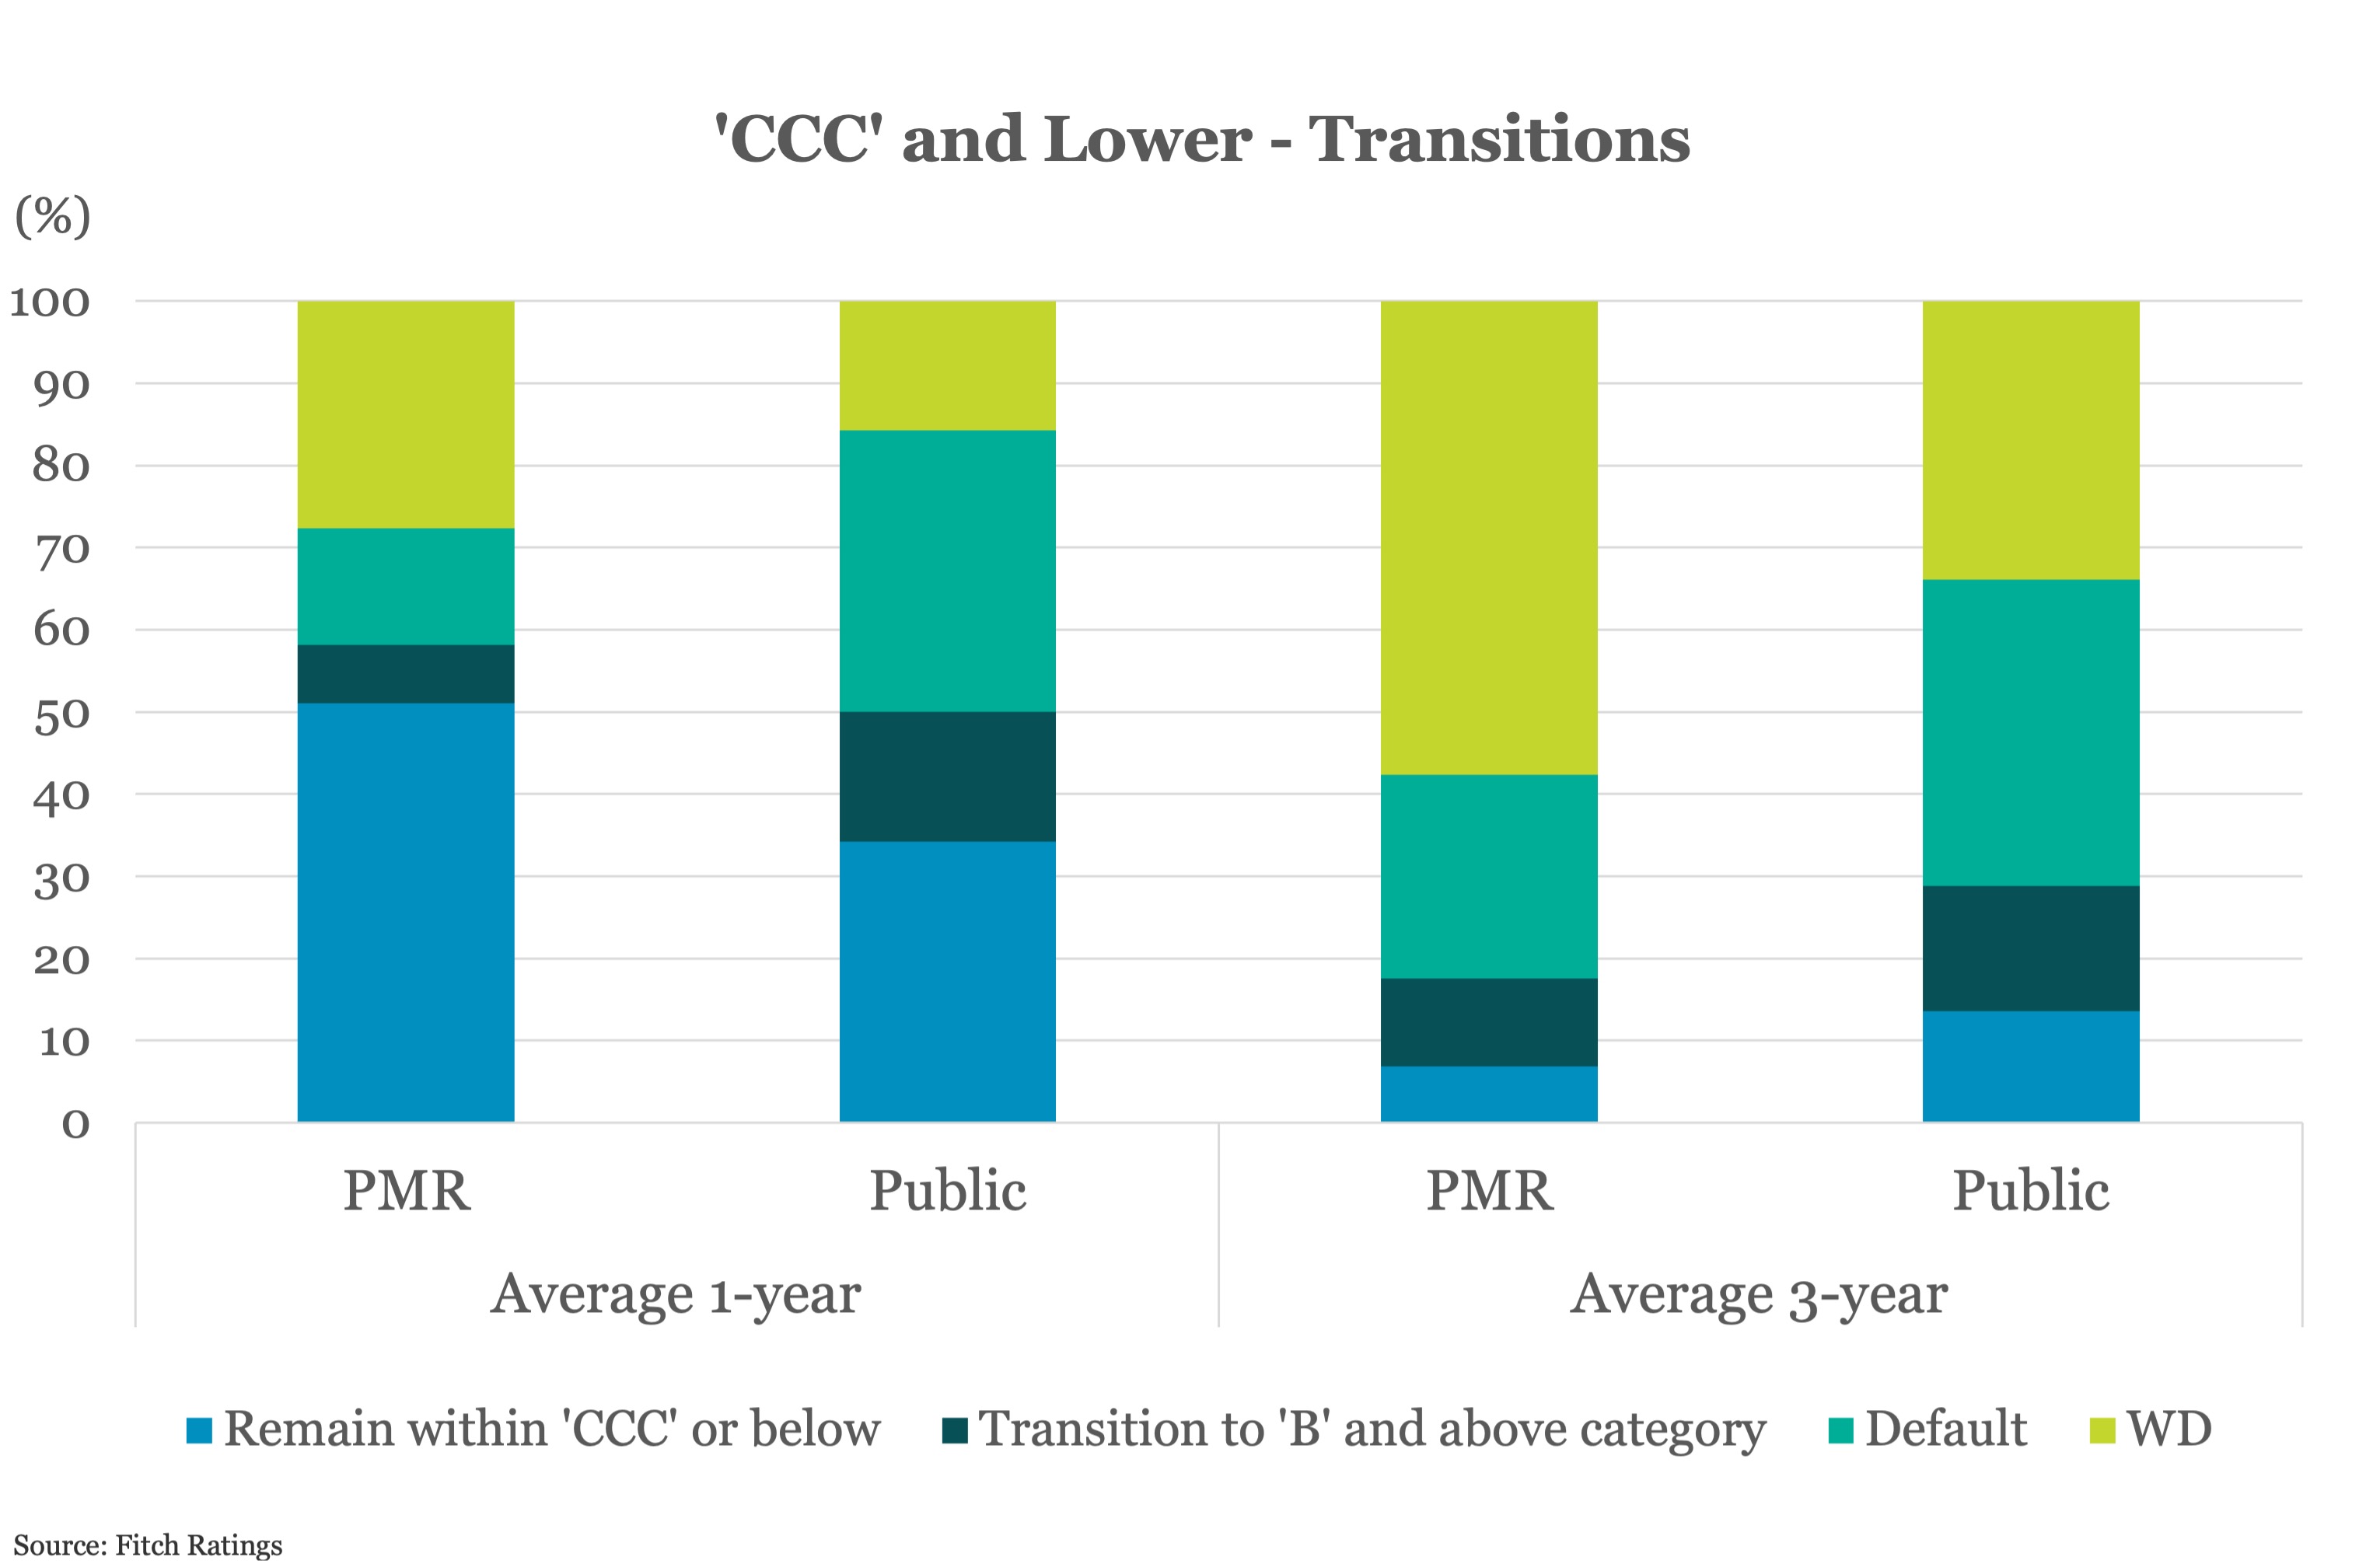
Fewer PMR ‘CCC’s Reach the ‘B’ Category

FR-0722 image

Learn More


Once in the ‘CCC’ category, fewer issuers in the PMR portfolio ascend to the ‘B’ category than public peers. The AAT% of ‘CCC’ category issuers that reach the ‘B’ category is just 11% in the PMR portfolio compared to 18% for Fitch’s public rating portfolio...

Read More

Contact: Brad Hamner / FitchRatings

Covenant Trends 

Synergies & Cost Savings EBITDA Addbacks

CR-0722-1 image
Download Data

Contact: Steven Miller / Covenant Review

High-Yield Bond Statistics

Launched Volume

LFI-0722-1 image

New-issue Yields

LFI-0722-2 image

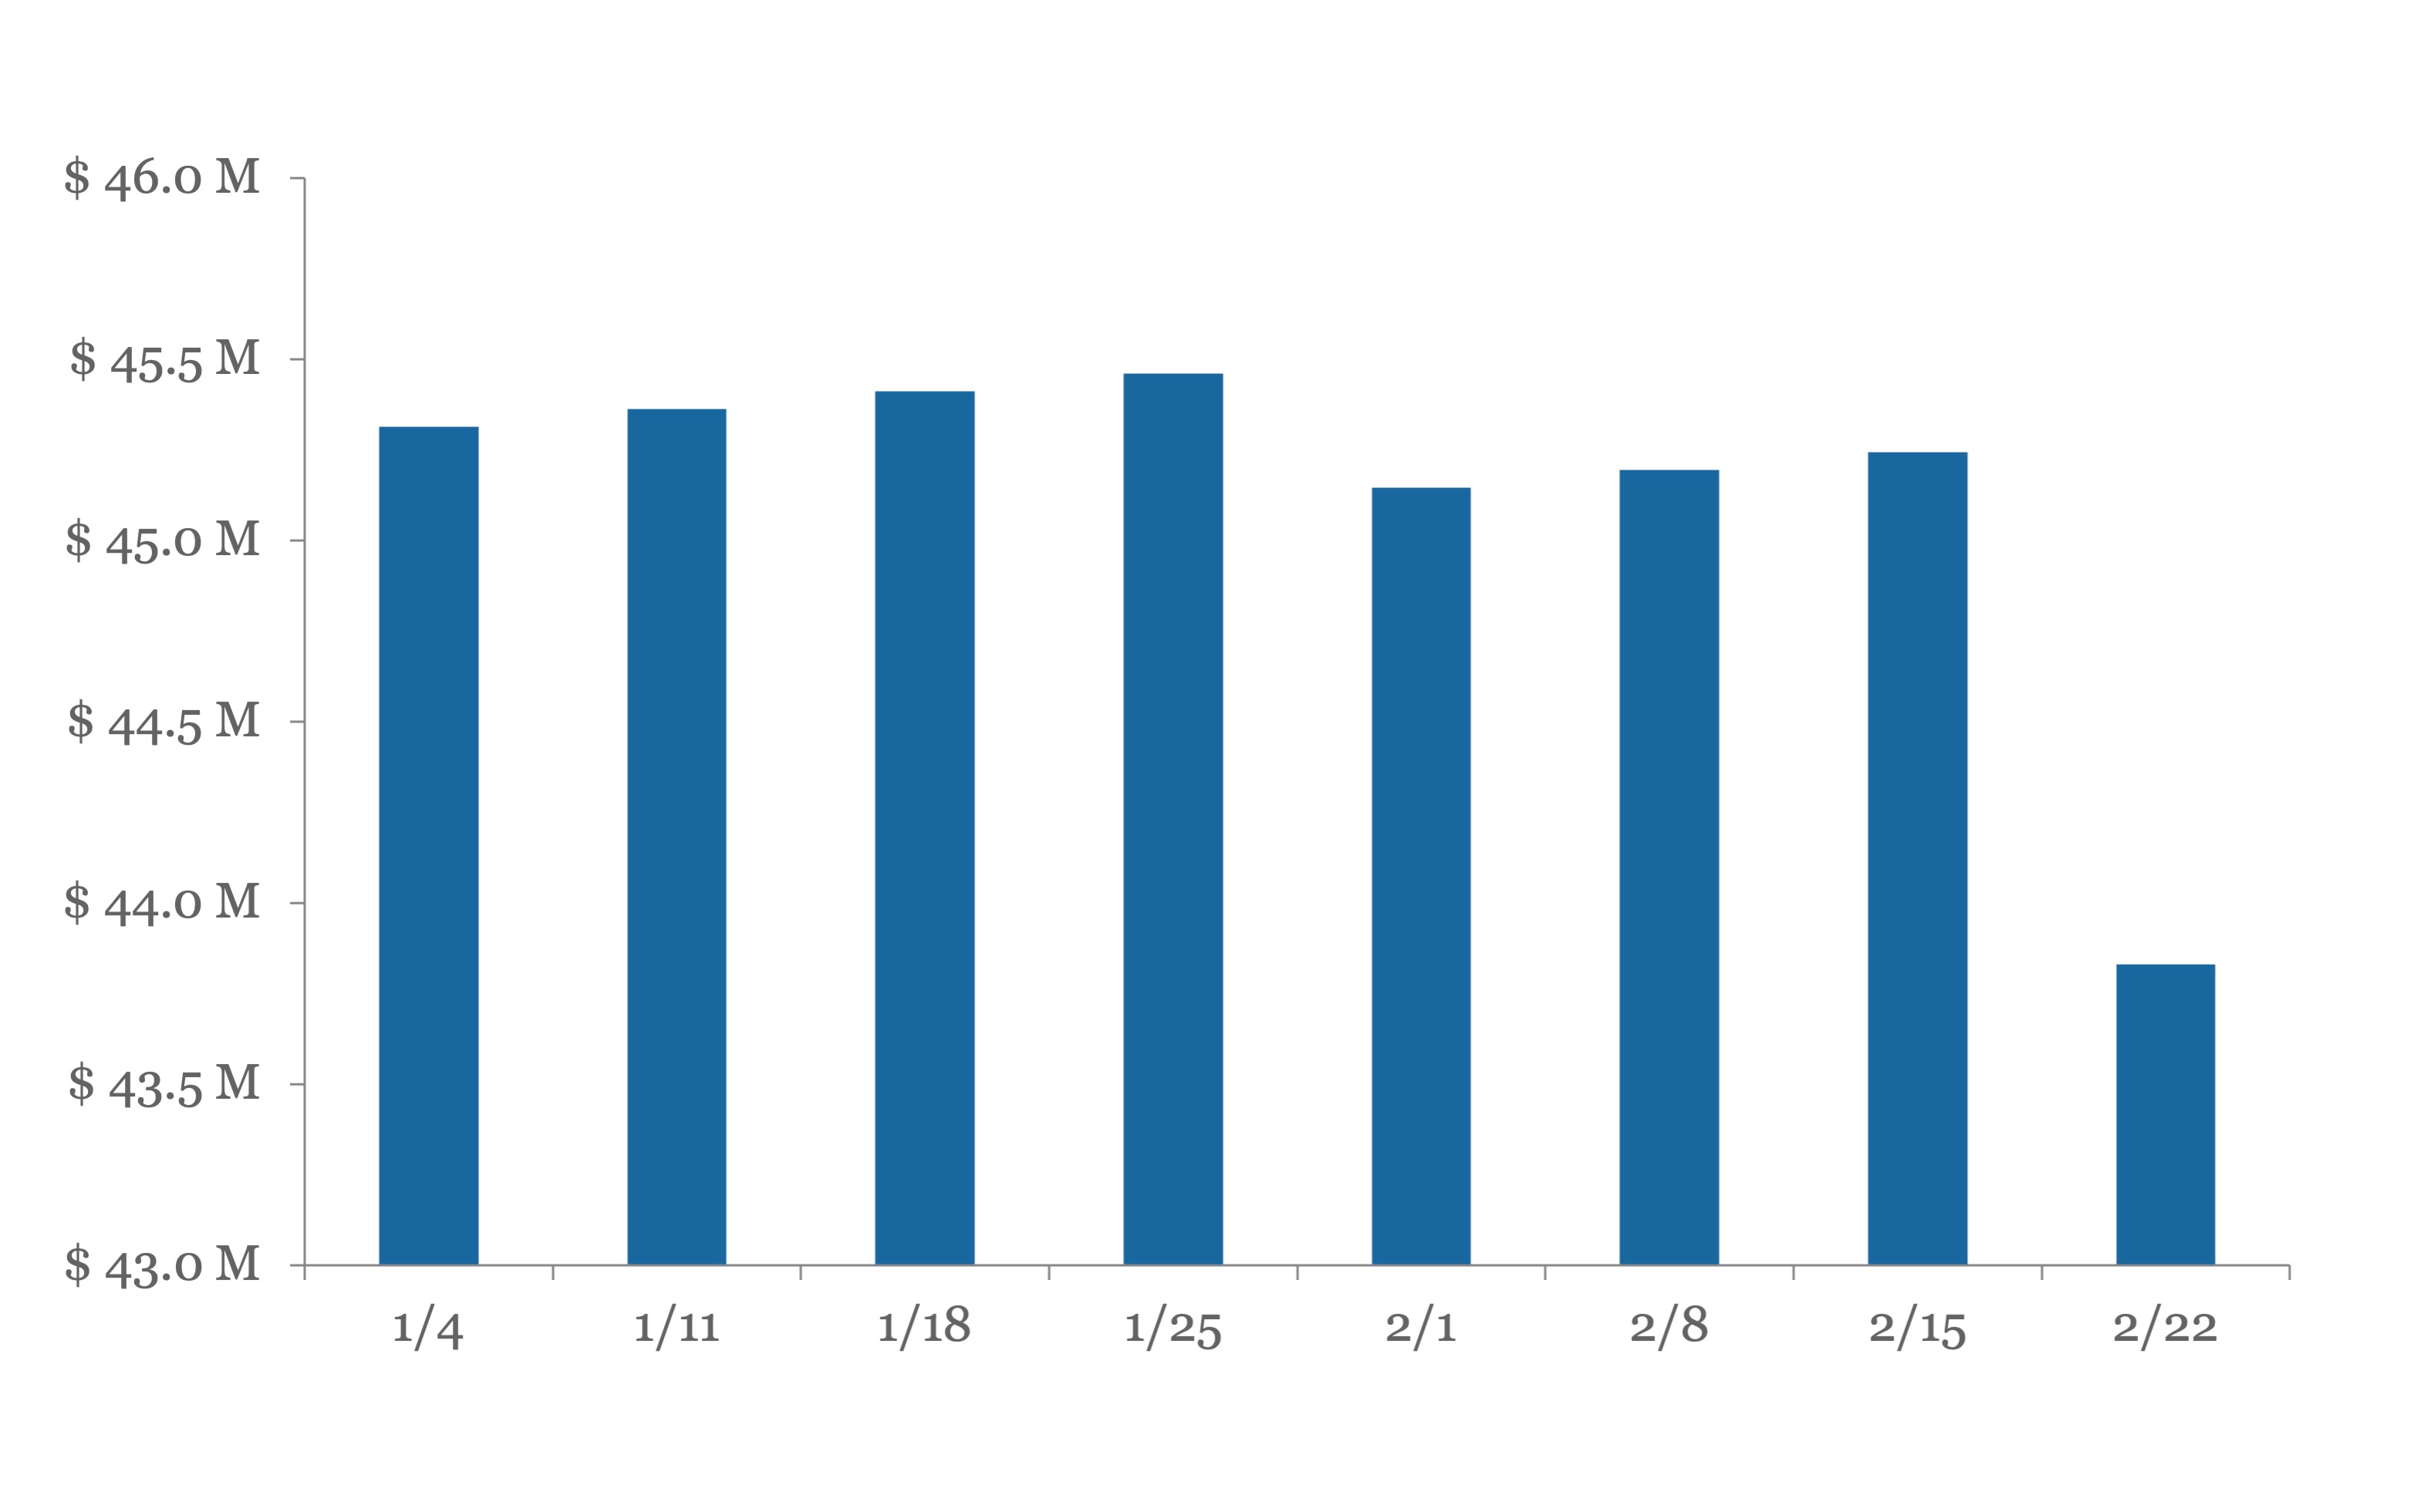
Weekly Fund Flows

LFI-0722-3 image

Weekly fund flows source: Lipper

Download Data

Contact: Robert Polenberg / LevFin Insights

Debtwire Middle-Market

DW-0722 image

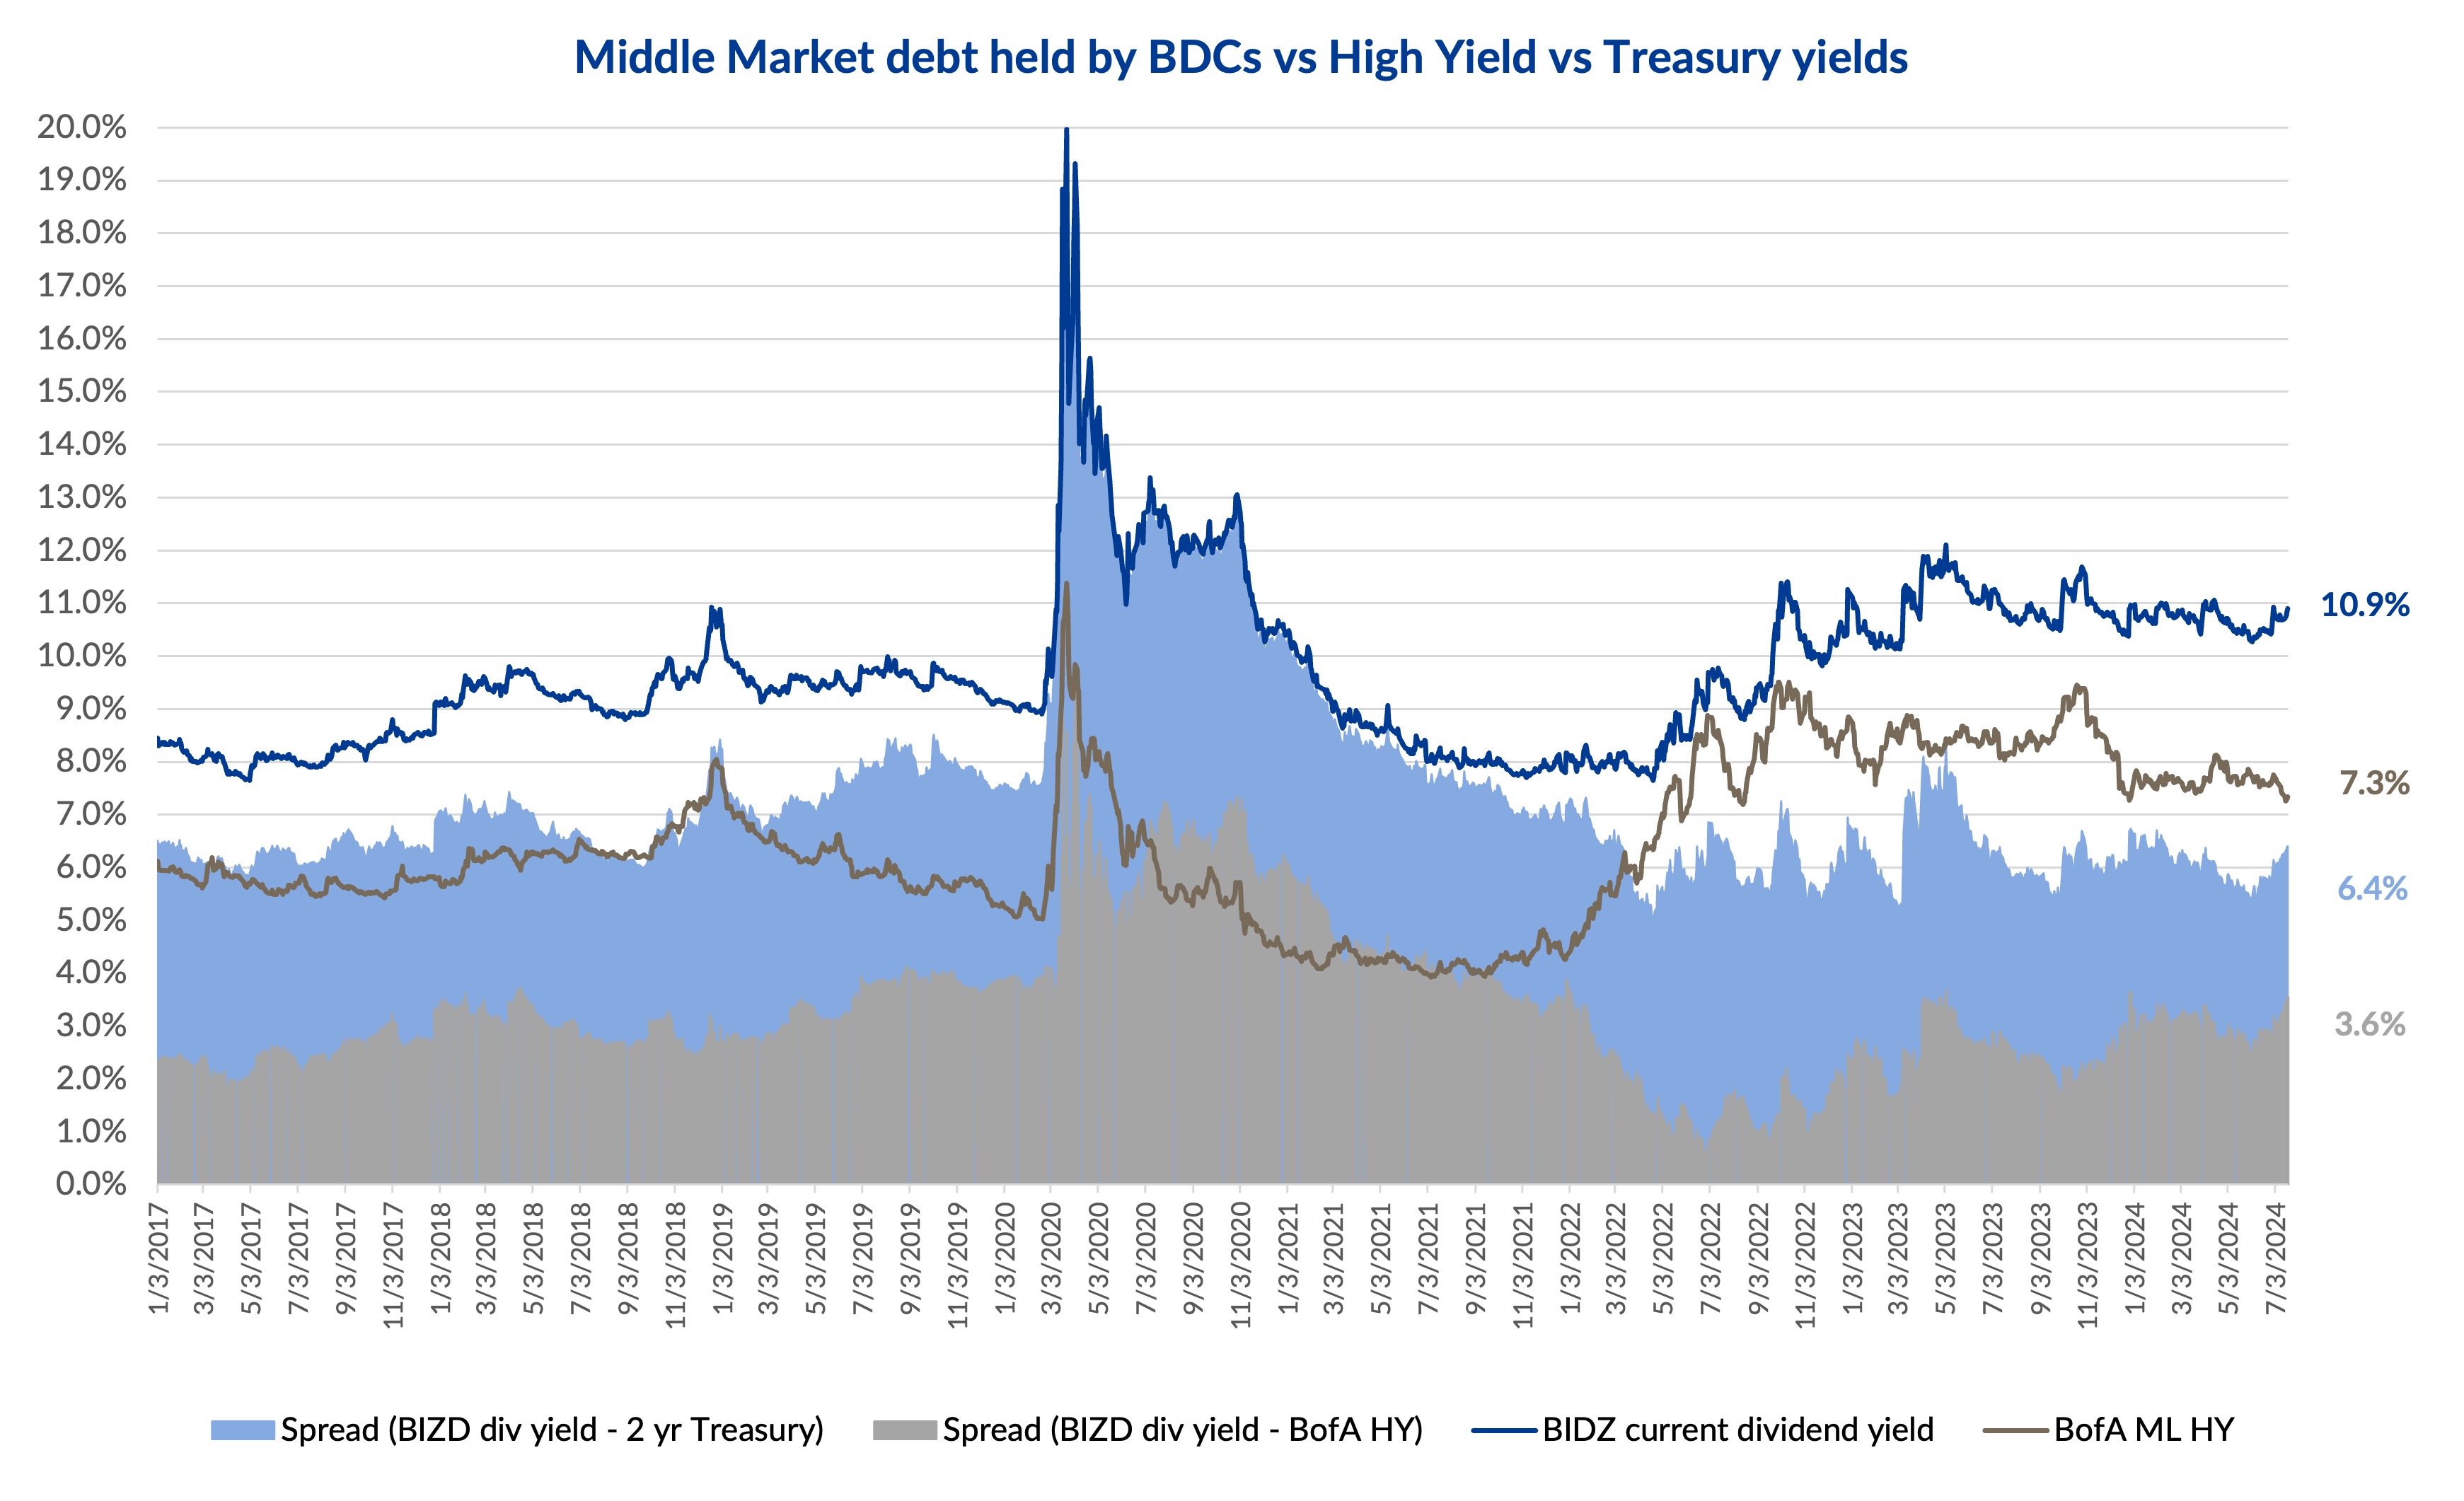
The blue line in the chart is the current dividend yield of the *VanEck BDC Income ETF (currently at 10.9% as of 19 July, flat YoY and down 80bps from the highest level in last 12 months of 11.7% in October 2023) that tracks the overall performance of publicly traded business development companies (BDCs, are lenders to privately held middle-market businesses that tend to be below investment grade or not rated, with most lending comprising of senior secured loans)...

Read More & Download Data

Contact: Suneet Chandvani/ Debtwire 

Private Debt Intelligence

Preqin-vF image

Family office investors favor private debt 

PQ-0715 image

Read more in Preqin’s Insights+ Research Note: Private wealth's path into US private debt


Family offices, which make up over a third of the private wealth entities, are showing a clear appetite for private debt strategies...

Read More & Download Data

Contact: William Bennett-Lynch/ Preqin

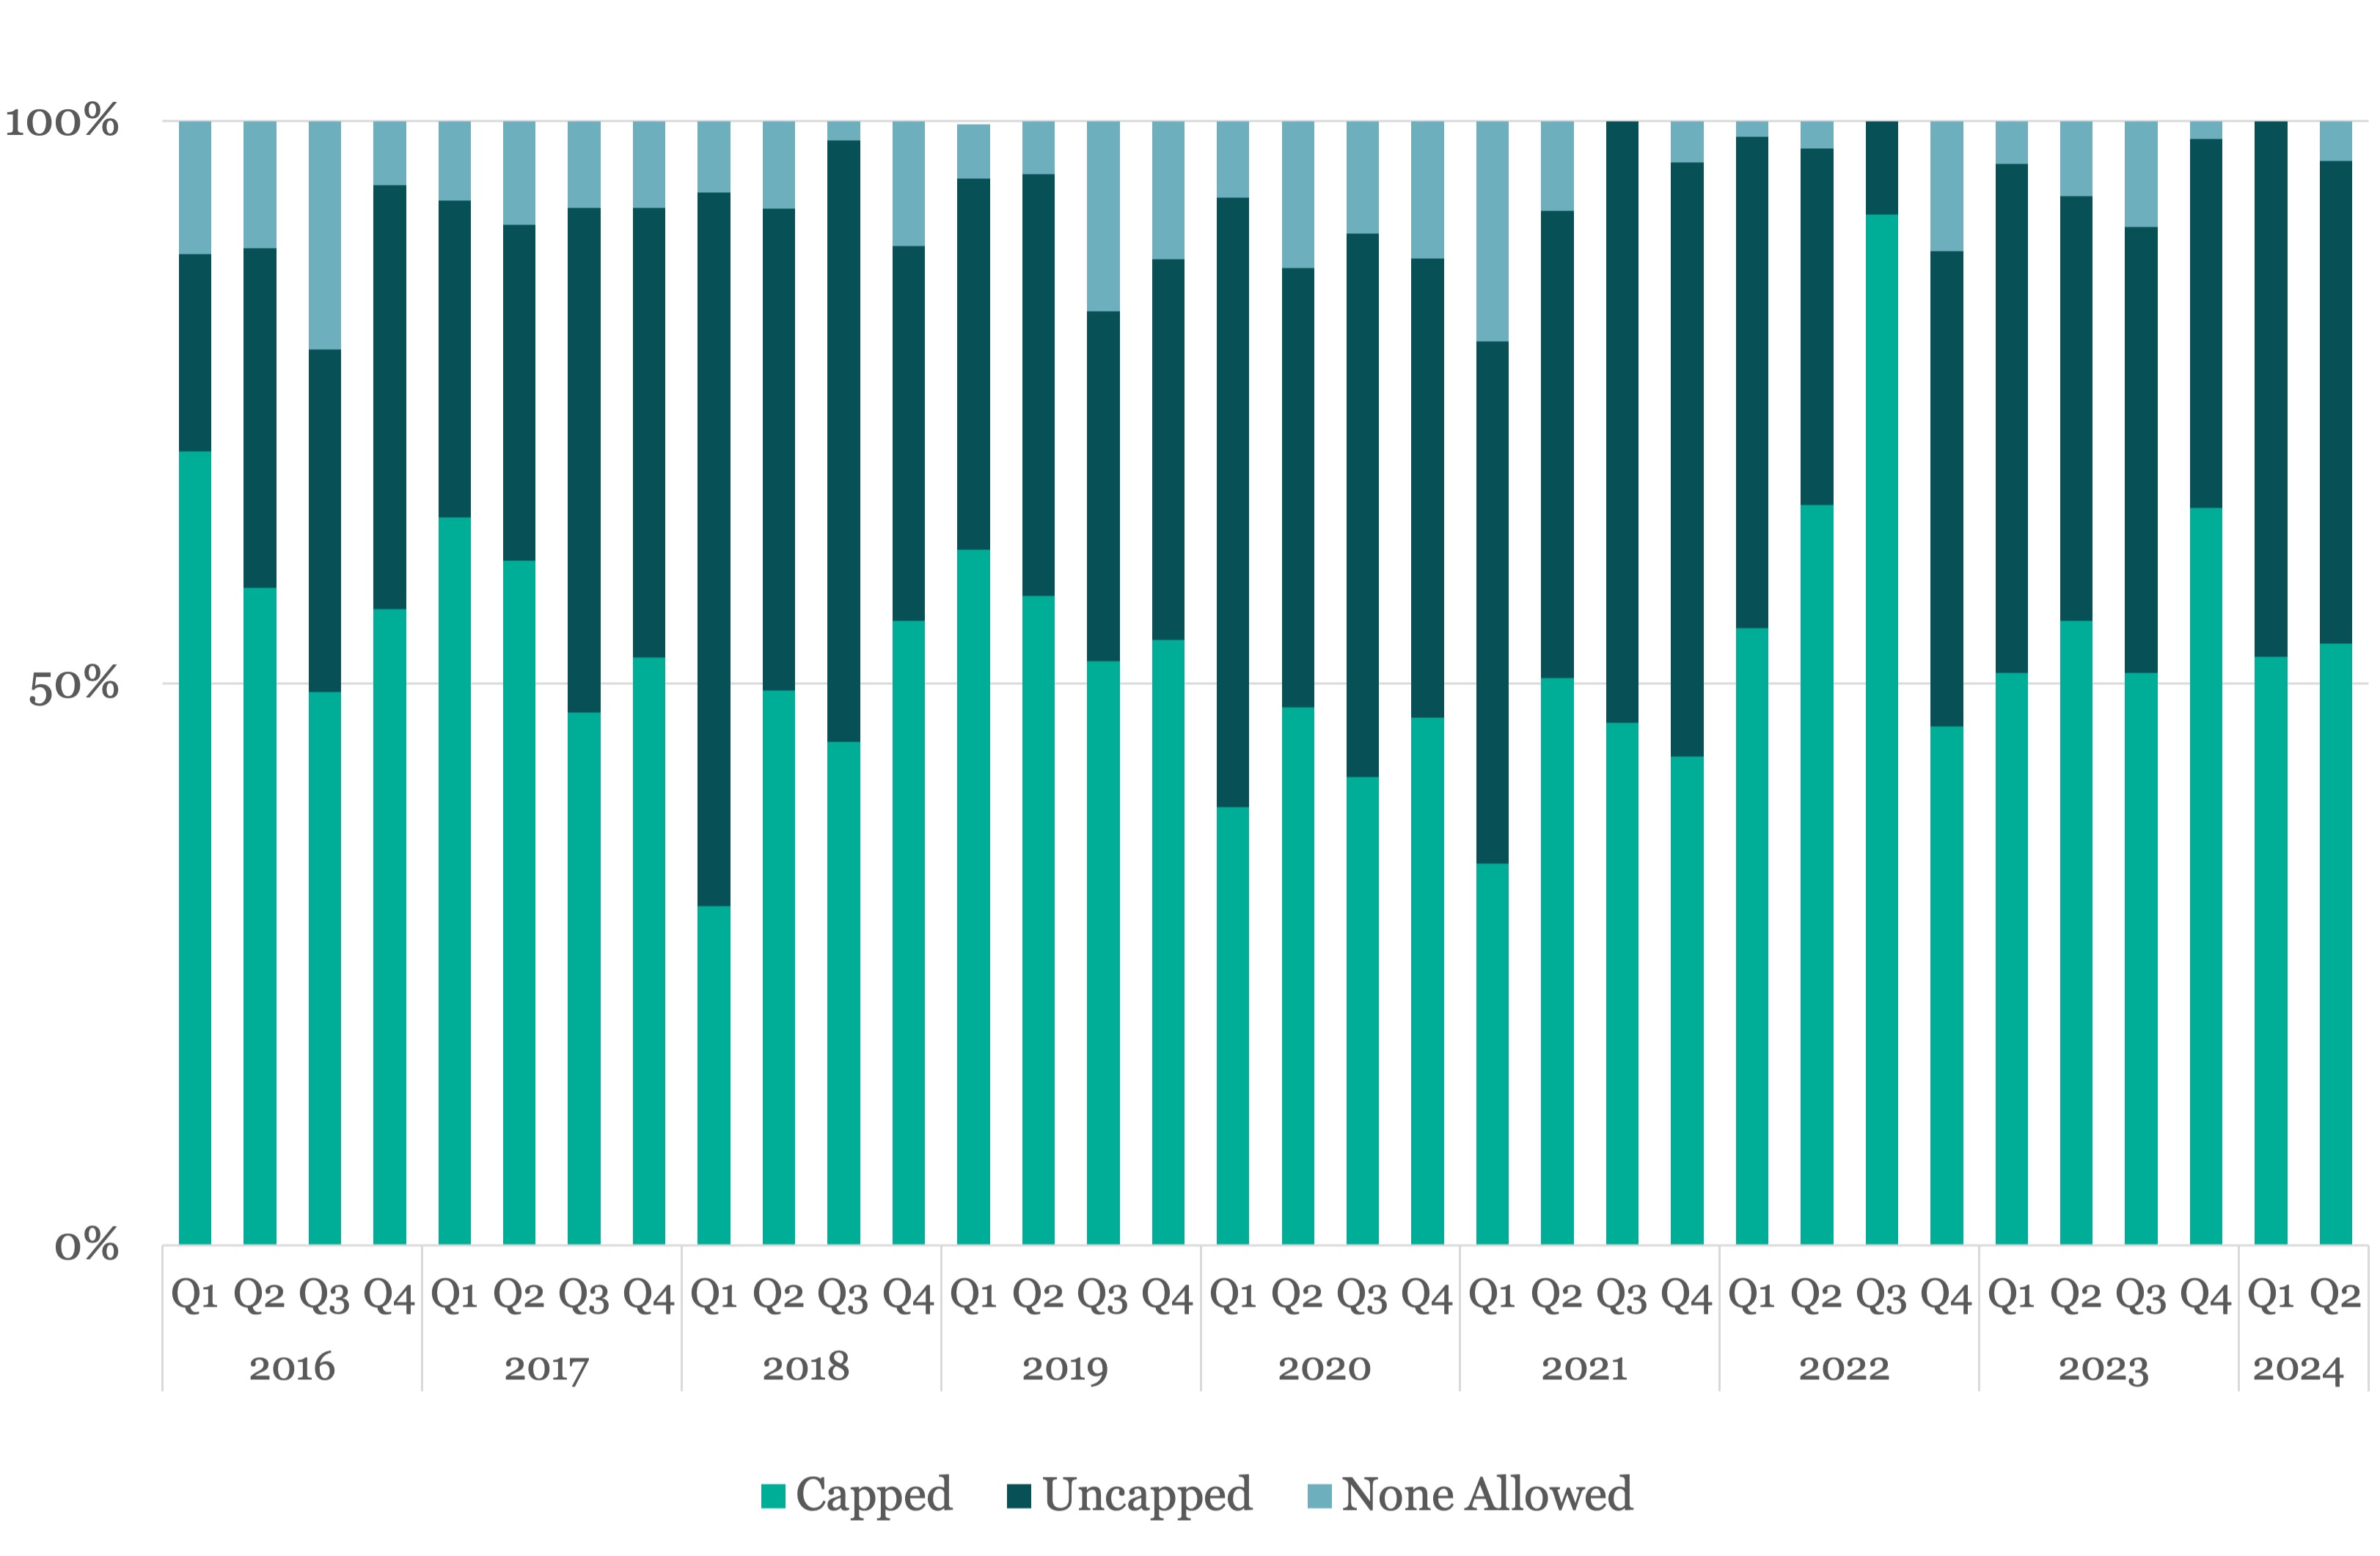
July Update: Middle Market Deal Terms at a Glance

SPP-2407 image

Contact: Stefan Shaffer / SPP Capital Partners

Churchill-2020-logo-white-for-event-invite image
STAY CONNECTED
Twitter  Linkedin  Youtube  

This publication is a service to our clients and friends. It is designed only to give general information on the market developments actually covered. It is not intended to be a comprehensive summary of recent developments or to suggest parameters for any prospective financing opportunity.