|
June | 2026
Welcome June
As we move from May into June, the real estate market continues to show signs of stabilization heading into the summer season. Housing inventory has steadily improved, with active listings rising more than 4% year-over-year nationally, giving buyers more choices and slightly more negotiating power than we’ve seen in recent years. Purchase activity is also showing resilience, with pending home sales reaching their highest levels since 2022 in several recent reports, despite mortgage rates remaining in the mid-6% range. Buyers remain active when rates ease, while sellers are adjusting pricing expectations as homes spend a bit more time on the market. Overall, the market is becoming more balanced and opportunity-driven as we enter June.
Wishing all the incredible dads out there a very Happy Father’s Day!
| |
HOA Lien Data Now Available!
In the May Title Toolbox newsletter, we shared an analysis focused on properties with liens that were also in Notice of Default status. At that time, HOA lien data was not yet included in our reporting. We are excited to announce that HOA lien data is now available in select geographic regions, providing even deeper insight into property-level financial activity and potential homeowner distress indicators.
This powerful new data layer gives real estate and mortgage professionals greater visibility into emerging homeowner trends, helping uncover new prospecting opportunities, identify potential distressed properties earlier, and gain a deeper understanding of market activity within their farm areas.
| | |
|
Featured Article: Data Insights
How 82,000 Hidden Liens Are Quietly Stacking on FHA-Backed Homes Across America
Our latest Data Insights report, “The Debt Beneath the Door,” uncovers a growing trend hidden beneath many FHA-backed home purchases nationwide.
👉 Read the full report
| | | |
Highlights:
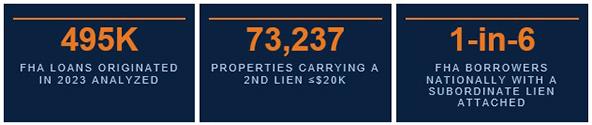
Our latest Data Insights report, “The Debt Beneath the Door,” uncovers a growing trend hidden beneath many FHA-backed home purchases nationwide. Benutech’s national property records analysis found that more than 82,000 FHA loans originated in 2023 included additional second, third, or fourth-position liens attached to the property, with many averaging between $10,900 and $11,300. While not concentrated in one specific market, the data highlights a broader pattern of layered debt quietly building across the nation’s most leveraged mortgage segment, offering important insight into homeowner financial exposure and emerging market risk trends.
| |
Key Statistical Takeaways
-
National subordinate lien volume (2023 FHA): 73,237 second liens, 7,762 third liens, and 1,533 fourth liens — totaling more than 82,500 subordinate instruments across the dataset (Exhibit A).
-
Estimated total subordinate exposure: Approximately $880 million in combined second, third, and fourth lien balances attached to 2023 FHA originations.
-
Highest stacking rate: Wyoming (39.8%), Idaho (33.9%), and Colorado (31.9%) lead the nation, where nearly 1 in 3 FHA borrowers carry at least one subordinate lien.
-
Highest average subordinate lien values: Connecticut ($17,051 avg. 2nd lien), Utah ($16,630), Hawaii ($15,755), and Minnesota ($14,655) represent the highest-cost subordinate debt markets.
-
Full-stack states: Texas (12,114 / 842 / 186) and Florida (6,861 / 721 / 137) are the only states with statistically significant volume across all three subordinate lien tiers — the same two states leading the national foreclosure filing count.
| | Exhibit A: Source- Benutech Data Insights | | |
Unlocking Opportunity Through Subordinate Lien Insights
As subordinate liens continue to rise across FHA-backed properties, many homeowners may be carrying far more financial burden than what appears on the primary mortgage alone. Second, third, and even fourth-position liens can increase monthly obligations, reduce homeowner equity, and make it more difficult to refinance or sell a property when market conditions shift.
For borrowers already navigating higher insurance costs, property taxes, and elevated interest rates, layered debt can quickly create financial strain and increase the risk of payment challenges or default. Understanding where these subordinate liens exist provides real estate and mortgage professionals with valuable insight into changing homeowner financial conditions and emerging market opportunities.
| |
Finding Properties with FHA First Loans and Subordinate Liens
Using the recent Data Insights analysis, we’re taking a closer look at Wyoming, Laramie County, and the City of Cheyenne.
In this analysis, we’ll take a closer look at properties with liens from January 2023 to present.
-
Navigate to the Farming tab and select "Area Search".
-
Select State: Select: Wyoming, County: Laramie, City: Cheyenne
-
Navigate to the Premier Data tab.
-
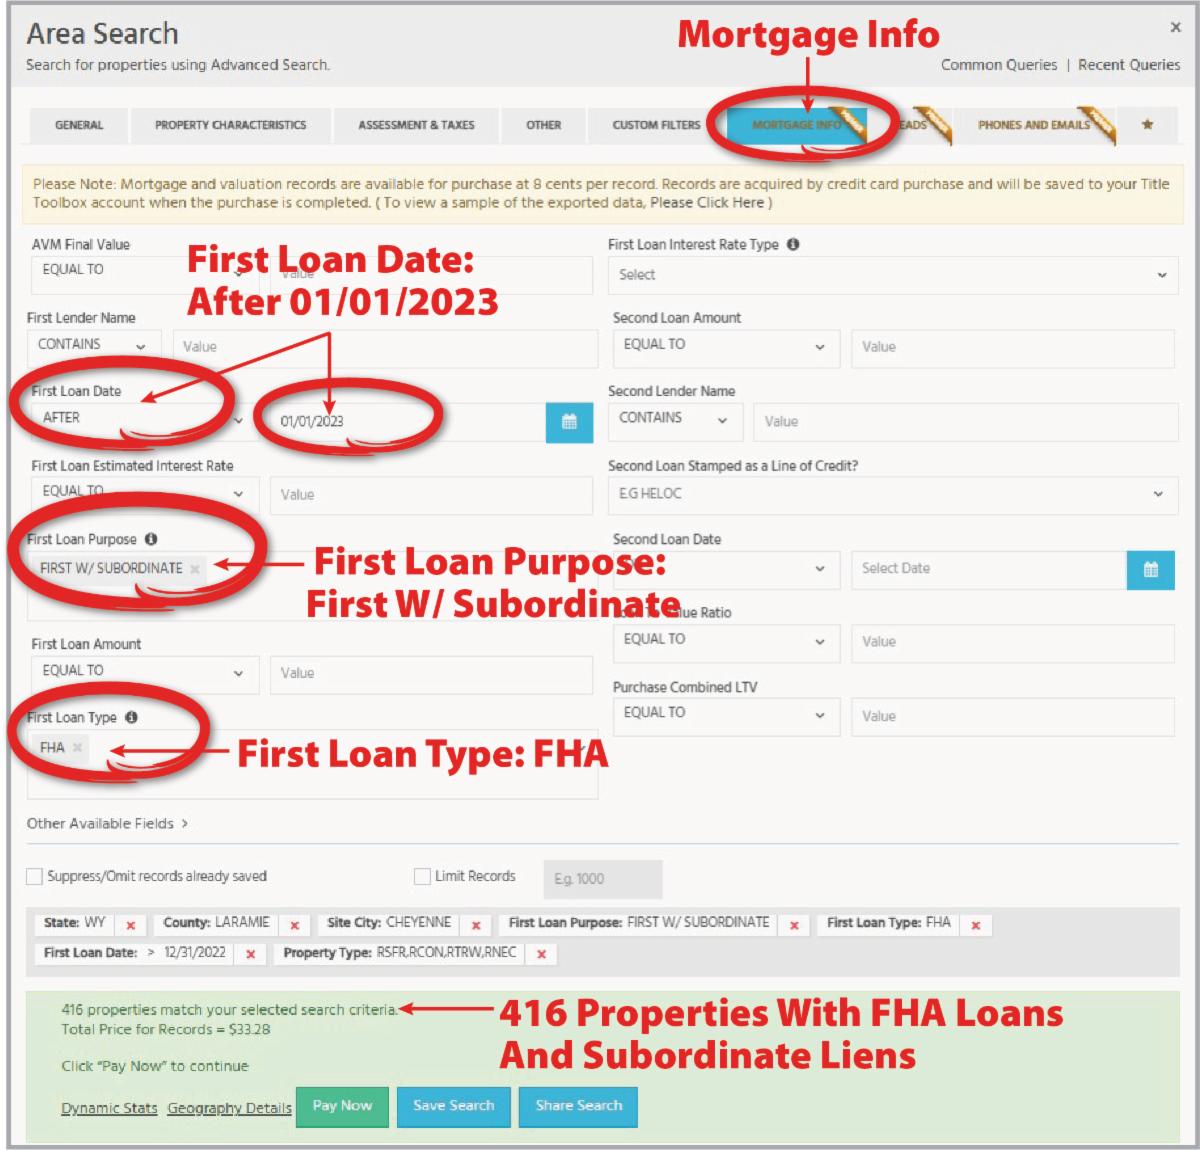
Select the “Mortgage Info” tab.
-
Under “First Loan Purpose,” select “First w/ Subordinate.”
-
Set “First Loan Date” to “On or After 01/01/23.”
-
Select “First Loan Type” as FHA.
-
Select “Get Count.”
Result: The search identified 416 properties with FHA loans that also contain subordinate liens. (Exhibit B).
| | Exhibit B: Source- Title Toolbox | |
FHA Loans With Subordinate Liens and Loan-to-Value (LTV) Ratios 100%+
Now we will take a closer look at FHA loans with subordinate liens to compare the estimated property value against the total debt owed on the property.
-
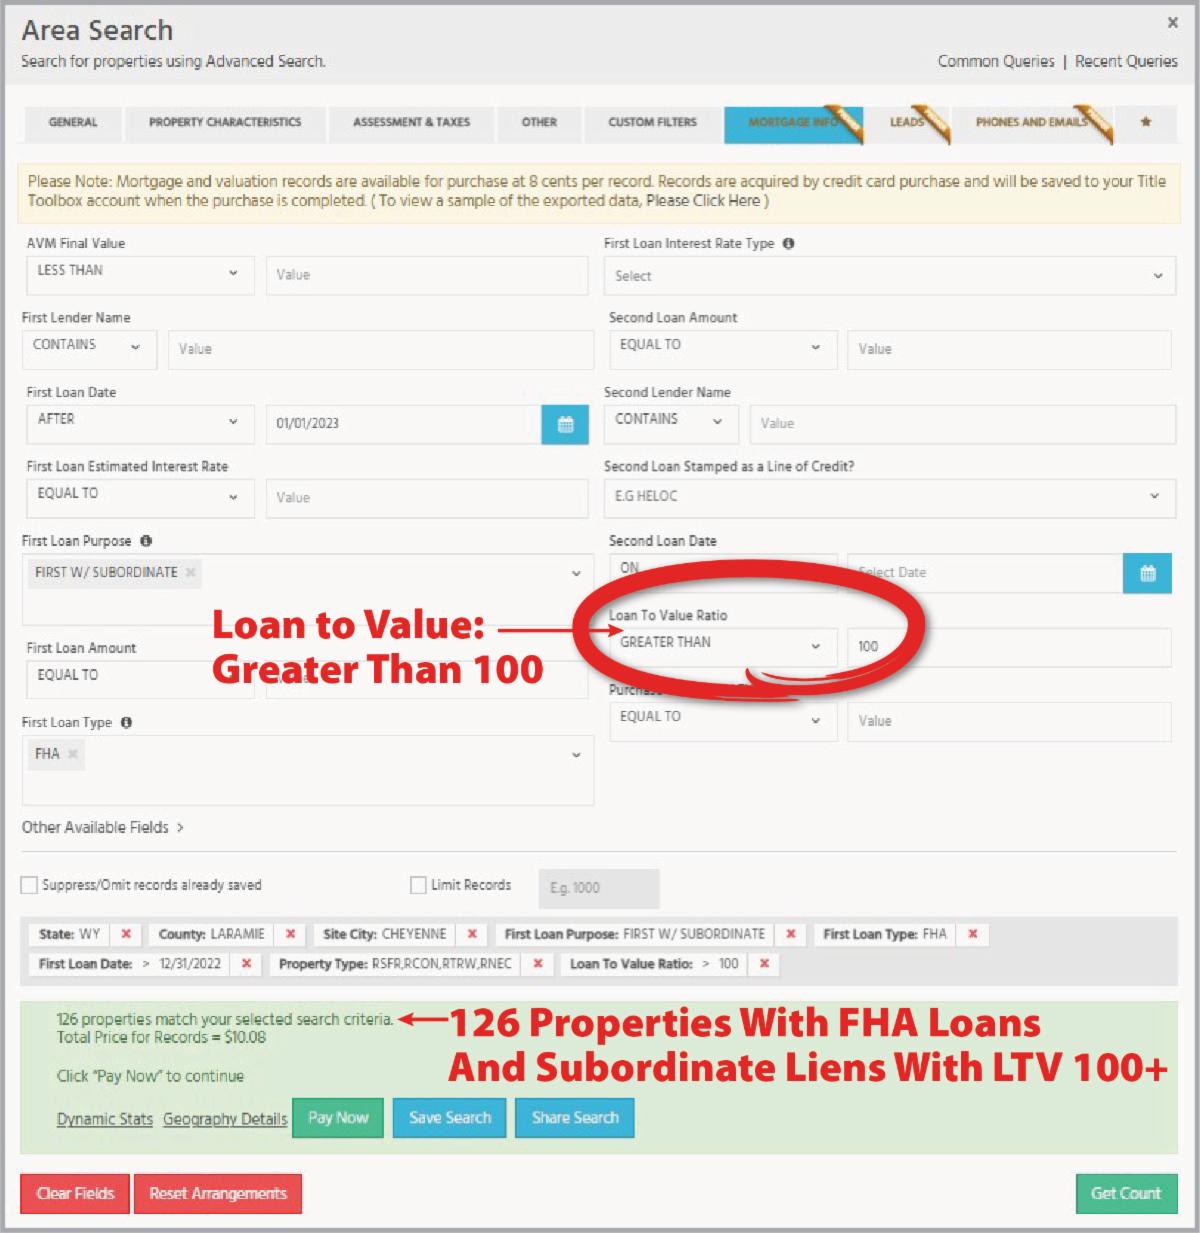
Using the same search results, add: “Loan-to-Value Ratio” is “Greater Than 100.”
-
Select “Get Count.”
-
To purchase the leads, click “Pay Now” and save your farm.
Result: Of the 416 properties identified, 126 have a loan-to-value ratio of 100% greater, meaning the homeowners owe more than the appraised value of the property, placing them in a negative equity position. (Exhibit C).
| | Exhibit C: Source- Title Toolbox | |
Reviewing Properties With an LTV of 100% or Higher
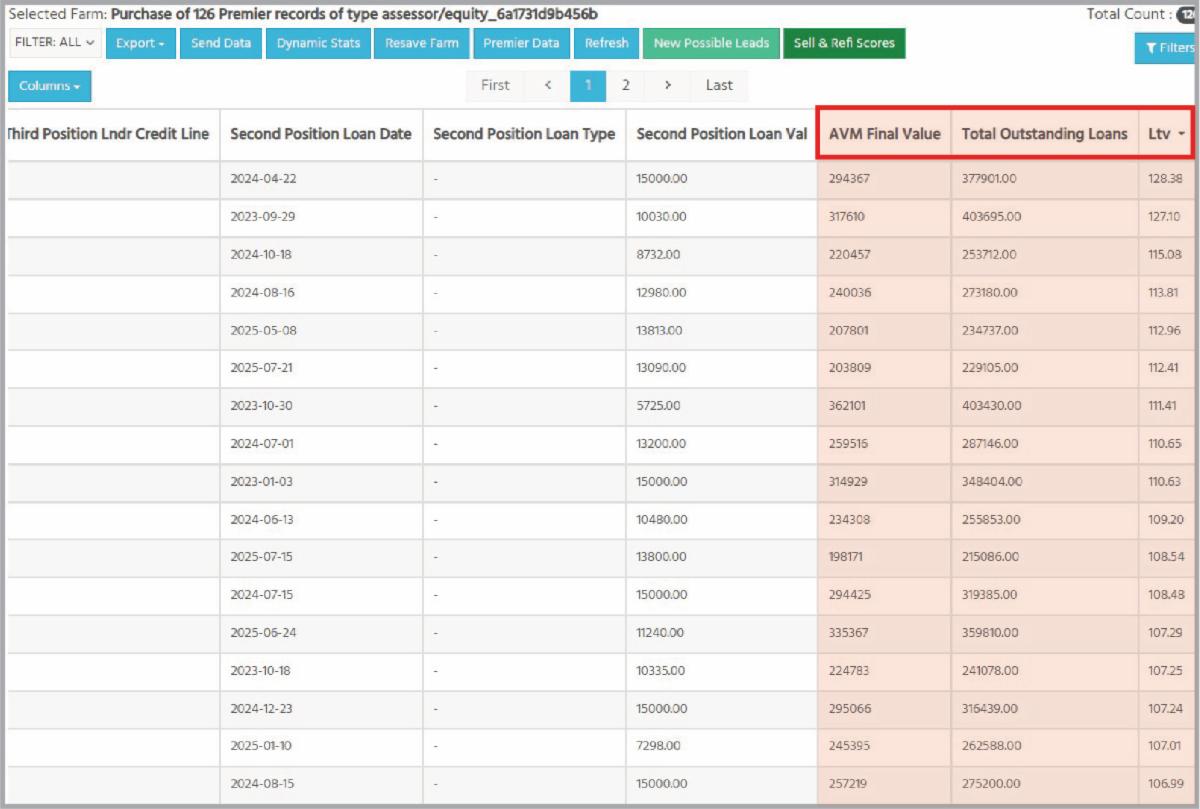
Once the results are purchased, scroll to the right to review the number of loans, loan values, loan dates, and LTV columns. Click on the LTV column to sort from highest to lowest.
In our search, the highest LTV identified was 128.38%, with total outstanding loans of $377,901 and an AVM Final Value of $294,367 (Exhibit D).
| Exhibit D: Source- Title Toolbox | |
Analyzing Property Debt Exposure Using the Net Sheet
-
Click the gear icon next to the property.
-
Select the downward arrow.
-
Choose “Net Sheet.”
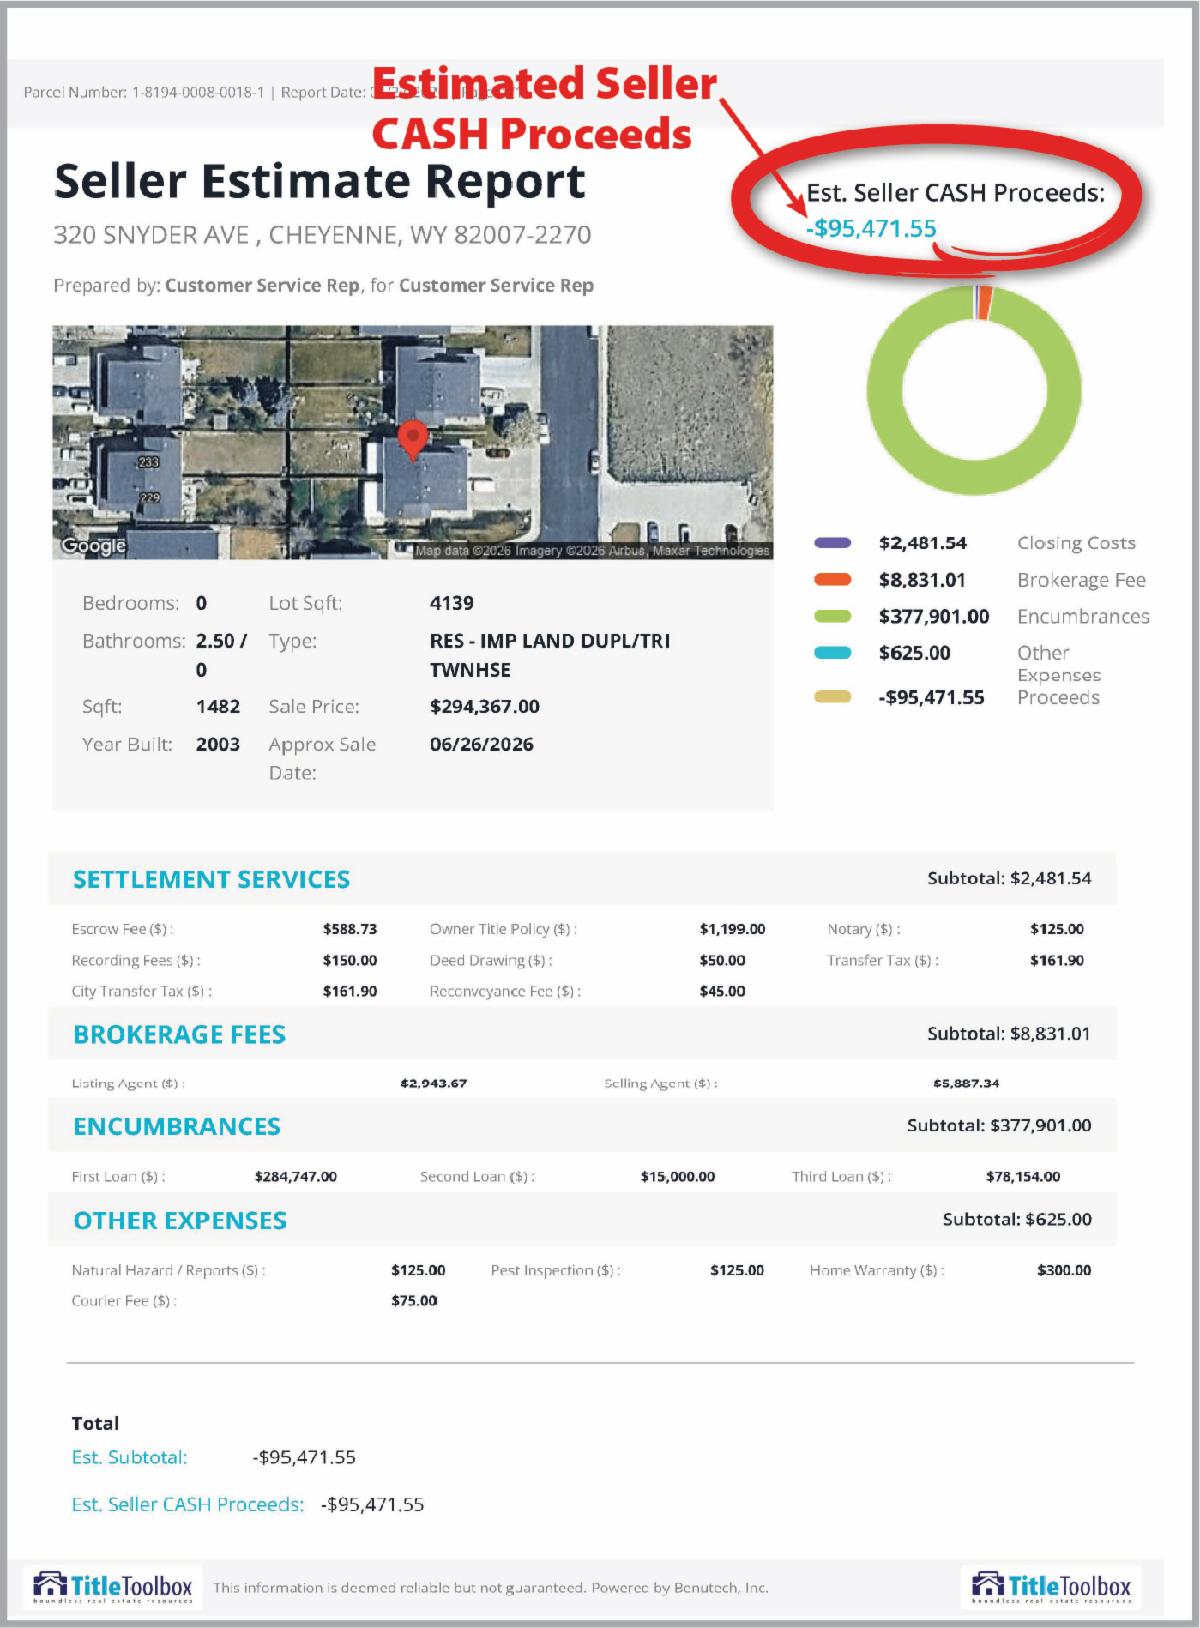
From the Net Sheet, we see the property has three loans totaling $377,901 against an estimated sale price of $294,367. After estimated closing costs, the projected cash proceeds are negative $95,471.55 (Exhibit E).
This homeowner is clearly facing significant financial pressure and may need to make serious financial adjustments. Situations like this may also present opportunities for real estate and mortgage professionals to provide guidance, support, or solutions.
| Exhibit E: Source- Title Toolbox | | |
Exploring the 126 Properties for New Possible Leads
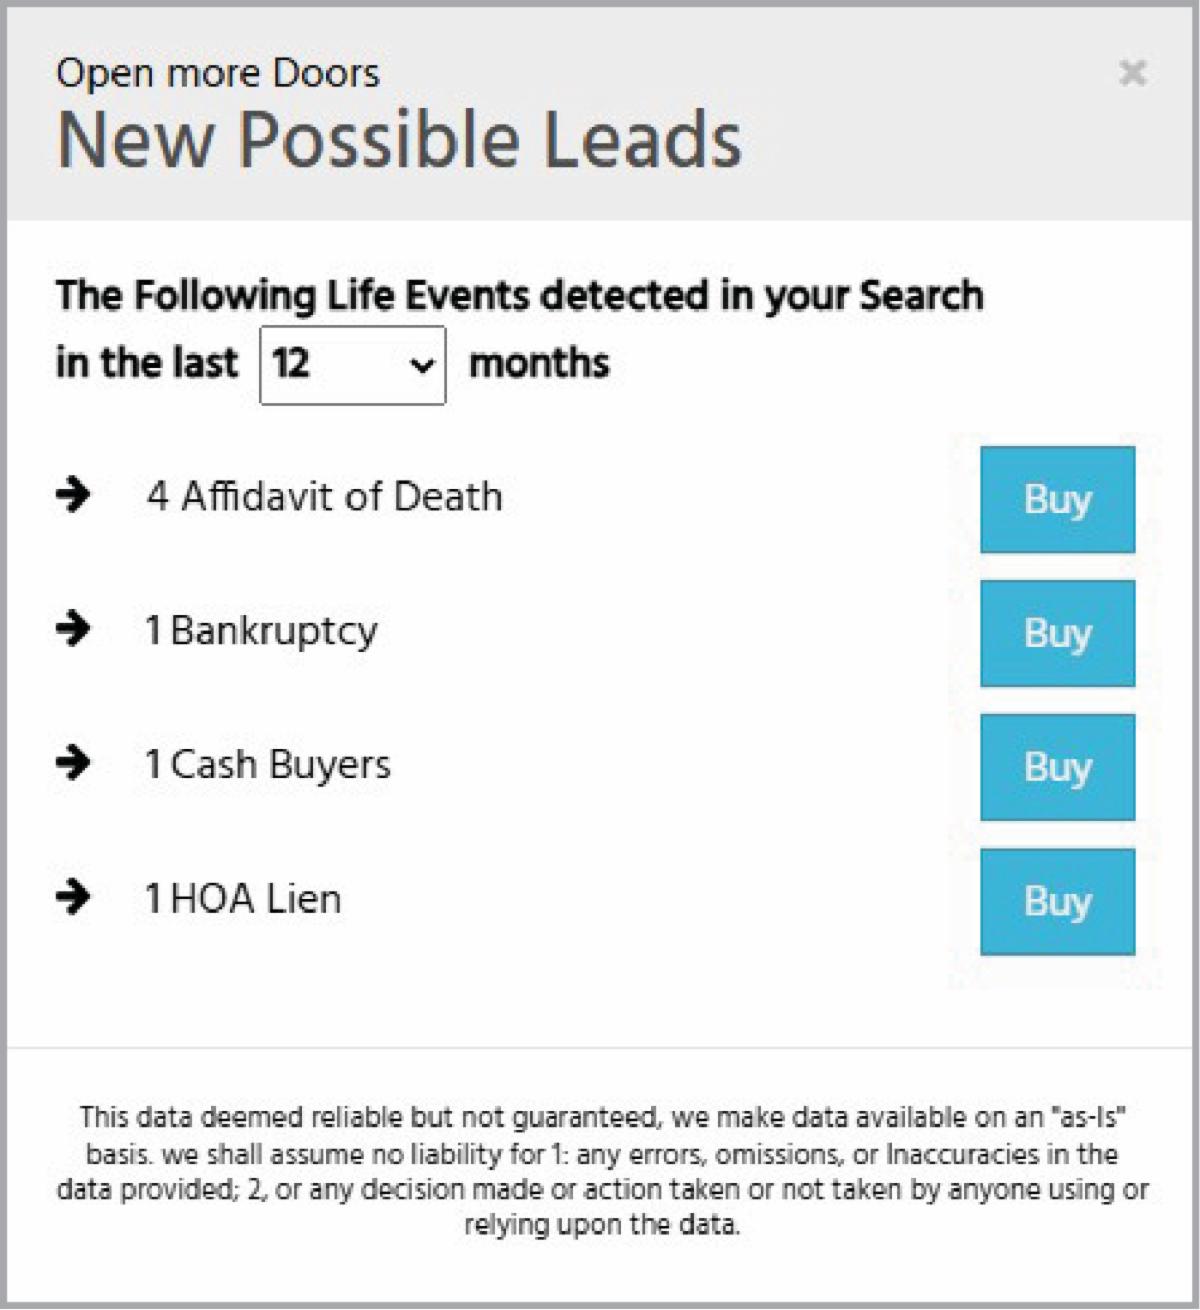
These 126 properties present an opportunity to identify homeowners who may be experiencing life-event changes through the “New Possible Leads” filter.
Within this search, the following events were identified over the past 12 months (Exhibit F):
- 4 Affidavits of Death
- 1 Bankruptcy
- 1 Cash Buyer
- 1 HOA Lien
These indicators can provide valuable insight into properties that may be facing financial stress, ownership transitions, or other changing circumstances within the high-LTV segment.
| | Exhibit F: Source- Title Toolbox | |
Final Takeaway
As market conditions continue to evolve, layered debt and rising homeowner financial pressure are creating new patterns that traditional prospecting methods may overlook.
By combining subordinate lien intelligence, LTV analysis, and life-event data, real estate and mortgage professionals can uncover highly targeted opportunities, identify homeowners who may
need assistance sooner, and position themselves as valuable local market resources before distress becomes visible to the broader market.
| | |
|
Finding New Possible Leads | In this video, you’ll learn how to identify properties within your farm area that may be experiencing additional life events. Learn Here> | | | |
With a few clicks of a button, Title Toolbox makes it extremely easy to share your data and research with your clients and prospects.
If you need assistance with Title Toolbox to help expedite your marketing efforts, please contact ttbhelp@benutech.com for questions and Jim DuBois at jdubois@benutech.com for one-on-one training.
| | |
May News Highlights and Life Event Trends
National:
-
Redfin Reports Pending Home Sales Hit Highest Level in Nearly 4 Years. U.S. pending home sales hit their highest level since September 2022 during the four weeks ending May 3, according to a new report from Redfin, the real estate brokerage powered by Rocket. They rose 7.7% year over year on a seasonally adjusted basis. (REDFIN) More>
Mortgage:
-
Rising Mortgage Rates Cause Surge in Demand for Riskier Loans. The adjustable-rate mortgage, or ARM, share of total applications rose to nearly 10%, the highest since October 2025. ARMs are considered riskier because their rates reset after a fixed period. (CNBC) More>
Rent:
-
The Building Boom is Paying off for Renters. A surge in apartment completions has tipped the market in renters' favor — and property managers are sweetening the deal to win them over. (ZILLOW) More>
Trending:
-
Nearly 4 Million U.S. Homes Now House Multiple Generations. Multigenerational living is quietly reshaping American housing demand, with sellers asking for 65% more for multigenerational homes amid high competition, especially in Southern and Eastern markets where supply is thin. (REALTOR.COM) More>
-
Home Prices Posted the Biggest Increase in Over a Year in April. The median U.S. home sale price rose 2.4% year over year in April to $396,173—the biggest increase in 13 months—as house hunters came off the sidelines amid a stabilizing job market. (REDFIN) More>
-
Foreclosure Activity Maintains Gradual Annual Climb in April 2026. Foreclosure Starts Up 12 Percent from a Year Ago; Completed Foreclosures (REOs) Increase 42 Percent Annually. (ATTOM) More>
-
Soaring Home Insurance Costs Add Pressure to Housing Affordability. An examination of over 1.2 million The average yearly homeowners insurance premium increased from $1,597 to $2,625 between year-end 2021 and year-end 2025, a 64% rise, according to Newrez-serviced residential mortgage loans. However, growth decreased to 10% in 2025, the lowest pace since 2021. (MORTGAGEPOINT) More>
-
Down Payment Assistance Surges as Gen Z, Millennials Lean on Family to Buy Homes. Nearly 80% of Gen Z homeowners are among the four out of 10 homeowners nationwide who received financial assistance with the down payment on their current home, according to LendingTree’s 2026 Mortgage Down Payment Survey. (MORTGAGEPOINT) More>
-
Equity-Rich Buyers, Sellers are Driving Today’s Housing Market. Adults ages 61 to 79 continue to dominate the housing market, making up the largest group of home buyers and sellers, according to the National Association of REALTORS®’ newly released 2026 Home Buyers and Sellers Generational Trends report. (NATIONAL ASSOCIATION OF REALTORS) More>
-
Home Sales Rebound Where Supply has Surged. Southern markets with plenty of choices lead the U.S. in annual sales growth. (ZILLOW) More>
| | |
Need Video Training, Marketing Material, and Support?
One location to access all the latest information available for Title Toolbox users. Easy to share with your clients and get them off to a great start!
| Click the Support button to visit our Promote Title Toolbox site | |
| |
Please forward this to your clients so they can get the latest Title Toolbox Tips and Training.
If you have feedback or questions, please contact ttbhelp@benutech.com
| | |
Some material contained here may not apply to your company.
View as Webpage
| |
Benutech, Inc. | 855.276.1159
| | | | |