PAST, PRESENT, & FUTURE:

No Ghosts Here, Just Current Equity Market Analysis

2024 has undeniably been a strong year for equity market returns. Does that mean we should expect strong returns in 2025 as well?


While we don't have our own ghost of market’s future, there is a lot of data available to us that can help us develop a deeper understanding of what is really going on beneath the surface. I've gathered a few slides below that I hope can paint a clearer picture of what the data is telling us about where we have been, where we are, and where we might be headed as 2025 approaches.


Emory

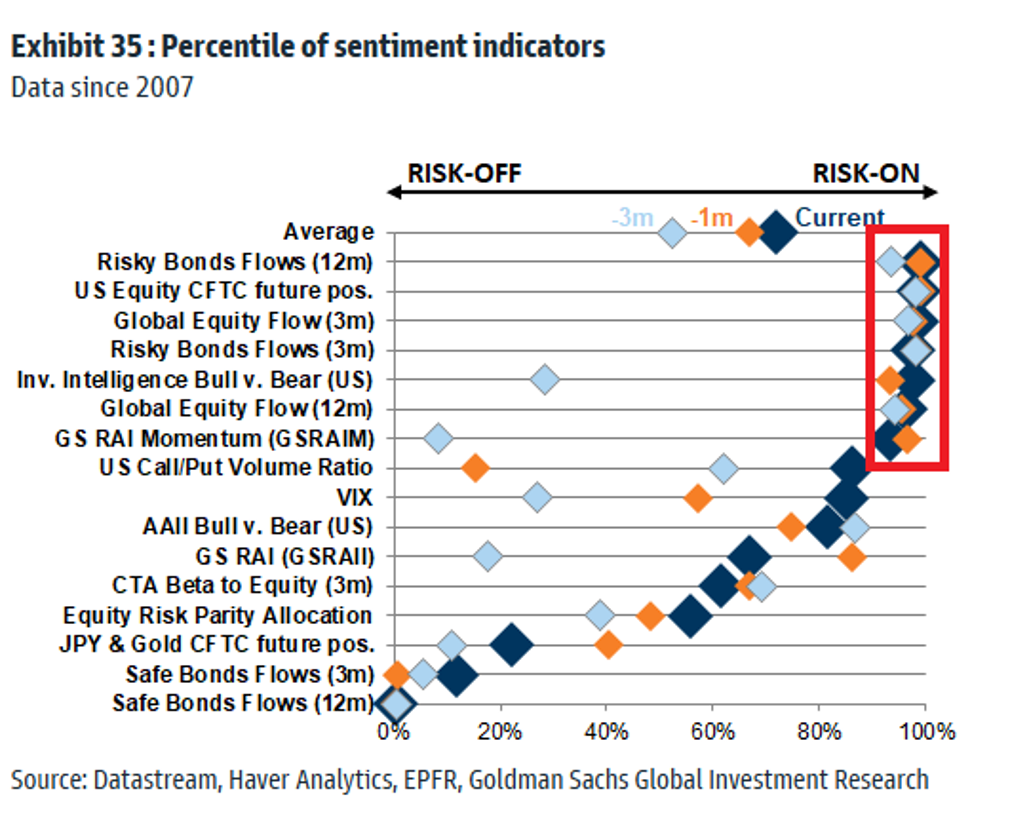
Sentiment can be thought of as a measurement or favoritism or an “appetite” for risk (stocks) or security (cash and CDs). This is an oversimplification, but it’s worth noting and sharing this chart below to show just how risk-on and confident investors are at present. When sentiment moves to the far extremes its worth taking notice and we’re at such a point of extreme today. Investors are very bullish and that’s proven over the years to be a contrarian indicator – meaning investors are typically too bullish when they should be more cautious

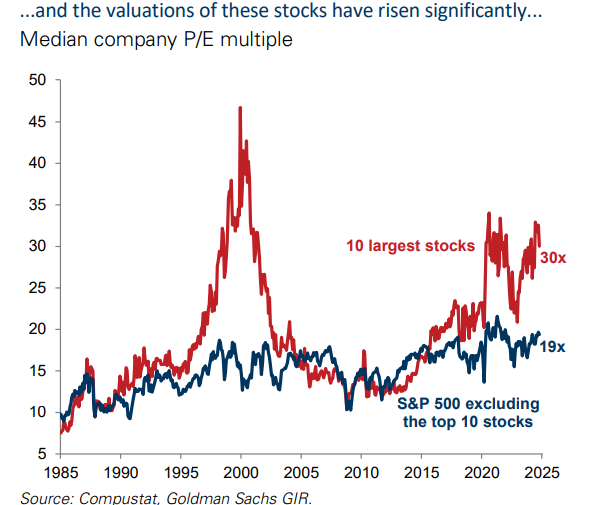
Fundamental analysts and investors believe current valuations of a stock or market of stocks (an index like the S&P 500 for example) can serve as a predictive tool for the stock price or index level in the future. The broader indexes have elevated valuations today mainly due to the higher-than-normal P/E (price to earnings) ratios of the Magnificent 7 (Apple, Amazon, Alphabet/Google, Meta/Facebook, Microsoft, Nvidia and Tesla). When we consider the P/E ratios of the other 490ish stocks in the S&P 500 it becomes quite evident that the rest of the market is trading at only slightly elevated P/E ratios relative to historical norms – thus, giving credence to the idea that the Mag 7 are in the classic stock bubble (which they believe will eventually burst). This has been the case for months and the lack of ownership of such Mag 7 stocks has cost investors a great deal of return over the last 2 years (at a minimum).

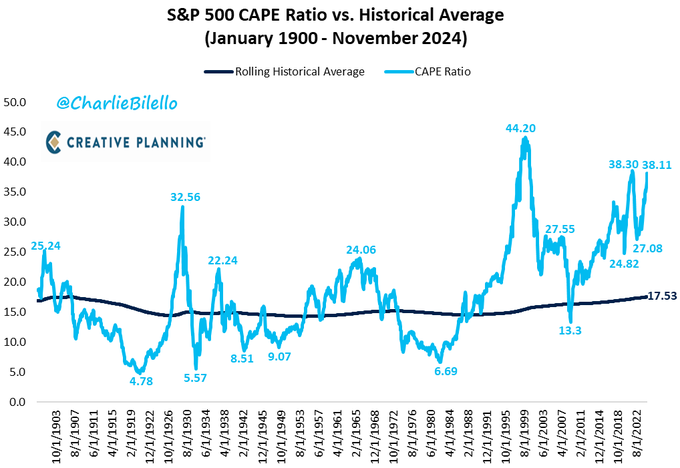
Even I’ll admit when reviewing the history of such valuation ratios, the current situation is eye opening. The CAPE Ratio (one such valuation metric) is reading at levels only seen a few other times in stock market history. With hindsight, we know that the market didn’t respond well after such readings in the late 1920s, 1999, 2018 or 2022. This is just one ratio to consider, but if you’re feeling bearish (risk-off) already, this will certainly feed those fears of a potential market selloff to come.

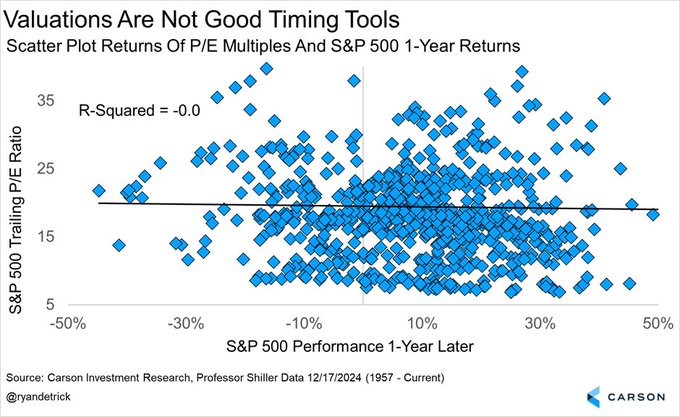
As interesting and as complex as valuation metrics can be, they don’t necessarily serve as the greatest predictors of future markets. From this scatterplot below we can see that many 1-year returns are quite concentrated in the +/- 20% range no matter if the P/E is 10 to 25.

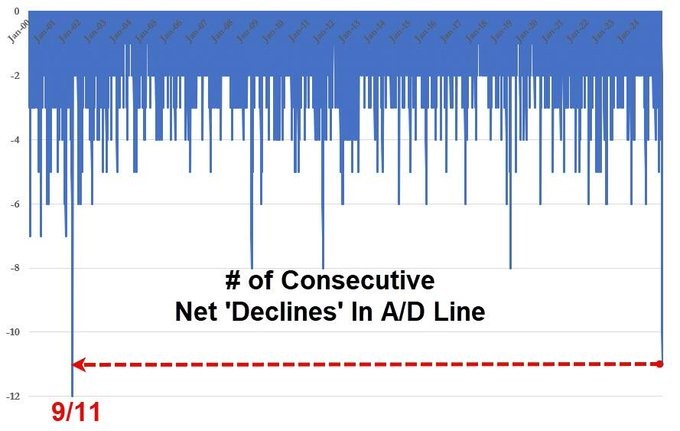
Speaking of history, it’s being made again in the stock market. Over the last 2 weeks the market has trudged higher, but with most stocks actually falling. Market breadth is a powerful tool in bull market, but currently the breadth is nonexistent. The Mag 7 and other momentum stocks of 2024 are carrying the load to keep the indexes up, but most stocks are moving in the opposite direction. This is a reason for caution as we look at the short-term pathway for the market.

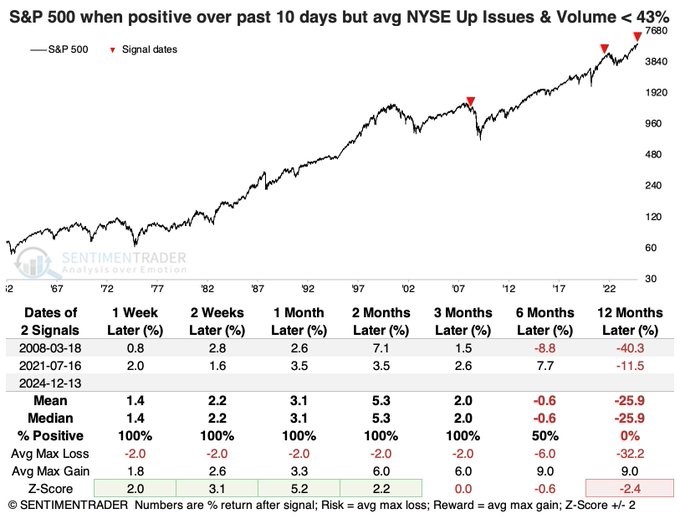
This line chart further illustrates the last point. Here we can see how the market typically responds a few months to a year later after such a period as this (low breadth, but stable or rising indexes). The data set is extremely limited with only 2 occurrences since the mid-1960s. In both cases though the prospects for attractive returns were weak to plain unsatisfactory. Said otherwise, history leads us to believe that the market can march higher but after a few more months the climbing typically gets harder.

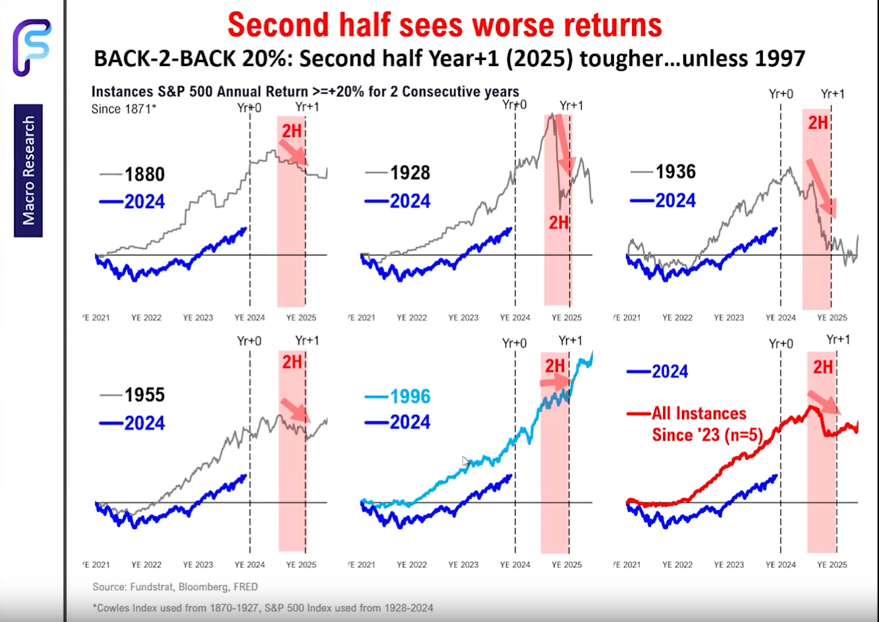
Following two consecutive years when the stock market has gained +20% (as it did in ’23 and has so far into ’24) we know that the market has a hard time maintaining it’s upward momentum in the second half of the following year (’25). The exception here was 1997. In all other years we can see that the market was able to maintain it’s positive trend only to see returns fall in the second half of the year. Tom Lee with Fundstrat believes we can see a similar pattern in 2025. This would match up quite well with historical evidence we saw in the last chart too.

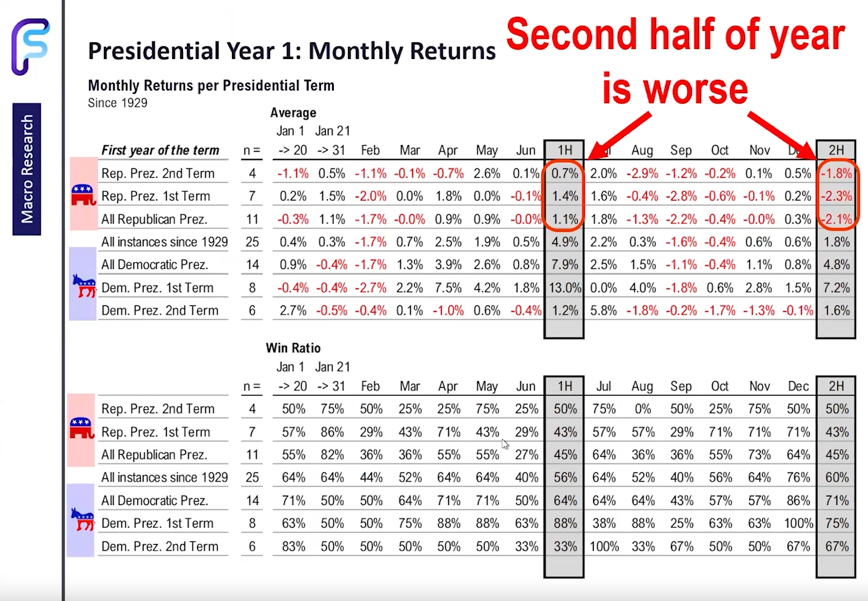
This “Presidential Year” research also comes from Tom Lee and corresponds with the previous findings. What I particularly like about this chart is the month-by-month historical data. Notice how the market softens typically between late January through June when we have a second term Republican president as we have now. The annualized returns for the 1st half versus the 2nd half of the year are +4.2% vs -10.8% which would lead one to believe that the market could return an estimated -5% return in 2025. Most market forecasters are predicting for a 10% return in 2025, but to be fair these are the same people that expected a 2% total return in 2024 (currently the market is up +23.5% this year (even after yesterday afternoon's swoon).

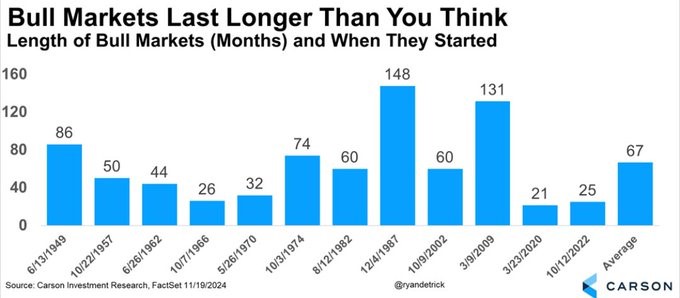
While most of the data presented above gives reason for pause, we must remember that the market is extremely resilient and that bull markets last far longer and are more frequent than bear markets. This current bull market is just over 2 years old. If we see it act like a “normal” bull market, we can expect the possibility of another 3.5 years of upward trajectory in the market. 

It is our responsibility to take all of these observations, objective data points and historical evidences into consideration to form our own professional opinions on the market and its future.


Presently we’re grateful for the positions we own (many of which are Mag 7 related), the returns we’ve produced (+20% on average) and the prospects for future growth (expecting positive returns in 2025), but yet our eyes remain wide open for opportunities to increase or decrease risk in each customized portfolio to ensure that we’re doing all we can to fulfill your financial needs and allow you to live a life of financial independence. 


Merry Christmas!

Emory G. Hendrix, Jr., AAMS®, CEPA® 

Managing Director / Crescent Wealth Management

A: 124 Verdae Blvd., Ste. 105, Greenville, SC 29607

D: 864.729.4288 O: 864.464.9626   

E: emory@crescentwm.com   W: www.crescentwm.com

Advisory services provided by NewEdge Advisors, LLC doing business as Crescent Wealth Management, as a registered investment adviser. Securities offered through NewEdge Securities, Inc., Member FINRA/SIPC. NewEdge Advisors, LLC and NewEdge Securities, Inc. are wholly owned subsidiaries of NewEdge Capital Group, LLC.


NOTICE: This email communication including all attachments transmitted with it may contain confidential information intended solely for the use of the addressee. If the reader or recipient of this communication is not the intended recipient, or you believe that you have received this communication in error, please notify the sender immediately by return email and PROMPTLY delete this email including all attachments without reading them or saving them in any manner. The unauthorized use, dissemination, distribution, or reproduction of this email, including attachments is strictly prohibited and may be unlawful.