| | |
POLICY & ADVOCACY UPDATE
Issue #81, 1 October 2026
| | | |
- From the AA CEO James Goodwin
- Tourism expenditure and visitor nights growing
- Changes to credit card surcharging
- Hotel Performance for August
- Annual market research survey
- Accommodation and food services earnings up 9% in 2024-5
- Sydney tops Asia Pacific in global sustainability ranking
| |
| |
From the AA CEO
Migration has been dominating our attention and focus since Home Affairs Minister Tony Burke announced at the National Press Club exactly a fortnight ago, sweeping changes to visas.
| | | | |
Two weeks on and much has happened but much is still in limbo, particularly in relation to Working Holiday Makers. Thank you to members for your ongoing updates, examples and case studies on how the changes will impact you and your businesses. This was certainly the key issue raised when I met many of you at the No Vacancy conference in Sydney last week. I also want to acknowledge those who have shared their personal stories about what the changes will mean to them, a reminder that people and colleagues are not just numbers in a policy document.
I have been holding many high-level meetings and briefings in Canberra with my colleagues from the Australian Hotels Association including with the Prime Minister’s Office. Importantly, the meetings have been with both politicians and senior bureaucrats so that we can cover both the politics and the practical regulatory details that people need. More details on what we have been advocating for is in the article below.
Today also marks the end of card surcharges and we have been working to support members understand what they are paying and if there is a potentially better rate. Now that the ban is in force, this will become much more real, and I encourage you to make use of the comparison tool developed for the hotel industry.
James Goodwin
Chief Executive Officer
| | |
Working Holiday Maker changes
The government is still working through the details of how the announced changes will work, including the ballot. The Department of Home Affairs says the final details are still some weeks away but the new arrangements are due to start in November.
What we know:
The Working Holiday Maker Program has been changed to introduce a ballot system for second- and third- year visas – 45,000 places for year two, 5,000 for year three – with the existing regional work requirement retained. Processing times will be stabilised to three months for all WHM applicants except those from the UK.
What we are advocating for:
The AA is recommending that government should:
- Create transition rules for those WHM and employers that have done the right thing:
- Exempt from ballot those already in country and serving (or have served) their 88 days or 6 months in remote or regional areas.
- Amend the new eligibility rules for those willing to provide additional service to remote and regional areas:
- Retain ballots for non-UK WHM, provided that those who serve:
- Six months in Year One be exempt from the ballot for WHM Two (Note: increased from 88 days), and
- 12 months combined over WHM One and WHM Two be exempt from the ballot for WHM Three (Note: increased from 270 days).
- UK WHMs not to be counted in ballot and remain uncapped
| | |
Tourism expenditure and visitor nights growing
The latest International Visitor Survey (IVS) data, released this week by Tourism Research Australia (TRA), shows that international visitors spent $40.5 billion in Australia in the year ending June 2026, up 16% on the previous year. The number of trips increased by 9% to 8.4 million, while visitor nights rose by 5% to 314.9 million. Holiday travel performed particularly strongly: trips increased by 13% to 3.7 million, and holidaymaker expenditure rose by 18% to $13.4 billion. Of concern to the accommodation sector, however, is the decline in the share of international visitor nights spent in commercial hotels, motels and resorts – down 9% for all international visitor nights and 1.7% for holiday visitor nights. A full breakdown of international visitor nights will be included in the next Advocacy Update.
TRA also released domestic expenditure data, although comparisons remain limited because of the transition from survey-based reporting to a more holistic use of data. Results for overnight travel in the year ending June 2026 were mixed compared with the same period last year. Overnight expenditure was unchanged at $108.1 billion, while the number of overnight trips remained steady at 112.5 million. Total visitor nights were also unchanged from 2025, at 380.2 million. For the June quarter, overnight spend was up 2% on 2025 to $25.7 billion, while nights fell 2% to 89.0 million
| | |
Changes to credit card surcharging
From 1 October 2026, businesses can no longer charge customers an extra fee for paying by card. Businesses will still incur merchant and payment processing fees, but these costs can no longer be passed directly on to customers as a card surcharge. Now is the time to review your card processing costs and ensure you're getting the best available rate. The Association has developed a Card Payments Comparison Tool to help hospitality businesses compare providers and available member rates. For more information, please visit your state or territory member portal.
| | |
Hotel Performance for August
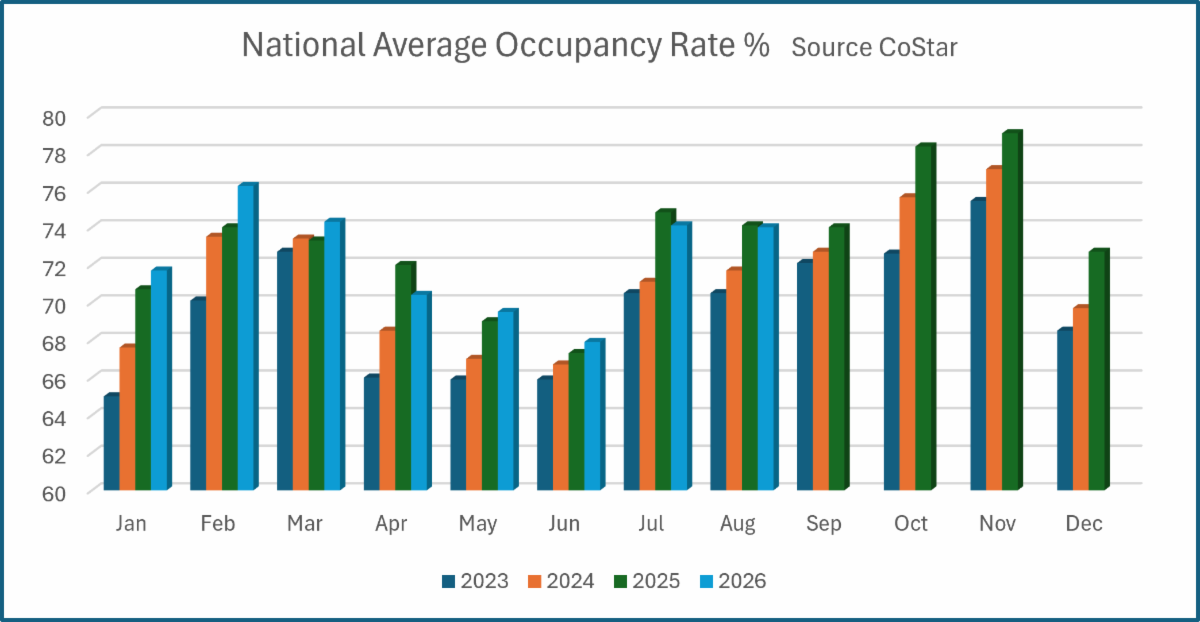
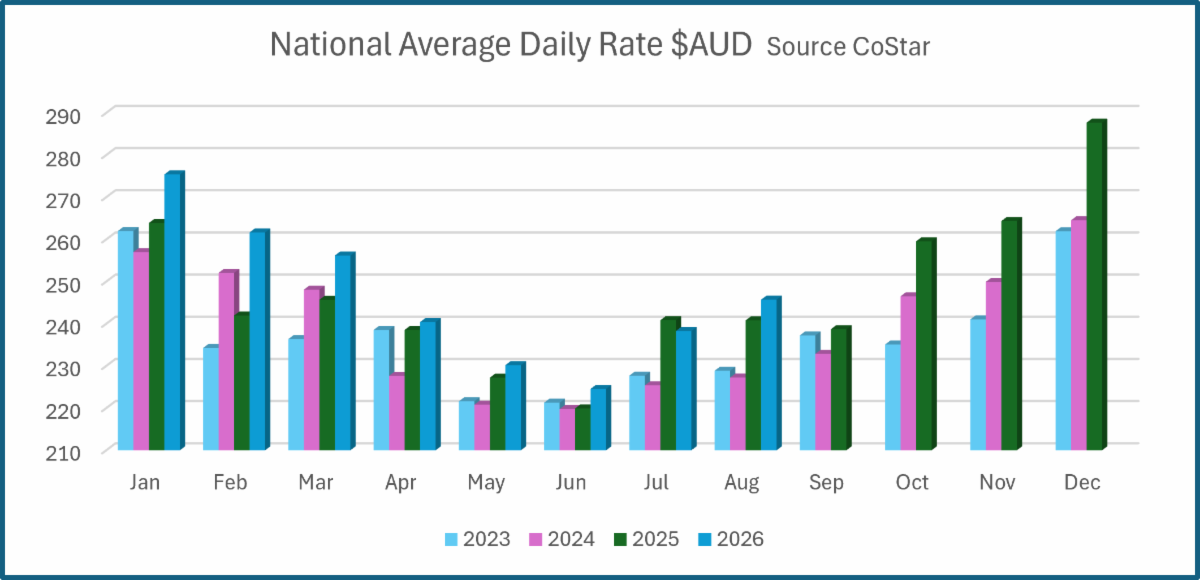
CoStar data for August 2026 shows mixed performance across Australia, with most states reporting stronger trading conditions for the month.
- National average occupancy was up 0.1% to 74.0% for August, ADR up 2.3% to $245.71, resulting in a RevPAR increase of 2.4%. Across the first eight months, occupancy was up 0.5% and ADR up 2.9%.
- NSW experienced an average occupancy of 76.1%, down 0.5% compared with August last year, with ADR up 2.5% to $272.57. In the first eight months, occupancy was up 0.8% and ADR up 3.9%.
- Victoria's occupancy rose 1.3% to 70.9%, and ADR fell 1.1% to $201.91. Year to Date (YTD) occupancy was up 0.9% and ADR down 0.1%.
- Queensland occupancy fell by 1.1% to 75.0%, and ADR rose by 3.5% to $267.22. YTD occupancy rose 0.1% and ADR up 2.8%.
- SA occupancy up 2.9% to 68.8% for August, and ADR up 5.1% to $193.79. YTD occupancy was up 2.1% and ADR up 5.8%.
- WA occupancy up 2.6% to 79.0%, and ADR up 4.6% to $249.65. YTD occupancy was up 0.1% and ADR up 4.5%.
- Tasmanian occupancy up 1.3% to 63.7%, and ADR down 0.6% to $185.29. YTD occupancy up 0.5% and ADR up 5.5%.
- NT occupancy up 1.2% to 79.1% and ADR up 5.8% to $285.43. YTD occupancy down 2.3% and ADR up 4.0%.
- ACT & Canberra occupancy down 3.4% to 69.7% but ADR up 0.6% to $185.89. YTD occupancy down 1.3% and ADR down 1.5%.
Preliminary capital city CoStar data for the month to September the 26th highlights differing market conditions across Australia's capital cities, with Melbourne, Brisbane, and Sydney recording stronger occupancy gains and average daily rates while the remaining cities experienced mixed trading conditions:
- Sydney saw a 3.7% rise in occupancy to 82.4%, while ADR increased 8.3% to $274.55.
- Melbourne occupancy rose 8.4% to 74.9% and ADR increased 21.1% to $248.04.
- Brisbane occupancy rose 4.5% to 78.2%, while ADR increased 2.2% to $255.35.
- Adelaide occupancy fell 0.3% to 75.5%, and ADR rose 3.2% to $202.61.
- Perth occupancy rose 2.0% to 85.4%, and ADR was up 5.7% to $251.54.
- Hobart occupancy rose 3.3% to 75.0% and ADR increased 3.6% to $191.38.
- Darwin occupancy fell 3.2% to 70.9% but ADR rose 1.9% to $238.02.
- ACT and Canberra occupancy fell 1.7% to 76.9% and ADR was up 1.9% to $203.41.
- Gold Coast occupancy was up 0.8% to 70.9% and ADR up 8.3% to $282.94.
| | |
Annual Market Research Survey
Take part in a short survey exploring how partnerships support our industry and members.
The survey takes around 10 minutes to complete, and your responses will contribute to research that helps inform future industry insights.
As a thank you for your time, you’ll go into the draw to win one of five $200 VISA eGift Cards.*
Start Survey
Your responses are confidential and will be used for research purposes. Individual responses will not be identified.
| | | |
Accommodation and food services earnings up 9% in 2024-5
Earnings in accommodation and food services rose 9.0% in 2024-25 to $19.3 billion, according to the latest data from the Australian Bureau of Statistics (ABS). That is a clear turnaround from 2023-24, when earnings dipped 0.8%. It also stands out against the wider economy, where total earnings across selected industries fell 2.2%, driven in part by the 20.5% drop in Mining. The accommodation subdivision drove the result, with earnings up 23.8% ($1.1 billion). Across the whole industry, total income rose 5.1% and industry value added grew 5.8%. Costs also climbed, with total expenses up 4.9%. Employment rose 2.7% (33,000 people), and wages and salaries increased 5.3% ($2.1 billion), a rise the ABS links to the minimum wage increase.
| | |
Sydney tops Asia Pacific in global sustainability ranking
Sydney has achieved its highest-ever ranking in the Global Destination Sustainability Index (GDS-Index), placing 7th globally and 1st in Asia Pacific among 81 participating destinations. The city scored 87.06.
The GDS-Index is a global benchmarking program that measures environmental, social and economic sustainability, as well as destination management and supplier performance. Business Events Sydney says that the result strengthens Sydney's appeal to international association conferences, corporate meetings and incentive programs, where organisers increasingly want destinations that can show measurable sustainability outcomes and long-term legacy benefits.
| | |
Drop me an email at policy@accommodationaustralia.org or give me a call on 0418 277 919 if you have any national policy issue that you think AA should be following up. If you know an AA member who is not receiving this advocacy report but wants to, then encourage them to email me and we can add them to the distribution list. Back issues of the fortnightly advocacy updates can be found here.
Kind Regards
Jenny Lambert OAM
National Policy Director
Accommodation Australia
| | | | |