|
Gordon T Long Research exclusively distributed at MATASII.com
Subscribe to Gordon T Long Research - $35 / Month - LINK
Complete MATASII.com Offerings - $55/Month - LINK
SEND YOUR INSIGHTFUL COMMENTS - WE READ THEM ALL - lcmgroupe2@comcast.net
| |
|
CURRENT MARKET PERSPECTIVE
(NOTE: You missed our Subscriber Mid-Week Update - You Are working with only half the info!)
| |
|
BEWARE OF A CONSOLIDATION LEG LOWER
FED "CAPTIVE" TO NEXT WEEK'S UNRELIABLE LABOR REPORT
Click All Charts to Enlarge
| |
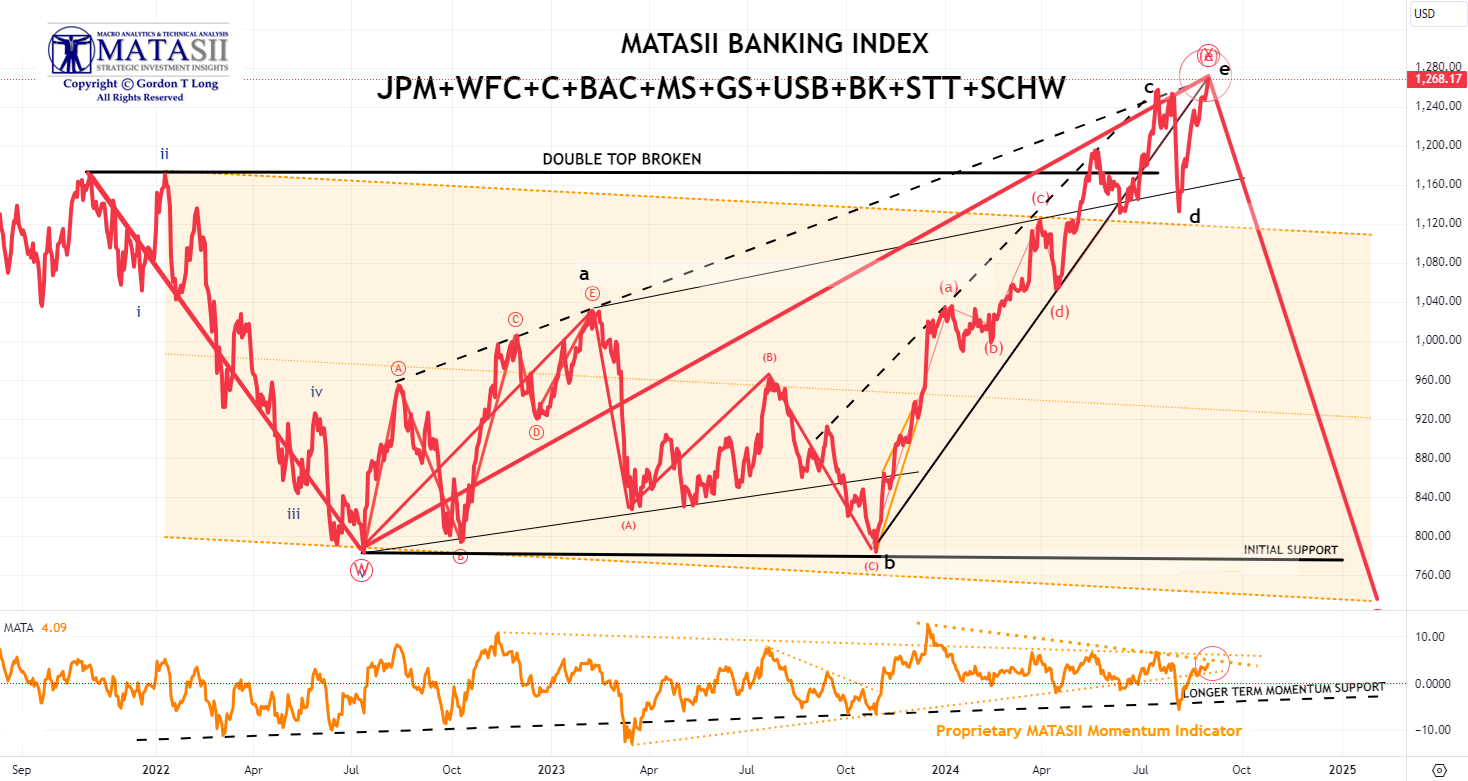
MATASII BANKING INDEX: US banking stocks technically indicating a near term consolidation may be in the wind as they might be "smelling" a yield and US dollar rebound. (See "Too Many 'Jaws'" section below.) | |
|
SENTIMENT - Rebounds to Pre-August 5th Levels
IN AUGUST the S&P 500 traded in a 500+ point band (about 10%) as investors first became very concerned that an imminent recession was being ignored by the Fed, before becoming more convinced that a recession may not be that imminent and the Fed is poised to cut rates at its September meeting.
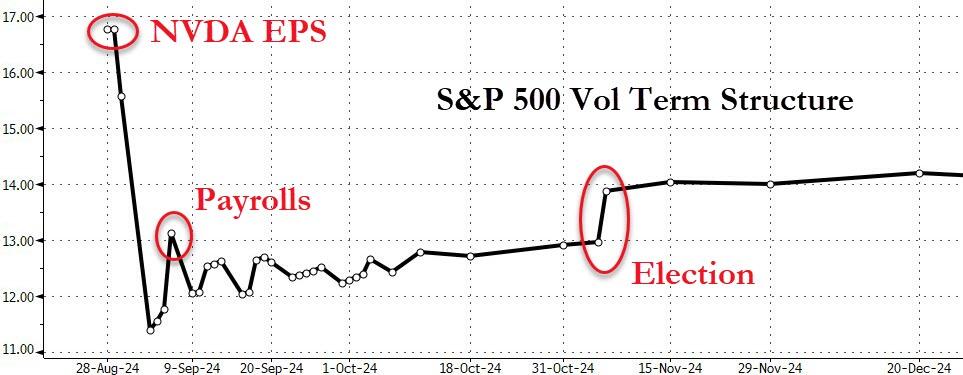
CHART RIGHT ABOVE:
The options markets readied for NVDA Earnings!
Clearly pointing down.
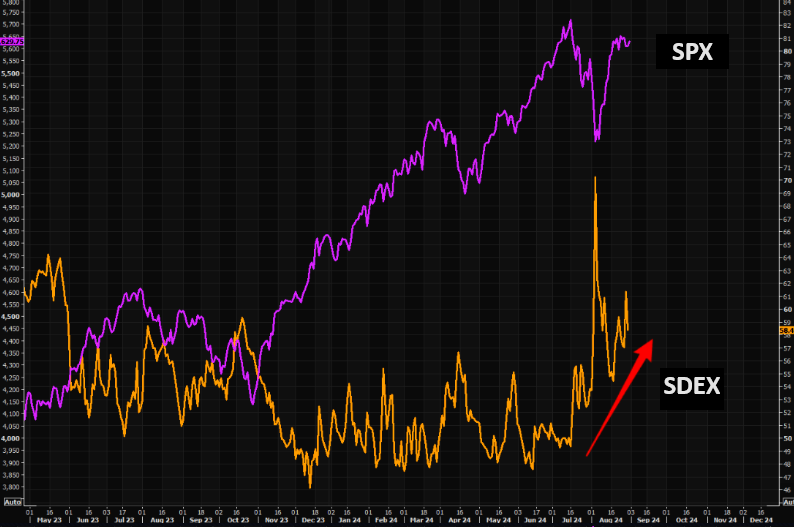
CHART RIGHT MIDDLE:
In August the VIX spiked above 60 before receding back to 15 as uncertainty receded.
CHART RIGHT BOTTOM:
BofA's bull/bear indicator inched higher this week - it was the first weekly rise of BofA Bull & Bear Indicator in past month on big inflows to stocks & bonds despite higher FMS cash (4.3%) and additional hedges against lower S&P500 and stronger Japanese yen.
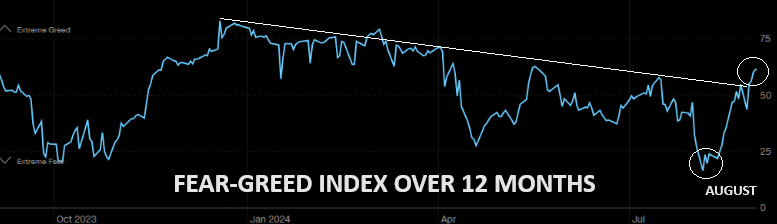
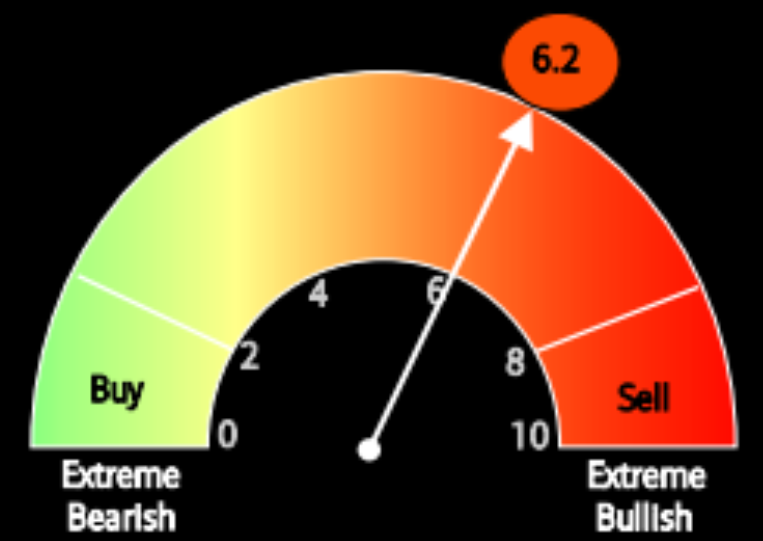
CHART BELOW
From extreme fear to "well" into greed land in a few weeks.
| |
|
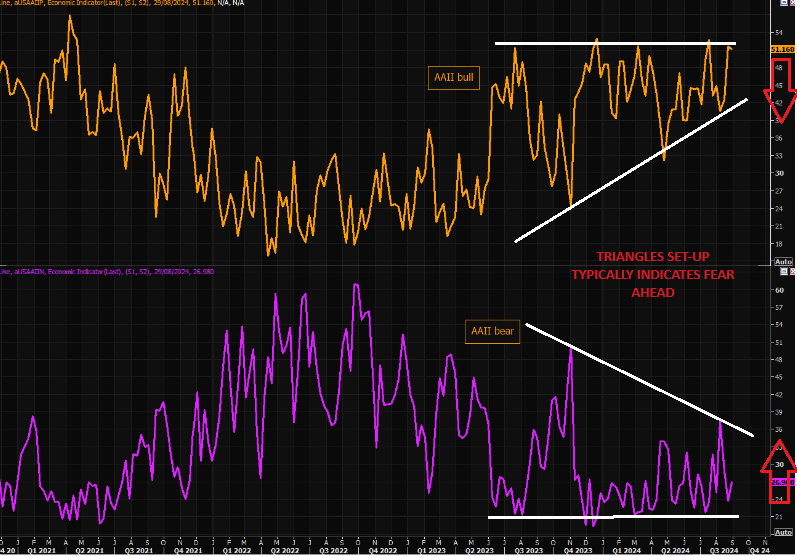
AAII BULL-BEAR: Triangle Set up typically indicates FEAR Ahead. | |
DOWNSIDE PROTECTION: Skew, remains well bid (below). Investors buying equities and protection is "natural", but this turns into more "ugly" dynamics should we sell off as dealers would re-enter short gamma on a sell off, magnifying all moves. | |
|
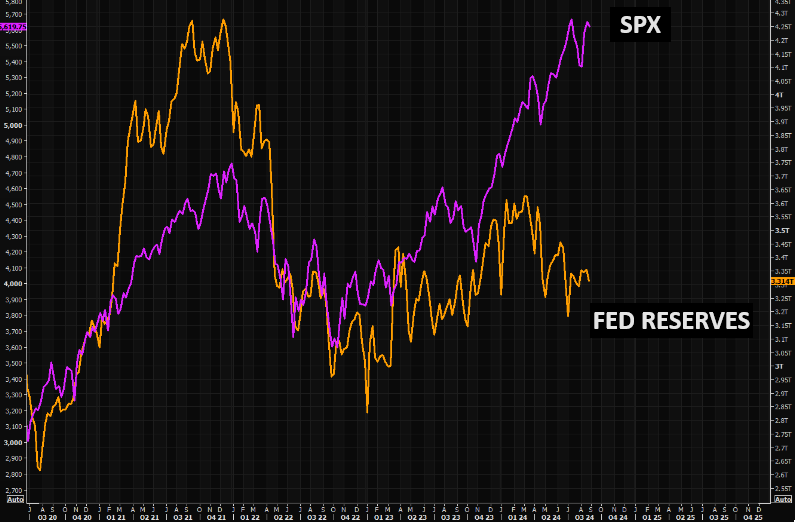
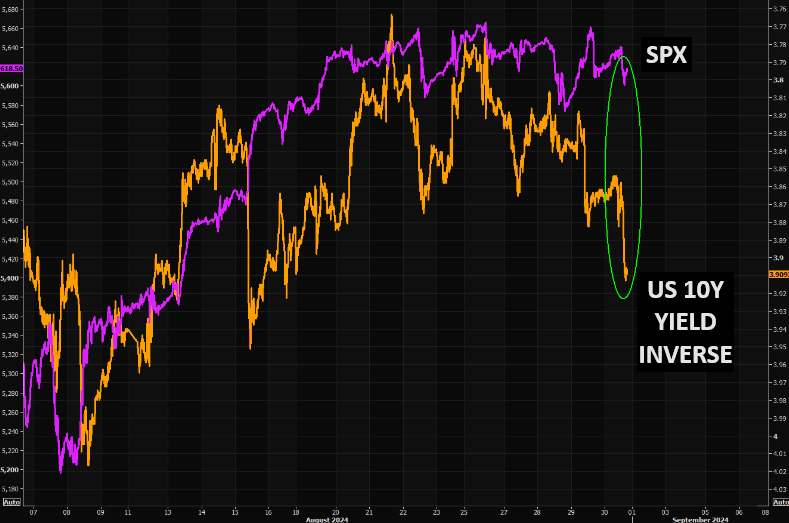
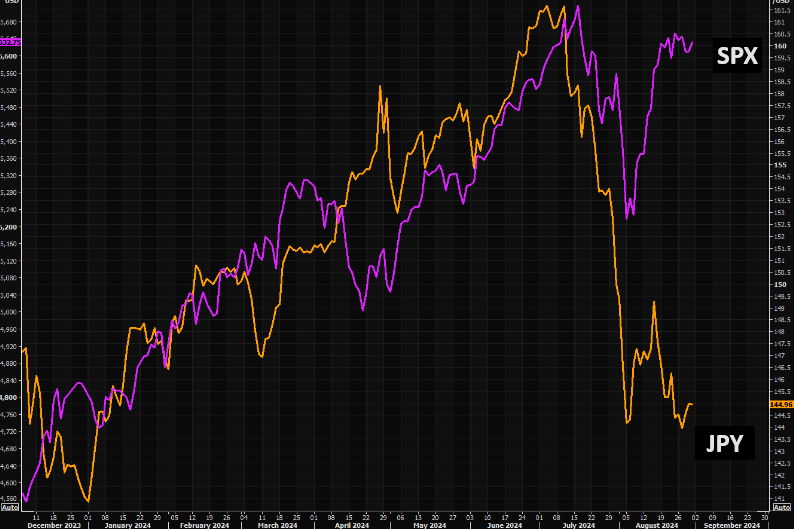
JUST TOO MANY MARKET "JAWS" - Historically Close The Gaps!
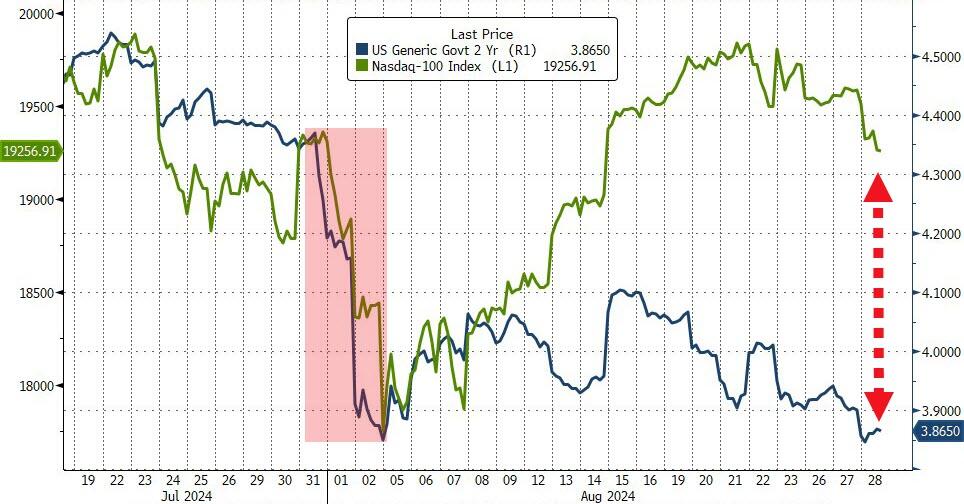
CHART BELOW: Is it time for stocks to catch back down to bonds' reality?
| |
SPX v FED RESERVES GAP: The gap between SPX and Fed reserves remains massive | SPX v 10Y YIELD (inv): Short term gap between SPX and the US 10 year (inv) is widening significantly!!! | SPX v JPY GAP: Not part of the narrative at the moment, but the gap vs SPX is huge. BUT the Bank of Japan is expected to hike rates a third which typically pushes the Yen higher! | |
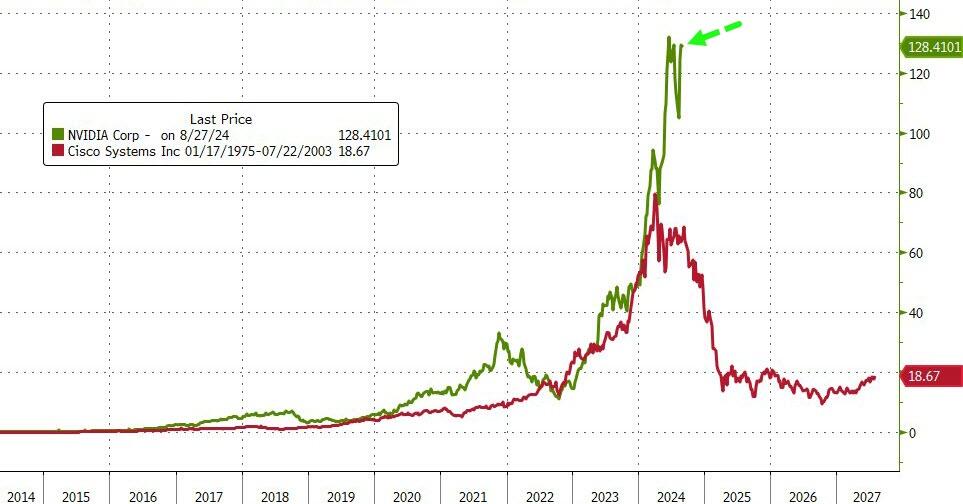
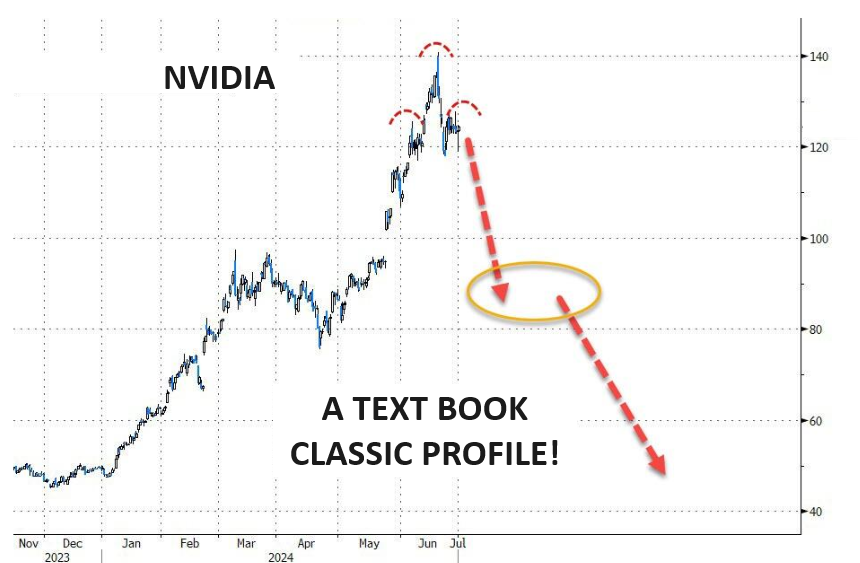
CHART RIGHT: NVDA v the dominant darling CSCO of the Dotcom Bubble (for those who recall). | |  |
| |
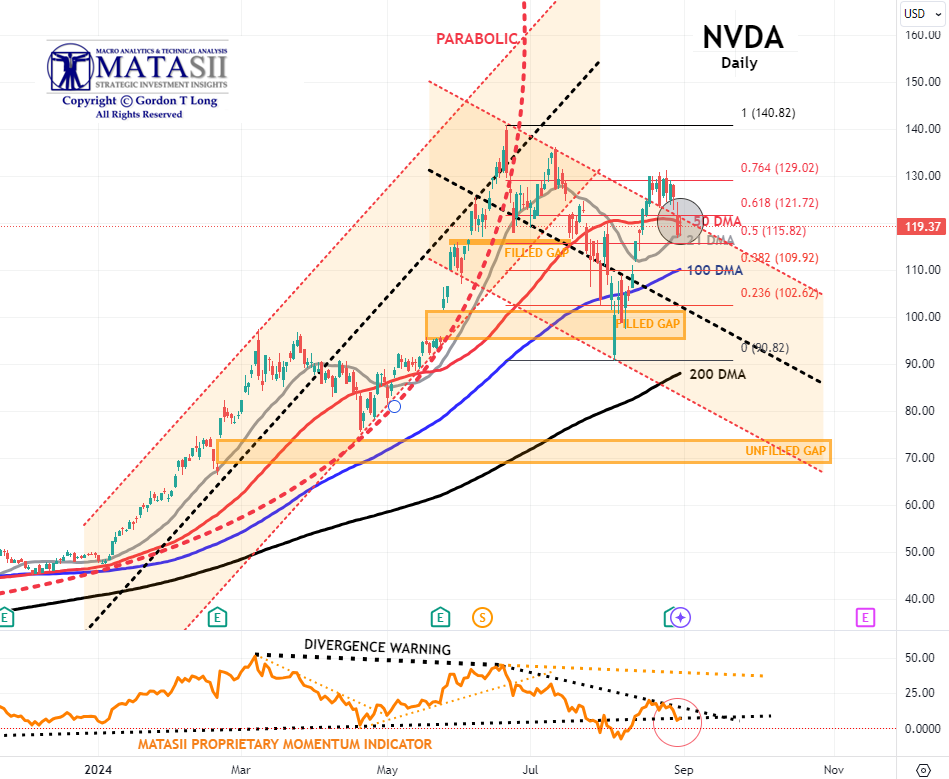
- NVDA decidedly broke below the 50 DMA, finding support at the 21 DMA before counter-rallying back through and above the 50 DMA. It closed Friday at the 50 DMA.
- The MATASII Proprietary Momentum Indicator (lower pane) aso found support at a lower support trend line.
- The Dotted Black Trend line in the MATASII Proprietary Momentum Indicator, (lower pane below), has been signaling this sell-down was coming for some time now.
- Divergence is normally seen as a warning to the downside and is still ahead if the Divergence isn't removed by a movement higher in Momentum.
- At some point, the major unfilled gaps (at much lower levels) must be filled. NVDA therefore may no longer become a Short to Intermediate Long Term hold, but rather a position trading stock as other competitors enter the space and force margins and the earnings growth rate contracts.
| |
|
YOUR DESKTOP / TABLET / PHONE ANNOTATED CHART
Macro Analytics Chart Above: SUBSCRIBER LINK
| |
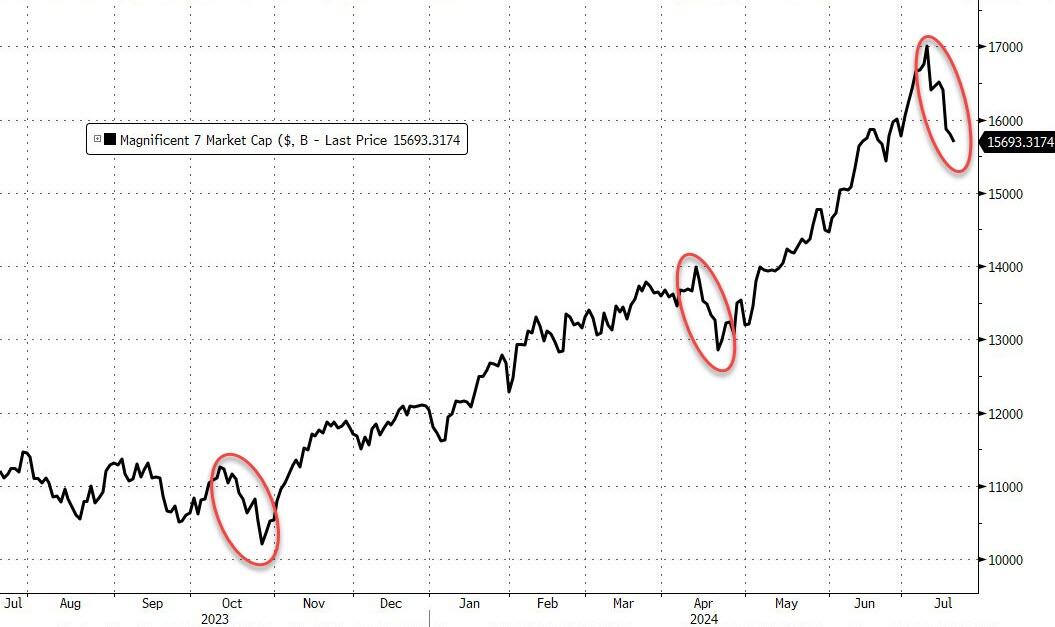
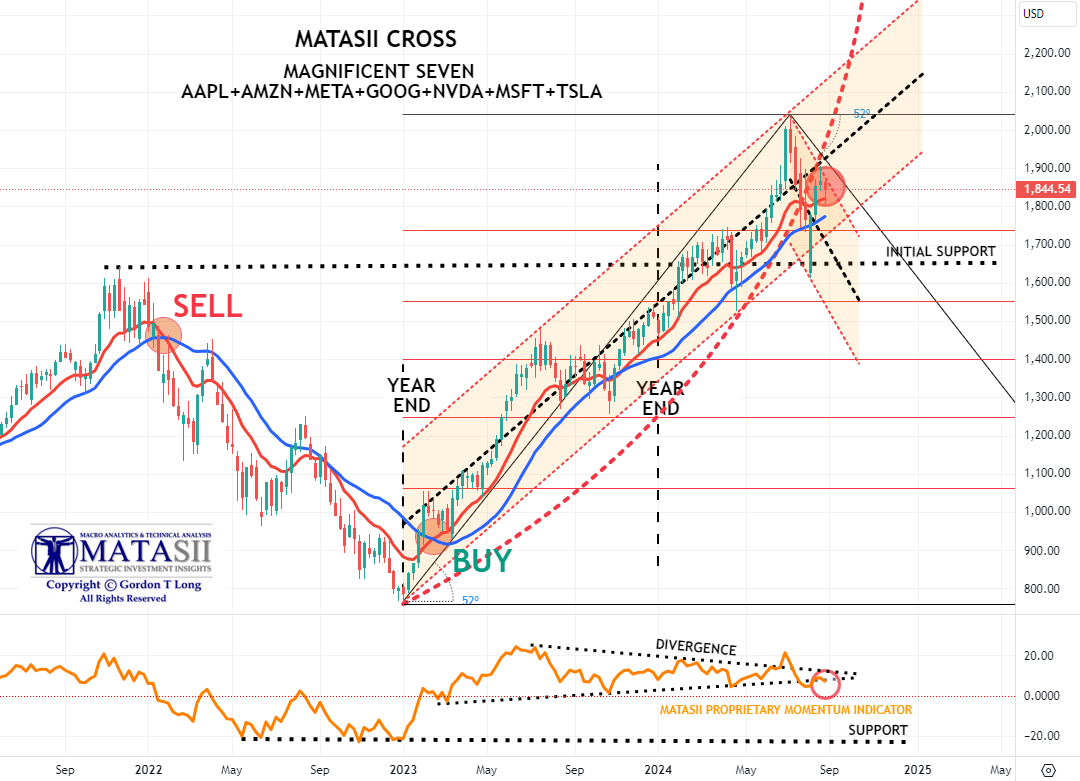
AS GOES NVDA SO GOES THE MAG-7
AS GOES THE MAG-7 SO GOES THE MARKET!
MAGNIFICENT 7
CONTROL PACKAGE
- APPLE - AAPL - DAILY (CHART LINK)
- AMAZON - AMZN - DAILY (CHART LINK)
- META - META - DAILY (CHART LINK)
- GOOGLE - GOOG - DAILY (CHART LINK)
- NVIDIA - NVDA - DAILY (CHART LINK)
- MICROSOFT - MSFT - DAILY (CHART LINK)
- TESLA - TSLA - DAILY (CHART LINK)
- The Intermediate Momentum Indicator trend line (Lower pane) appears to be finding support at its lower trend line.
- As we said in former reports: "A brief counter rally may ensue next week, but it is highly likely that Longer term Momentum Support (lower pane black dashed line) will soon be tested".
- Continued caution is advised since major global "Dark Pools" have been identified as presently operating behind the scenes on the Mag-7.
| |
|
YOUR DESKTOP / TABLET / PHONE ANNOTATED CHART
Macro Analytics Chart Above: SUBSCRIBER LINK
| |
|
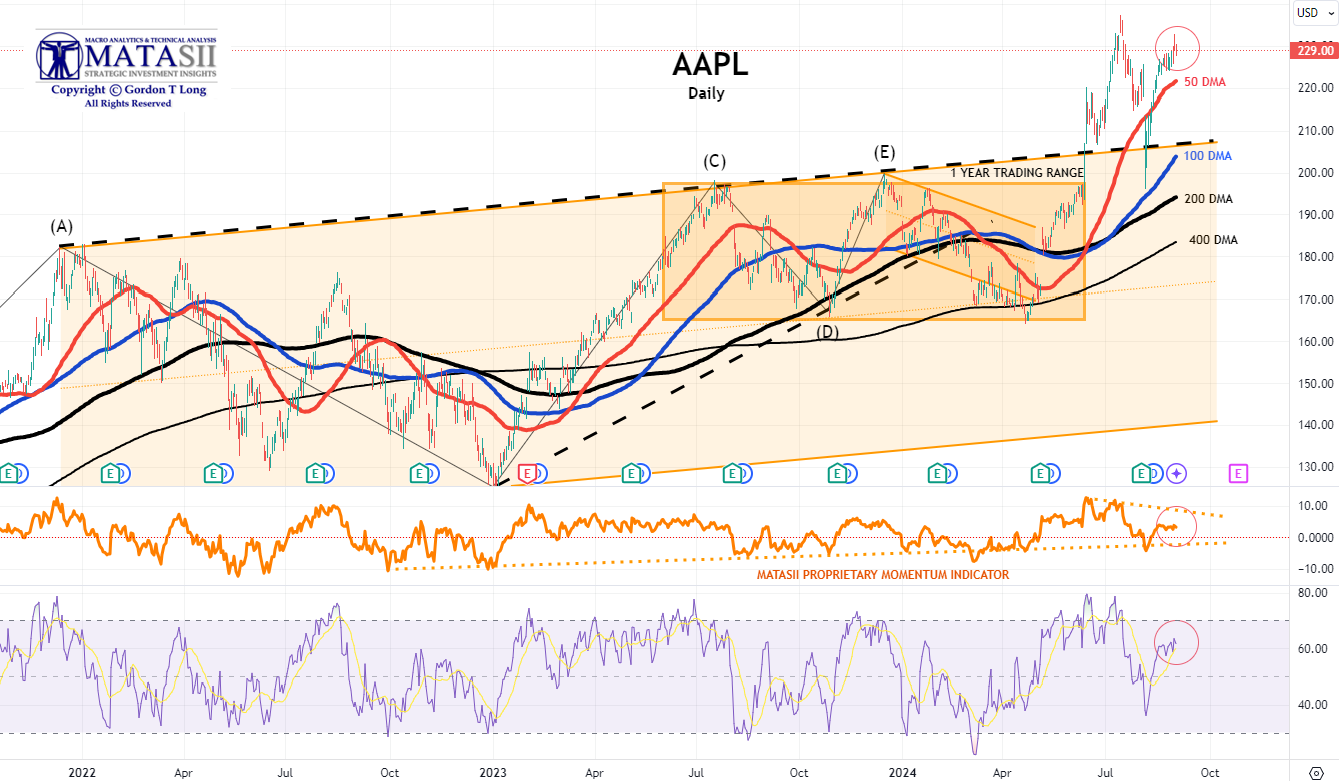
APPLE - AAPL - DAILY
- AAPL is likely to test for support its 50 DMA and possibly its upper channel line of its rising trend channel.
- The MATASII Proprietary Momentum Indicator continues to show an overall downward trend..
| |
|
YOUR DESKTOP / TABLET / PHONE ANNOTATED CHART
Macro Analytics Chart Above: SUBSCRIBER LINK
| |
|
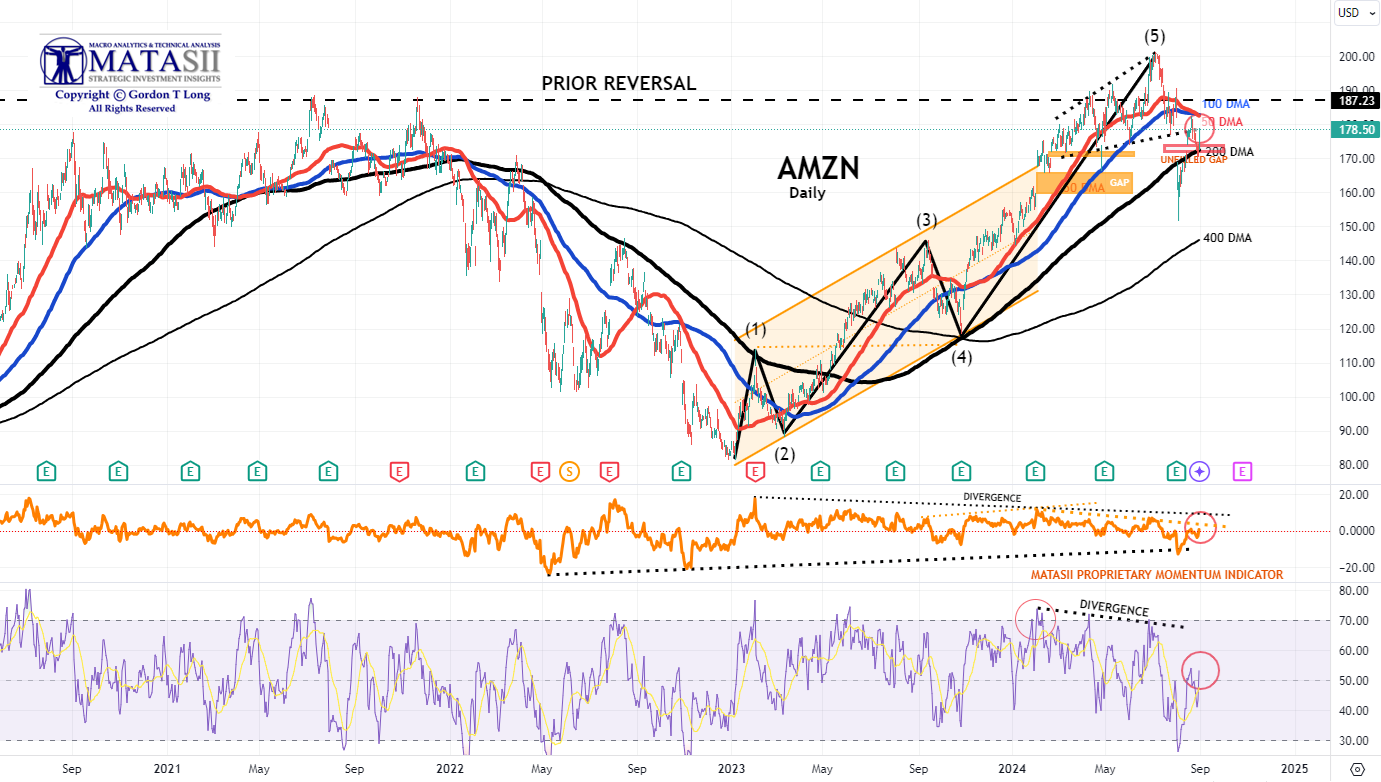
AMAZON - AMZN - DAILY
- AMZN after finding support at the 200 DMA surged to test the underside of its expanding wedge (dotted black lines).
- The MATASII Proprietary Momentum Indicator (middle pane) pushed higher to test its overhead resistance trend line (dotted orange line).
| |
|
YOUR DESKTOP / TABLET / PHONE ANNOTATED CHART
Macro Analytics Chart Above: SUBSCRIBER LINK
| |
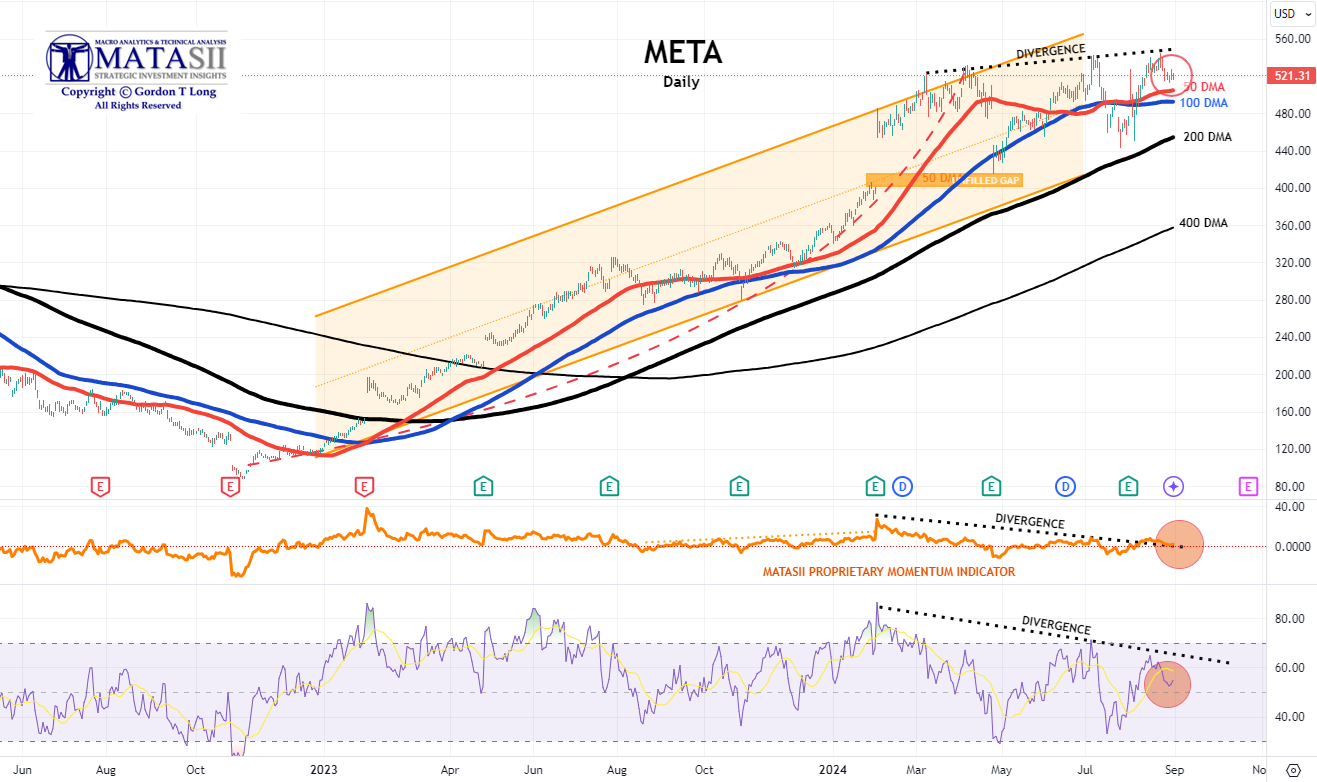
META - META - DAILY
- META is showing weakness is likely to test initial support at the 50 / 100 DMA support level.
- The MATASII Proprietary Momentum Indicator (middle pane) continues to follow the "Divergence" trend line (black dotted line) lower.
| |
|
YOUR DESKTOP / TABLET / PHONE ANNOTATED CHART
Macro Analytics Chart Above: SUBSCRIBER LINK
| |
|
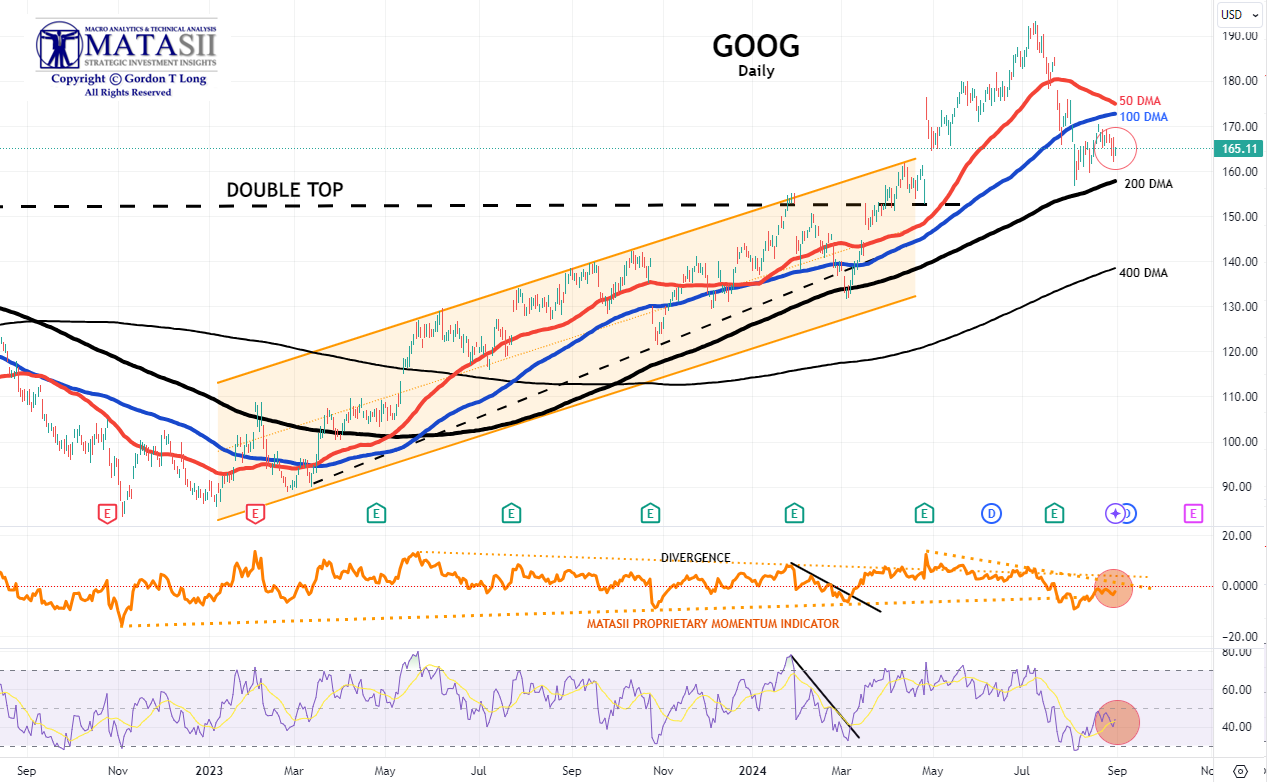
GOOGLE - GOOG - DAILY
- GOOG is showing weakness and is likely to test support at the 200 DMA support level.
- The MATASII Proprietary Momentum Indicator (middle pane) continues to stay below the longer term "Divergence" trend line (orange dotted line). It tested its lower support trend line this week.
| |
|
YOUR DESKTOP / TABLET / PHONE ANNOTATED CHART
Macro Analytics Chart Above: SUBSCRIBER LINK
| |
|
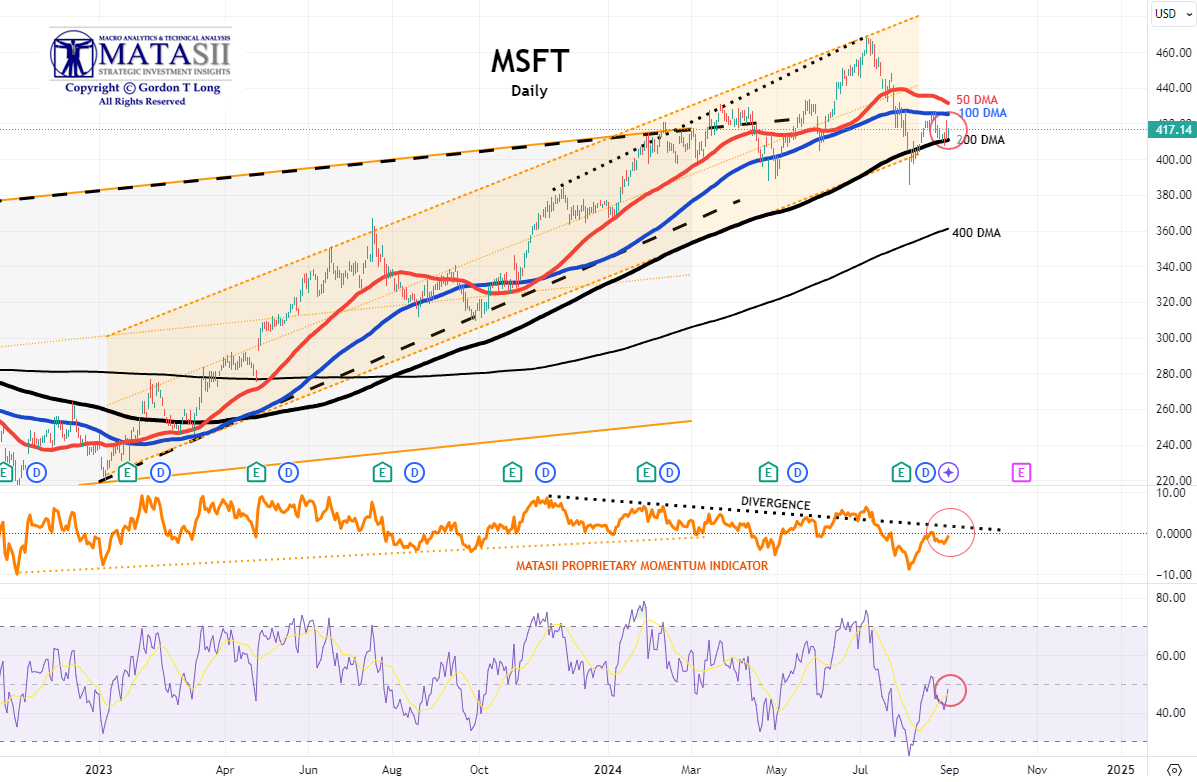
MICROSOFT - MSFT - DAILY
- MSFT found support this week at the 200 DMA level before bouncing.
- The MATASII Proprietary Momentum Indicator (middle pane) continues to stay below the "Divergence" trend line (black dotted line) - a negative indication while it fails to attempt to test the divergence trend line.
| |
|
YOUR DESKTOP / TABLET / PHONE ANNOTATED CHART
Macro Analytics Chart Above: SUBSCRIBER LINK
| |
|
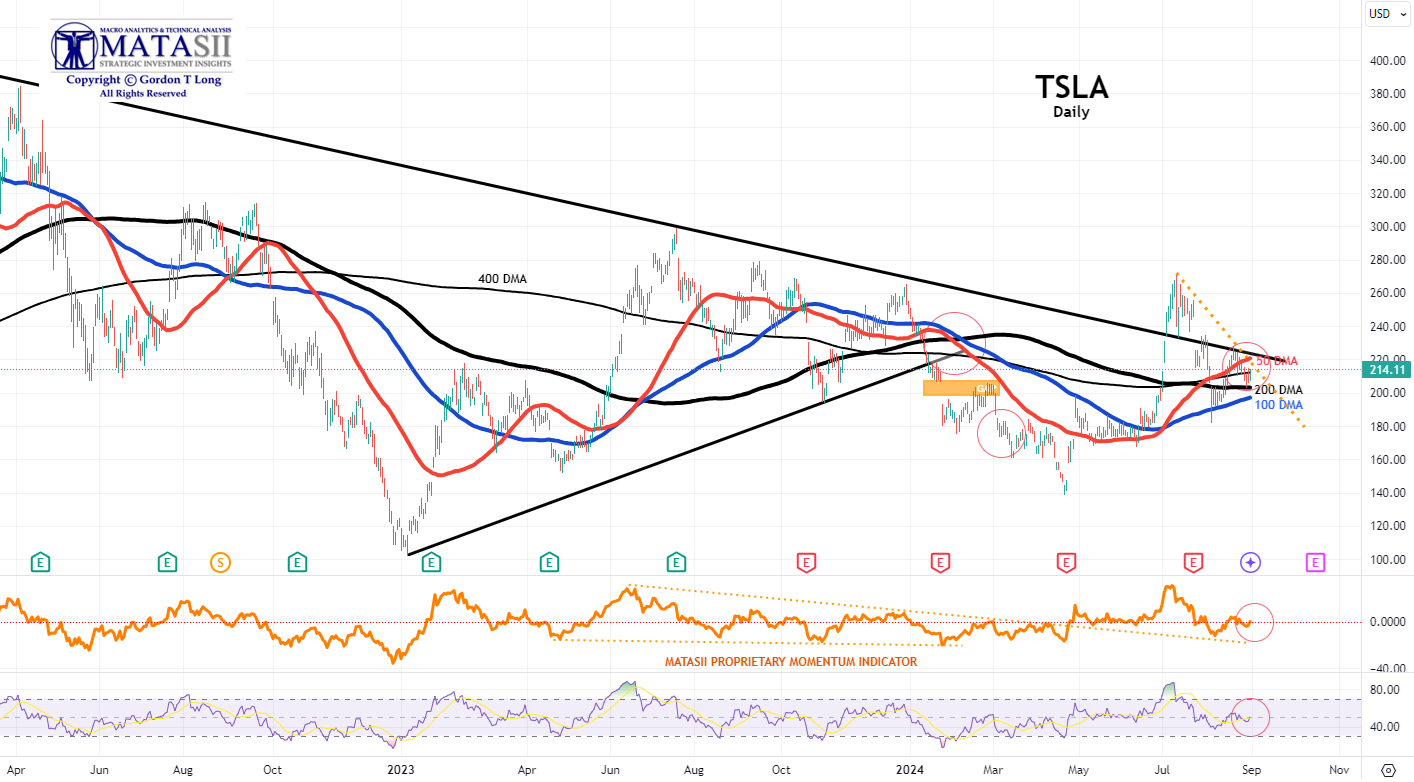
TESLA - TSLA - DAILY
- TSLA found initial support at the 400 DMA, but is likely to test support at the lower 200 DMA.
- The MATASII Proprietary Momentum Indicator (middle pane) and the RSI continue to indicate lower levels need to be tested for support.
| |
|
YOUR DESKTOP / TABLET / PHONE ANNOTATED CHART
Macro Analytics Chart Above: SUBSCRIBER LINK
| |
"CURRENCY" MARKET (Currency, Gold, Black Gold (Oil) & Bitcoin) | |
|
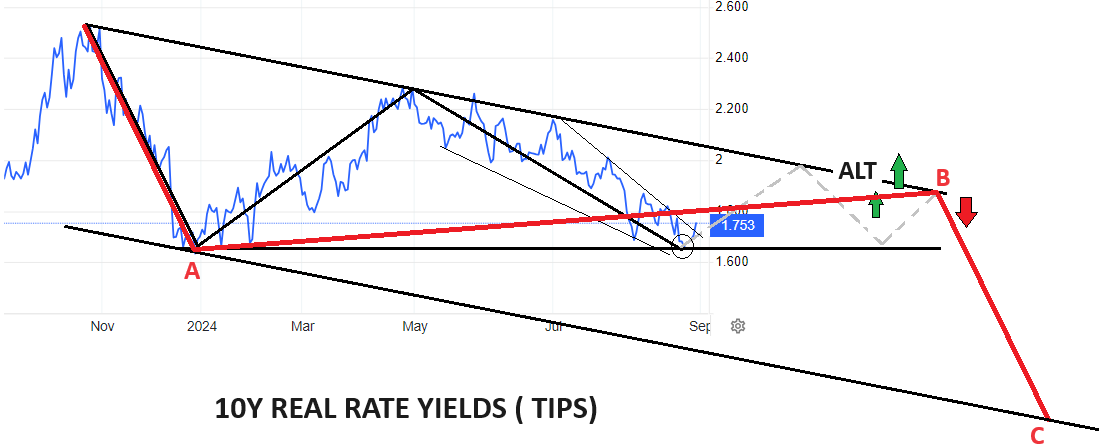
10Y REAL YIELD RATE (TIPS)
Real Rates bounced-off our lower support trend line, which gives us confidence with the two alternative counts that could occur, (shown in the chart to the right - as of close week ending 08/30/24). (LATEST)
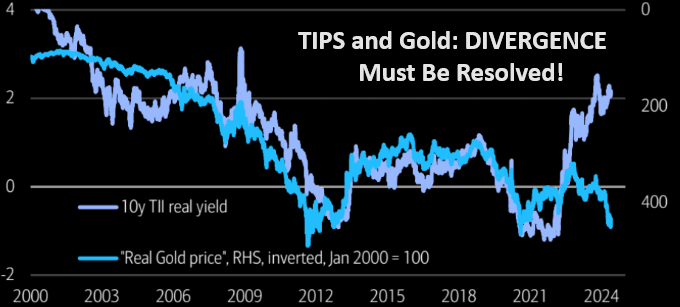
NOTE: Gold is suggesting it will be resolved by the red line (chart right) with a fall in real rates (chart lower right) with rising Gold prices.
| |
CONTROL PACKAGE
There are TEN charts we have outlined in prior chart packages, which we will continue to watch closely as a CURRENT Control Set:
-
US DOLLAR -DXY - MONTHLY (CHART LINK)
-
US DOLLAR - DXY - DAILY (CHART LINK)
-
GOLD - DAILY (CHART LINK)
-
GOLD cfd's - DAILY (CHART LINK)
-
GOLD - Integrated - Barrick Gold (CHART LINK)
- SILVER - DAILY (CHART LINK)
-
OIL - XLE - MONTHLY (CHART LINK)
-
OIL - WTIC - MONTHLY - (CHART LINK)
-
BITCOIN - BTCUSD -WEEKLY (CHART LINK)
-
10y TIPS - Real Rates - Daily (CHART LINK)
| |
|
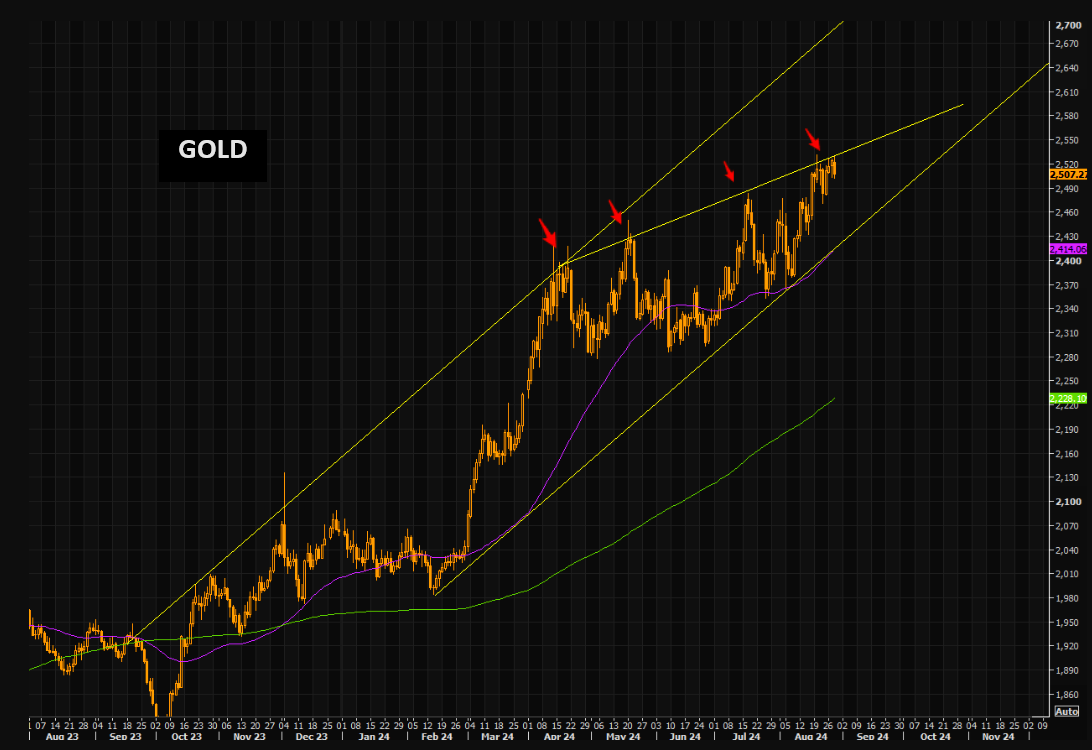
GOLD
CHART RIGHT:
The break out move higher refuses igniting properly. The longer term trend is intact, but the fact gold isn't able to trade above the upper short term trend is a sign of fading momentum. Let's see how this plays out, but gold bulls need the shiny metal to trade "well" above the upper trend line.
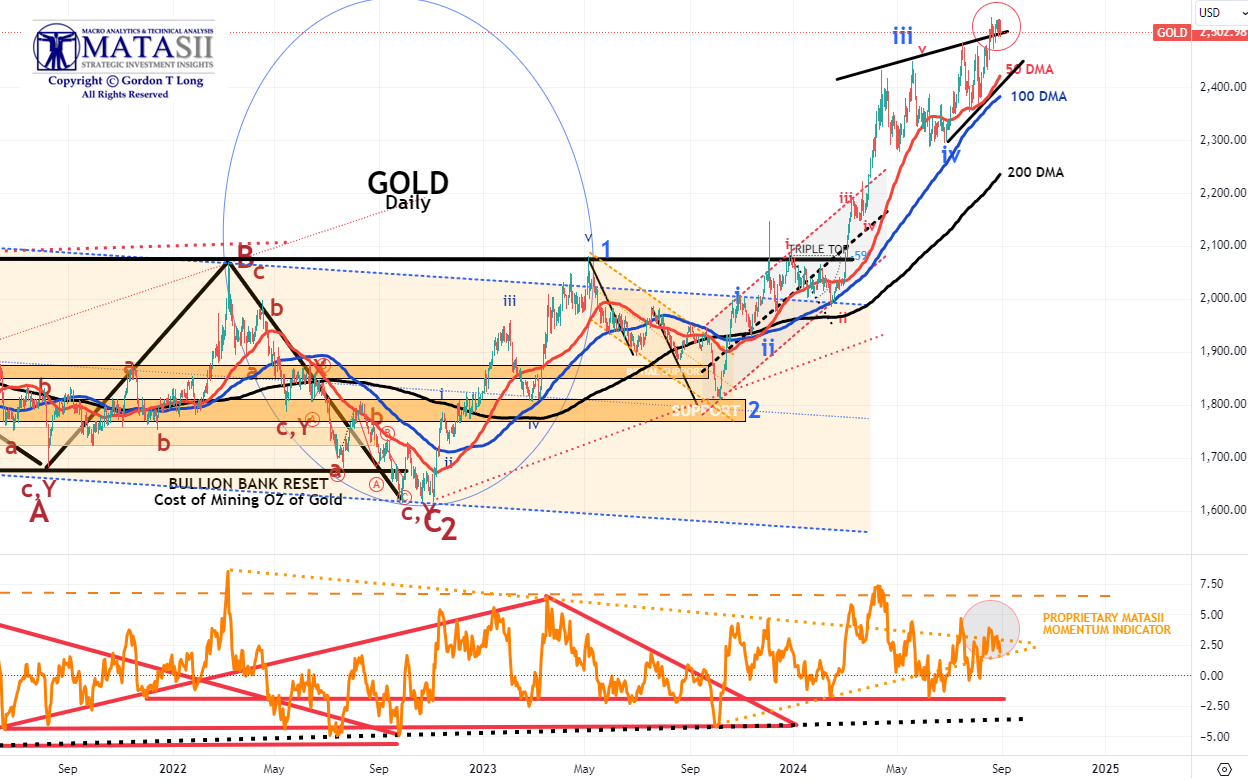
CHART BELOW
- Gold tested and broke through its overhead resistance line (black line) but has gained little since.
- The potential rising triangle suggests gold (if true) may be reaching towards an Intermediate term high. However, the Macro suggests higher prices with the dollar continuing to fall and Real Rates weakening.
- The MATASII Proprietary Momentum Indicator (Lower pane) is within a "momentum wedge" that will soon be broken - with the probabilities likely to the upside.
| |
|
YOUR DESKTOP / TABLET / PHONE ANNOTATED CHART
Macro Analytics Chart Above: SUBSCRIBER LINK
| |
|
CONTROL PACKAGE
There are FIVE charts we have outlined in prior chart packages that we will continue to watch closely as a CURRENT "control set":
- The S&P 500 (CHART LINK)
- The DJIA (CHART LINK)
- The Russell 2000 through the IWM ETF (CHART LINK)
- The MAGNIFICENT SEVEN (CHART ABOVE WITH MATASII CROSS - LINK)
- Nvidia (NVDA) (CHART LINK)
| |
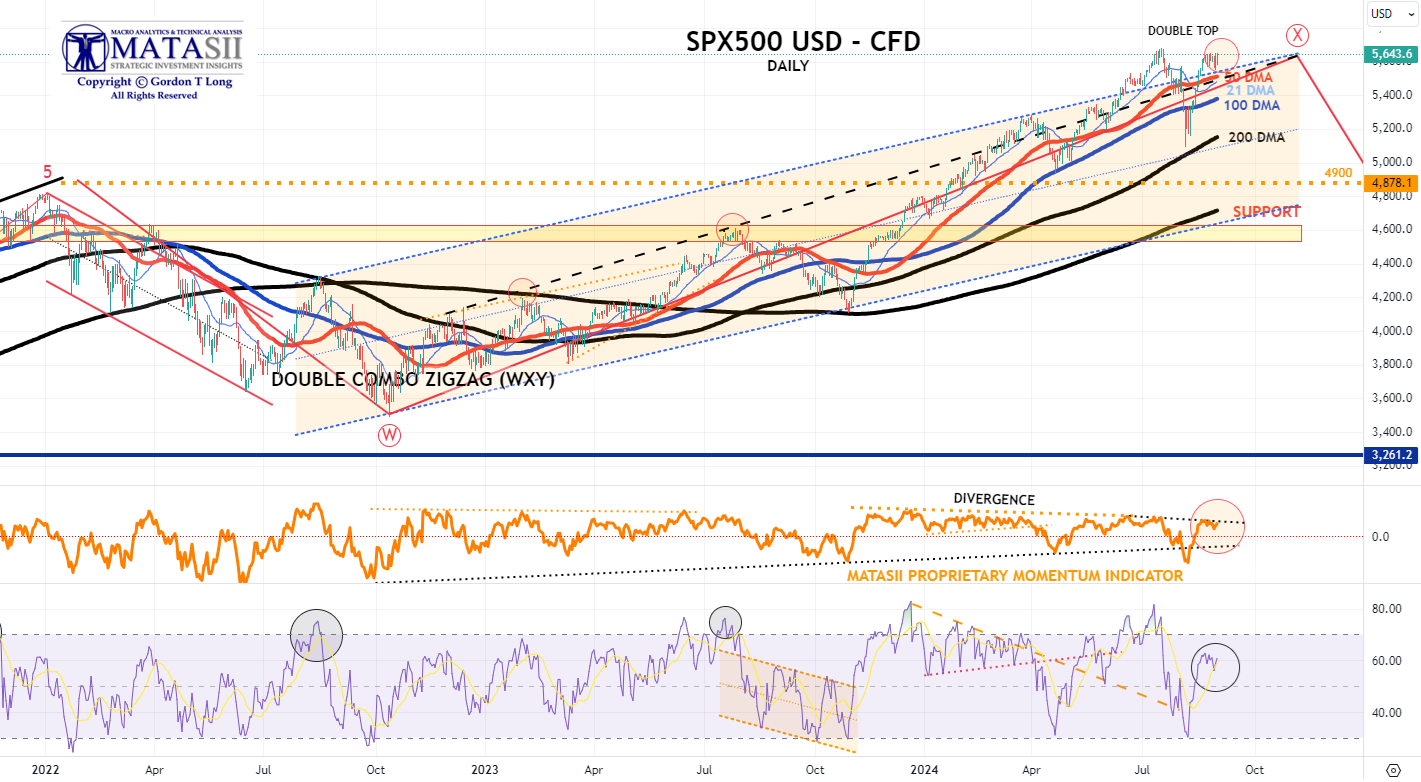
S&P 500 CFD
- We have a Double Top forming.
- The S&P 500 cfd has broken decidedly higher on dollar weakness. Many wonder if this is a Bear Market trap often accompanying a major sell-off? A sell-off that didn't test the 200 DMA?
- The MATASII Proprietary Momentum Indicator (middle pane) is currently testing its overhead resistance "Divergence" level as part of a large wedge that appears soon to end.
| |
YOUR DESKTOP / TABLET / PHONE ANNOTATED CHART
Macro Analytics Chart Above: SUBSCRIBER LINK
| |
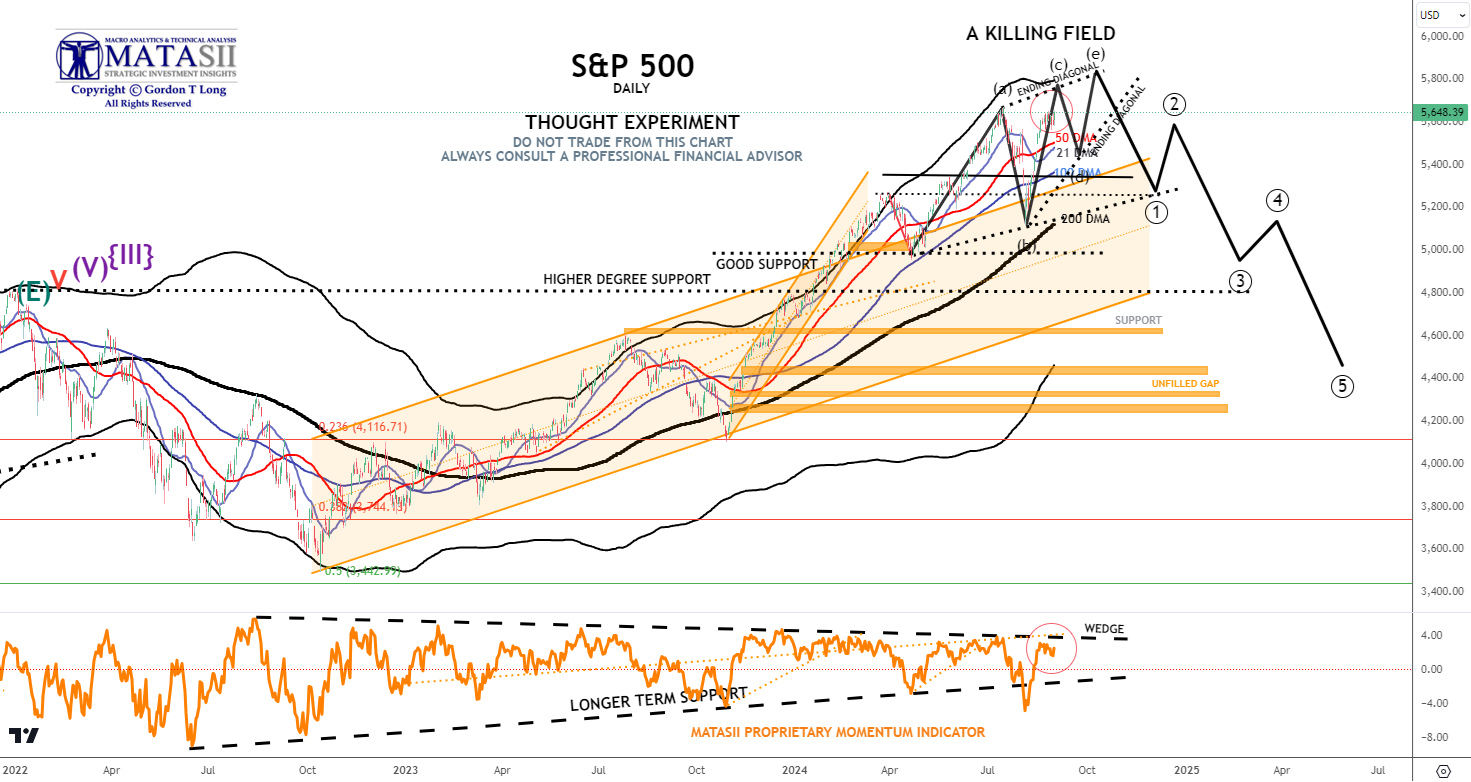
S&P 500 - Daily - Our Thought Experiment
OUR CURRENT ASSESSMENT IS THAT THE INTERMEDIATE TERM IS LIKELY TO LOOK LIKE THE FOLLOWING:
NOTE: To reiterate - "the black labeled activity shown below, between now and September, looks like a "Killing Field", where the algos take Day Traders, "Dip Buyers", the "Gamma Guys" and FOMO's all out on stretchers!"
WHY DID I CALL IT A KILLING FIELD?: "We remain in short gamma land. Dealers had to sell deltas into the 5450 support area during the July 30 move lower. The same dealers had to chase all that sold delta and much more at higher prices as they became shorter and shorter deltas when the market ripped higher yesterday. Today is another brutal day for the short gamma community, as they have been forced to sell (at much lower prices) all that delta they bought yesterday. Add to it poor summer liquidity, and you realize why things are moving in an erratic way."
- We have a Double Top forming.
- The S&P 500, like the S&P 500 cfd, broken decidedly higher on dollar weakness before retreating after putting in a potential Double Top.
- The MATASII Proprietary Momentum Indicator (lower pane) supplied initial support at its longer term rising support trend line before being decisively broken - then rose strongly. This should be seen as an indication that final support has not yet been found, (likely the 200 DMA).
- The longer term Momentum Indicator wedge (dashed black lines) is narrowing. It appears the S&P 500 is looking to test this overhead resistance level.
|  | |
YOUR DESKTOP / TABLET / PHONE ANNOTATED CHART
Macro Analytics Chart Above: SUBSCRIBER LINK
| |
STOCK MONITOR: What We Spotted
|  | |
LOWER BOND YIELDS CORRECTLY SPOT A WEAKER MACRO
CONTROL PACKAGE
There are FIVE charts we have outlined in prior chart packages that we will continue to watch closely as a CURRENT "control set":
- The 10Y TREASURY NOTE YIELD - TNX - HOURLY (CHART LINK)
- The 10Y TREASURY NOTE YIELD - TNX - DAILY (CHART LINK)
- The 10Y TREASURY NOTE YIELD - TNX - WEEKLY (CHART LINK)
- The 30Y TREASURY BOND YIELD - TNX - WEEKLY (CHART LINK)
- REAL RATES (CHART LINK)
FISHER'S EQUATION = 10Y Yield = 10Y INFLATION BE% + REAL % = 2.162% + 1.7534% = 3.915%
5 YR AUCTION: The US Treasury sold USD 70bln of 5yr notes at a high yield of 3.645%, tailing the When Issued by 0.3bps, an improvement from July's 1.1bp tail and six auction average of a 0.4bp tail. The Bid-to-Cover of 2.41x was in line with the prior and a bit above the average of 2.38x. Dealers took a lower percentage of the auction than in July, and beneath the six-auction average. Indirect demand ticked up to 70.5% from 67.2%, above the 66.8% average, while direct demand ticked down to 16.3% from 18.8%, beneath the 17.9% average.
7YR AUCTION: Overall a relatively weak 7yr auction due to weak direct demand. The US Treasury sold USD 44bln of 7yr notes at a high yield of 3.770%, tailing the when issued of 3.761% by 0.9bps, weaker than the prior stop through of 0.4bps and six auction average stop through of 0.1bps. The Bid-to-Cover of 2.50x was softer than both the prior and six-auction average too. The breakdown saw direct demand fall to 11.19% from 16.8%, beneath the 17.4% six-auction average, while indirect demand saw a slight tick up to 75.09%, above the 69.2% average. The weak direct demand saw dealers take home a larger proportion of the auction than was seen in July at 13.72%, up from 8.9%, however, it was only marginally above the six-auction average.
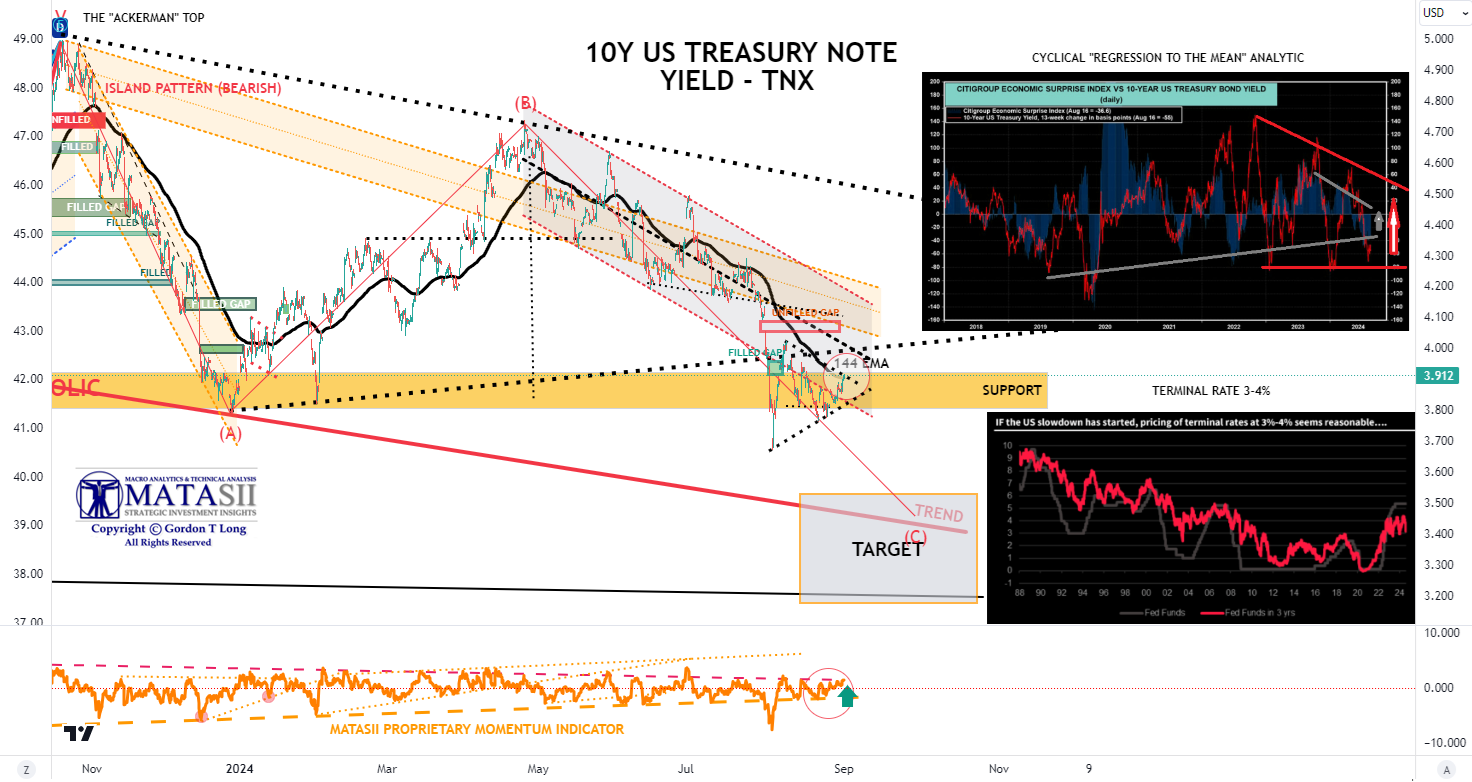
|
- The TNX rose on Friday to finally test its 144 EMA (black line)
- The TNX appears to be putting in a potential ABCDE continuation triangle pattern. This suggests yields will fall when the continuation triangle is complete.
- The Momentum Indicator (lower pane) is also showing a test of its overhead resistance level.
- The Bond Vigilante's continue to send a clear message to the Fed that they are 100 bps behind the curve and yields are heading lower.
| |
YOUR DESKTOP / TABLET / PHONE ANNOTATED CHART
Macro Analytics Chart Above: SUBSCRIBER LINK
| |
NOTICE Information on these pages contains forward-looking statements that involve risks and uncertainties. Markets and instruments profiled on this page are for informational purposes only and should not in any way come across as a recommendation to buy or sell in these assets. You should do your own thorough research before making any investment decisions. MATASII.com does not in any way guarantee that this information is free from mistakes, errors, or material misstatements. It also does not guarantee that this information is of a timely nature. Investing in Open Markets involves a great deal of risk, including the loss of all or a portion of your investment, as well as emotional distress. All risks, losses and costs associated with investing, including total loss of principal, are your responsibility.
FAIR USE NOTICE This site contains copyrighted material the use of which has not always been specifically authorized by the copyright owner. We are making such material available in our efforts to advance understanding of environmental, political, human rights, economic, democracy, scientific, and social justice issues, etc. We believe this constitutes a ‘fair use’ of any such copyrighted material as provided for in section 107 of the US Copyright Law. In accordance with Title 17 U.S.C. Section 107, the material on this site is distributed without profit to those who have expressed a prior interest in receiving the included information for research and educational purposes. If you wish to use copyrighted material from this site for purposes of your own that go beyond ‘fair use’, you must obtain permission from the copyright owner.
========
| |
IDENTIFICATION OF HIGH PROBABILITY TARGET ZONES | |
Learn the HPTZ Methodology!
Identify areas of High Probability for market movements
Set up your charts with accurate Market Road Maps
Available at Amazon.com
| |
The Most Insightful Macro Analytics On The Web | | | | |